
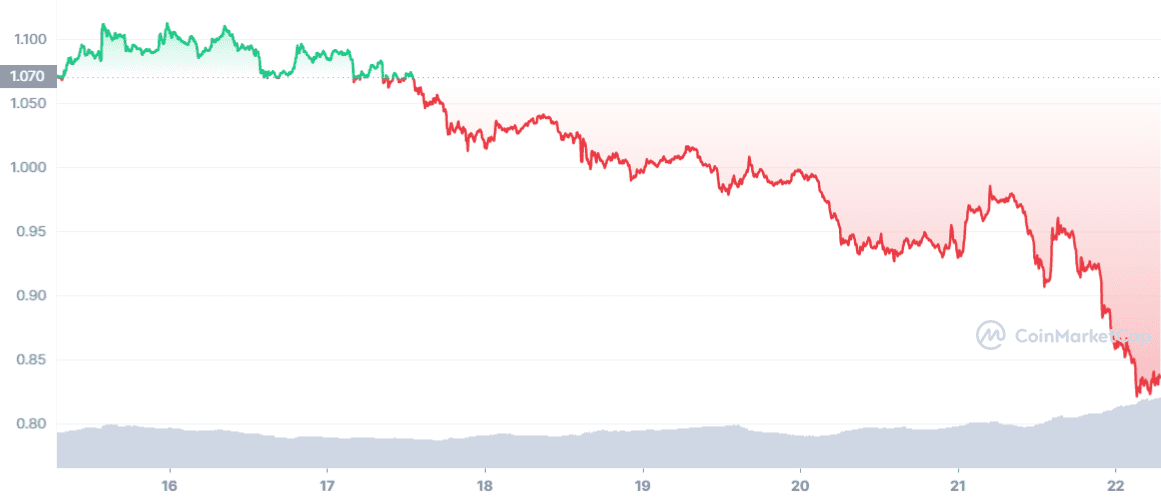
NEW DELHI (CoinChapter.com) — Cardano (ADA) dropped over 7.5% to $0.55 this May 16, paring a portion of the gains recorded at the end of last week. Nonetheless, the token’s interim technical outlook has turned bullish.
Oversold bounce to continue?
ADA bounced after reaching its Bollinger Bands pattern’s ‘oversold’ territory.
In detail, Bollinger bands consist of a simple moving average (the middle band) and an upper and lower band. The two bands are standard deviations from the middle band. Therefore, when an asset’s prices break below the lower bands, it denotes an oversold condition.
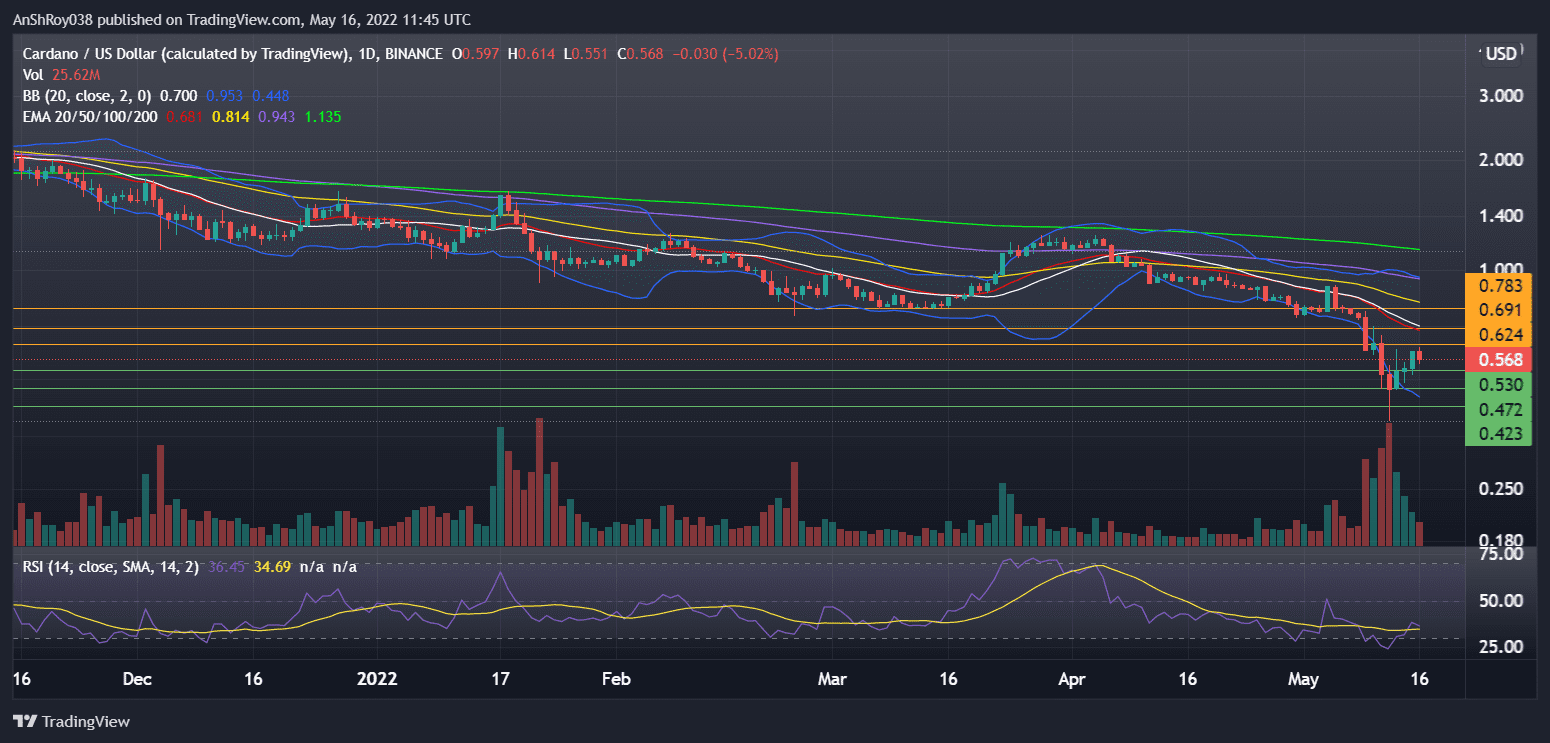
ADA has merely reached the bands’ neutral zone, suggesting that the Cardano token has more room to grow.
Another technical indicator, dubbed the relative strength index (RSI), suggests that ADA’s interim bounce will continue in the coming sessions. In detail, on Friday, ADA’s RSI rebounded from oversold regions — below 30 — and is currently inside the neutral zone.
Related: Cardano (ADA) gains 20% in 24 hours – recovery or dead cat bounce?If Monday’s decline starts a downtrend, ADA prices might fall to immediate support near $0.53. A breach below immediate support could result in Cardano prices testing support near $0.47, from where ADA rebounded on Friday.
Finally, a sustained downtrend might see ADA prices fall to $0.42, a price level Cardano reached in early February last year.
Cardano’s MACD Indicating Strengthening Bullishness
Meanwhile, momentum oscillator MACD is showing a strengthening upward momentum for ADA. Negative bars on the MACD histogram are contracting, indicating the MACD line (difference between 12-day and 26-day EMA) might be moving towards the MACD signal line (9-day EMA of MACD).
Contracting negative bars indicate a bullish crossover between the MACD and its signal line might occur soon.
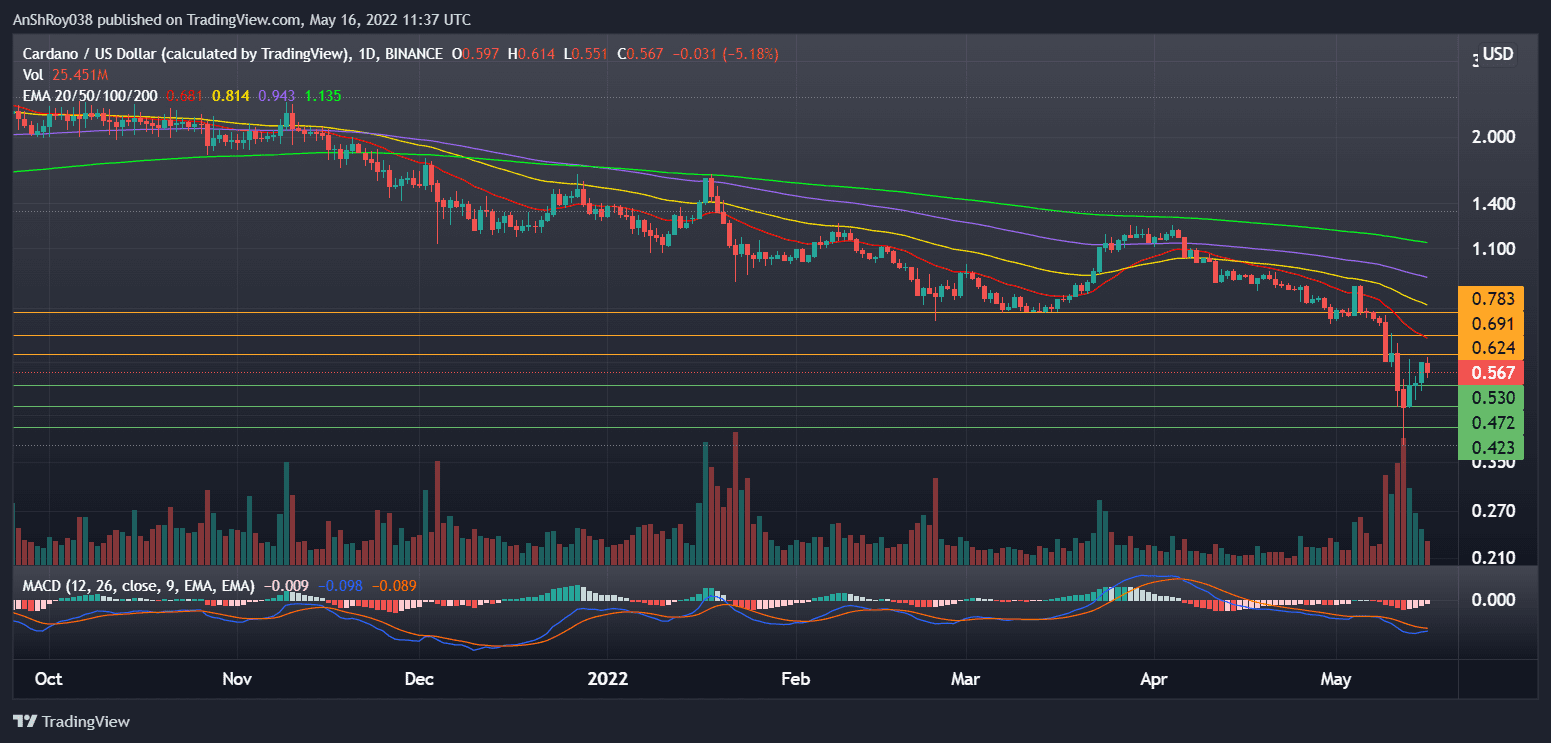
Traders usually consider a bullish MACD crossover a buy signal, which might help ADA prices jump to challenge immediate resistance near $0.62.
Also Read: Cardano’s (ADA) downtrend leads to a 28% fall in its prices.Once Cardano moves and consolidates above immediate resistance might target resistance from its 20-day exponential moving average (red wave, 20-day EMA) near $0.7. Finally, a sustained uptrend might see ADA reach resistance near its 50-day MA (yellow wave) at $0.78.
The $0.78 price level supported ADA price action between Feb 22 and Mar 16 earlier this year.
At the time of writing, ADA was trading at $0.562, down 6% on the day.

… [Trackback]
[…] Here you will find 24913 additional Info to that Topic: coinchapter.com/cardano-stumbles-after-weekend-run-sees-ada-jump-30/ […]
… [Trackback]
[…] Read More on that Topic: coinchapter.com/cardano-stumbles-after-weekend-run-sees-ada-jump-30/ […]
… [Trackback]
[…] Read More to that Topic: coinchapter.com/cardano-stumbles-after-weekend-run-sees-ada-jump-30/ […]