
Key Chainlink takeaways:
- Chainlink’s native token LINK plunged more than 8% on Friday.
- The downside move took cues from similar bearish volatility across the cryptocurrency market led by Bitcoin.
- Nonetheless, LINK expects to undergo a bullish rebound owing to a technical pattern outlook.
Yerevan (CoinChapter.com) — Chainlink (LINK) was among the biggest losers on Friday as altcoins tailed Bitcoin to its downside moves across the Asia-Pacific, European, and the US session.
Also read: Bitcoin tumbles as stocks, treasury yields rise amid sky-high CPI, PCE data
The LINK/USD exchange rate fell up to 12.66% to an intraday low of $16.695. Meanwhile, the token’s performance against Bitcoin looked less severe, with the LINK/BTC exchange rate declining by as much as 3.61% to 53,000 sats. Bitcoin fell by 9.1% to $31,501 on Friday.
On-chain data
Data fetched by Santiment, a crypto-based market sentiment analytics service, spotted a declining user interest in the Chainlink market. First, the oracle protocol’s network growth earlier this week fell to its lowest levels since October 2020. Second, LINK’s active addresses dropped from 13K in April to 5K.
That brought Chainlink market fundamentals to the classic chicken-and-egg problem. Did traders show less interest in the LINK pairs because Chainlink’s on-chain metrics were alarming or did a falling LINK price cause a plunge in the project’s network growth and active addresses? Keep wondering.
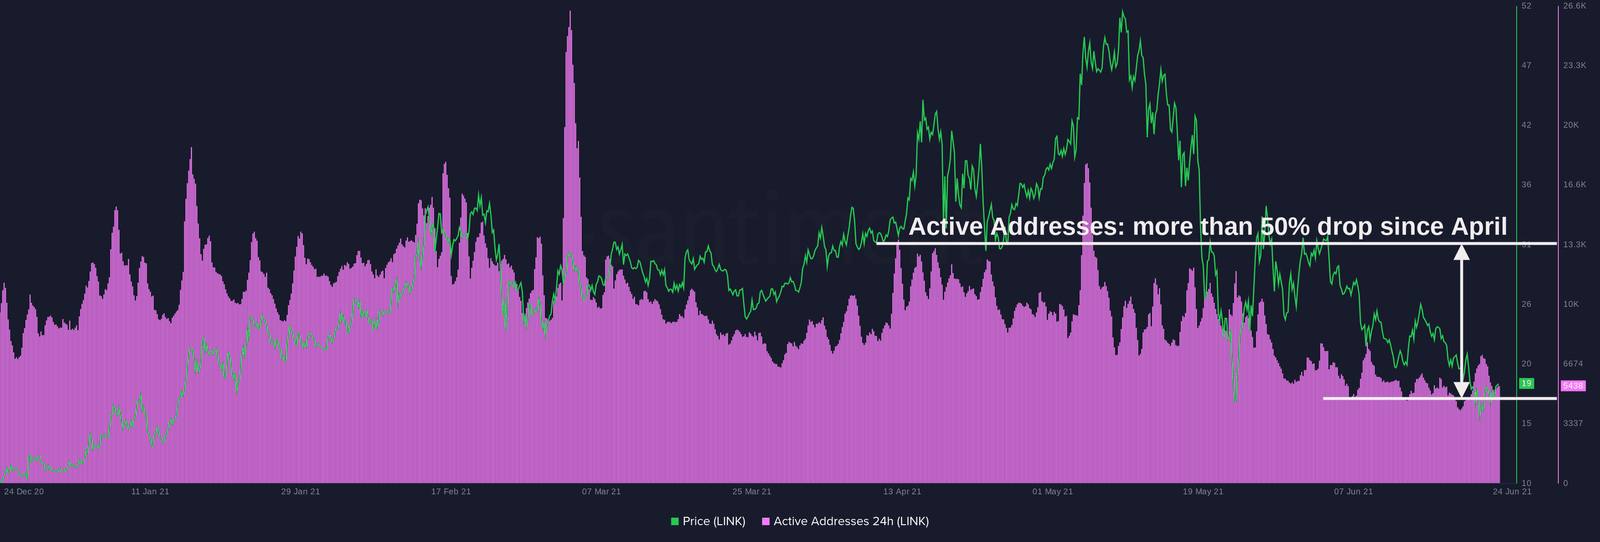
But Santiment left some bullish cues for LINK traders even as the token fell by more than 73% from its peak of $54.34. At first, sell-offs noted during the first half of this week indicated panic-selling by traders, which happens mostly around bottoms (the asset ones; what did you think?).
Also read: Chainlink’s bullish revival depends highly on Bitcoin recovery (and Chainlink 2.0 success)
Second, Chainlink’s network profit loss dropped hugely on Thursday, mean the average loss of LINK tokens moved this day is significantly higher than usual.
“A significant loss combined with Exchange Inflow spikes could indicate crowd fear; it’s good for [the] price,”
explained Santiment.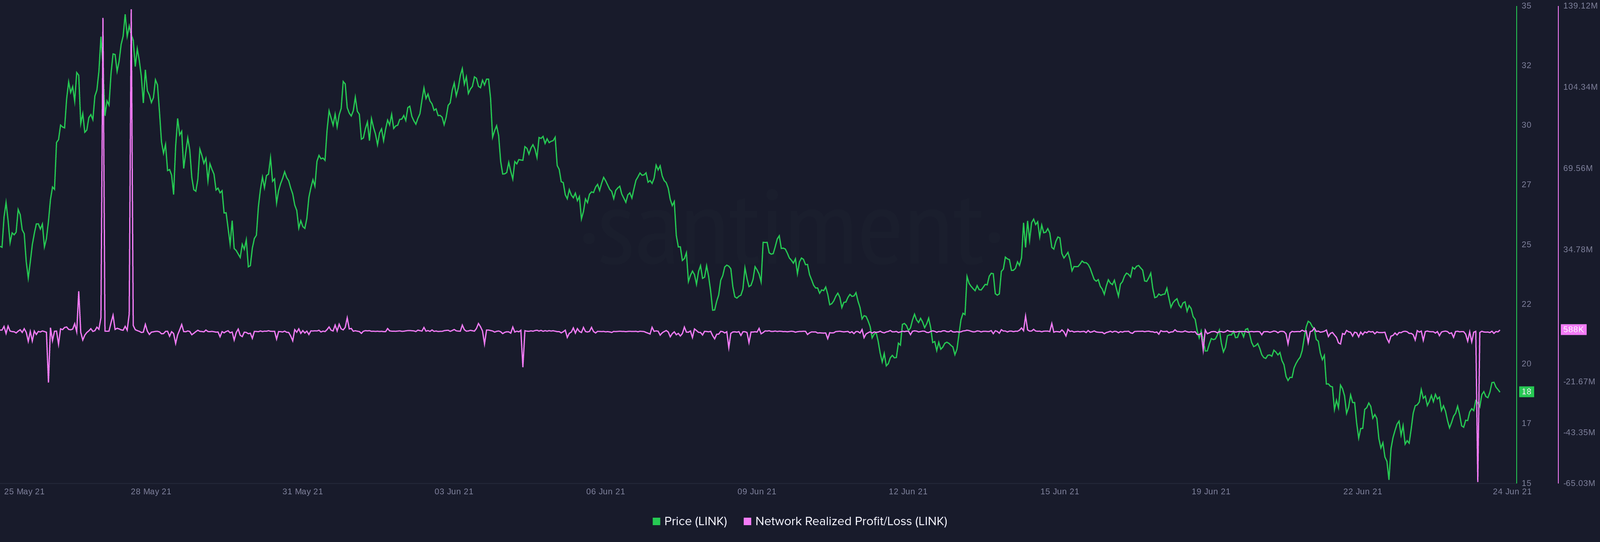
More bullish evidence for Chainlink came from its daily chart.
Chainlink 1D outlook
The LINK/USD exchange rate has been declining inside a descending channel pattern, fluctuating lower as it leaves behind a trail of lower highs and lower lows. So it appears the pair has formed a Falling Wedge pattern.
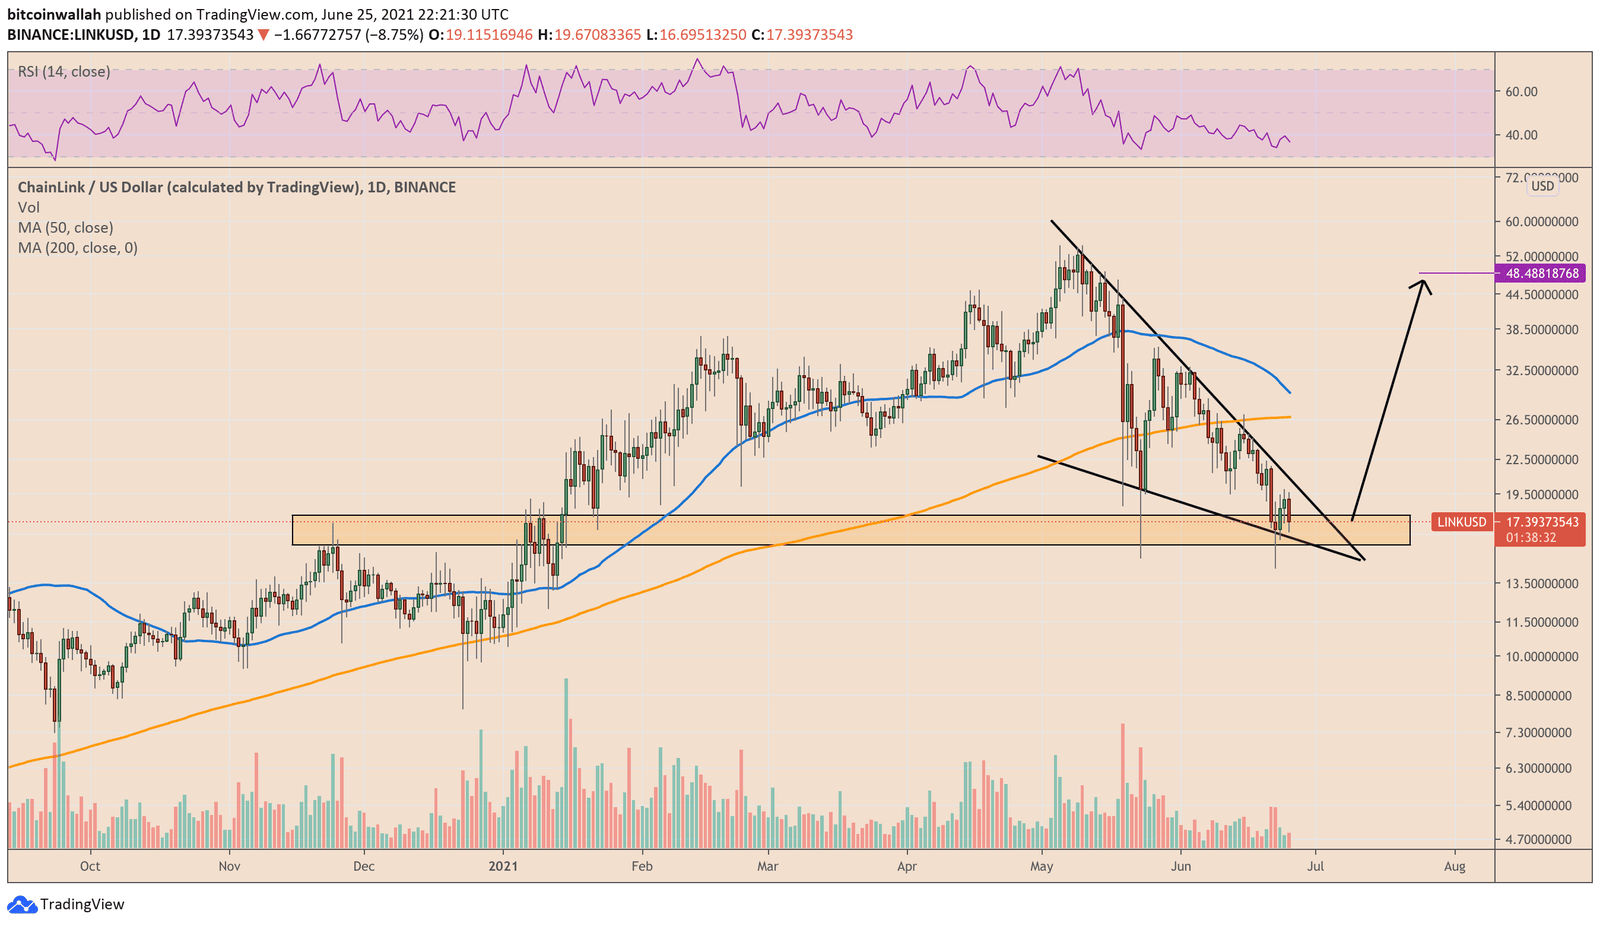
Simply put, Rising Wedges are bullish reversal patterns. It involves two contracting trendlines that trap an asset’s price action. Nonetheless, the price eventually breaks out as it approaches the trendline convergence point, or the apex. The profit targets for traders in case of an upside breakout originating from a Falling Wedge is located as far as the maximum pattern height.
Also read: Chainlink’s LINK One Break Away from Pumping 15% — Here’s Why
That puts LINK/USD en route to $48 if the setup plays out.
As a word of caution, a breakdown below the support bar shown in the chart above could invalidate the bullish wedge altogether.
