
Chainlink announced its latest integration on Thursday, confirming that Westpac Institutional Bank and Imperium Markets have adopted its services in Project Acacia, a Reserve Bank of Australia (RBA)-backed initiative.
Project Acacia is being developed in collaboration with Digital Finance CRC. The project aims to enable seamless and secure Delivery vs. Payment (DvP) settlement for tokenized assets. It connects blockchain infrastructure to Australia’s domestic PayTo payment system, using Chainlink’s Cross-Chain Interoperability Protocol (CCIP) and Chainlink’s Runtime Environment (CRE).
According to Chainlink’s post on X, the integration “accelerates the adoption of digital assets and brings institutional capital onchain.” The CRE architecture supports compliance and real-time automation for asset transfers across traditional and tokenized finance.
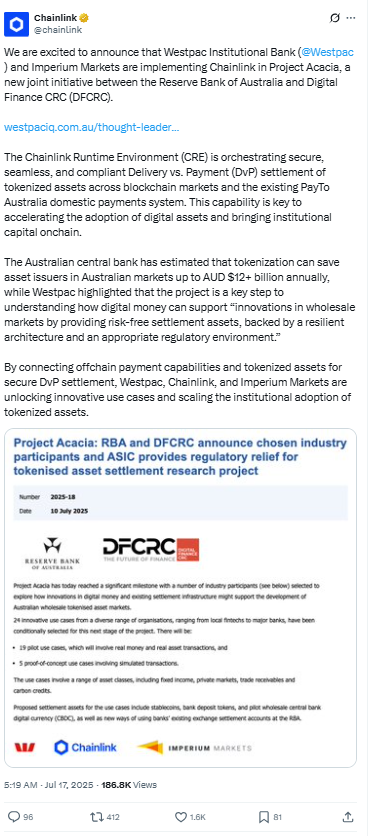
In a separate blog post, Westpac Institutional Bank highlighted the potential impact of tokenization. The bank cited RBA estimates showing annual cost savings between AUD 1 billion and AUD 4 billion. Westpac added that tokenized capital markets could reduce costs by up to AUD 13 billion per year for issuers.
By linking blockchain platforms to domestic payment systems, Project Acacia aims to streamline settlement and reduce friction in financial markets. The move adds another real-world use case to Chainlink’s expanding list of institutional applications.
Chainlink Forms Rising Wedge, Points to 19% Upside Toward $20.38
On July 17, 2025, a new 4-hour chart of Chainlink (LINK/USD) created on TradingView shows a clearly defined rising wedge pattern. The price is trading at $17.14 on Coinbase and has climbed steadily within two converging trendlines marked in red.

A rising wedge pattern is a technical structure where the price forms higher highs and higher lows, but the range tightens over time. Typically, this pattern suggests a potential reversal or breakout once the price exits the wedge. However, in some cases—especially during strong uptrends—it can signal a bullish continuation if the breakout occurs upward.
In this instance, the breakout arrow points to a projected target of $20.38, representing a 19% potential gain from the current price level. The 50-period Exponential Moving Average (EMA), shown at $15.58, continues to offer dynamic support.
The chart also shows a volume spike on July 17, suggesting strong buying interest as LINK approaches the upper wedge boundary.
If the breakout holds, Chainlink could reach the projected $20.38 target in the near term.
Chainlink RSI Nears Overbought, Signals Strong Momentum
On July 17, 2025, a fresh 4-hour Relative Strength Index (RSI) chart for Chainlink (LINK/USD) on TradingView shows the RSI line climbing to 68.90, just below the 70 overbought threshold. The RSI is paired with a smoothing average currently positioned at 63.12.

The Relative Strength Index (RSI) is a momentum oscillator that measures the speed and change of price movements. It ranges from 0 to 100. Readings above 70 typically suggest overbought conditions, while levels below 30 indicate oversold markets.
As of now, LINK’s RSI has approached the overbought zone, suggesting that bullish momentum is strong but possibly nearing exhaustion. However, in uptrending markets, the RSI can stay above 70 for extended periods without triggering an immediate pullback.
The yellow moving average line crossing below the RSI line reinforces ongoing buying strength. If RSI breaks above 70, it may confirm continued price acceleration, possibly aligning with the rising wedge breakout chart shown earlier.
This momentum data supports the short-term bullish case for LINK, which could help push the price closer to the $20.38 projected target.


