
Key Takeaways:
- Litecoin price closed at its lowest level in 2023 on Sept. 11.
- LTC price formed a bullish technical pattern.
- Traders remain bullish on the token’s prospects.
NEW DELHI (CoinChapter.com) — Litecoin price’s downtrend since June 2023 has resulted in the token reaching its lowest level in 2023.
The token, often dubbed ‘the silver to Bitcoin’s gold,’ has dropped over 50% from its 2023 high of $116 to reach a low of near $57 on Sept. 11. However, LTC price then launched a bull run, spiking over 16% since Sept. 11 to reach a daily high $67 on Sept 16.
Furthermore, LTC price is moving inside a bullish technical setup called the ‘Ascending Triangle.’
A horizontal trendline that connects swing highs and an ascending trendline connecting swing lows form an ascending triangle pattern. Volume helps determine if a breakout is strong.

Under ideal conditions, buyers would enter the market as the trendlines close the gap. As a result, the toke’s price would push above the horizontal resistance with heavy volumes.
Per the rules of technical analysis, the price target for a breakout is equal to the triangle’s height at its thickest point. If the triangle pattern pans out, LTC price could theoretically rally more than 3,585% and reach $2,386.
Traders Remain Bullish On LTC Price Prospects
Meanwhile, sentiment for the Litecoin token remained bullish, according to data from Coinglass.
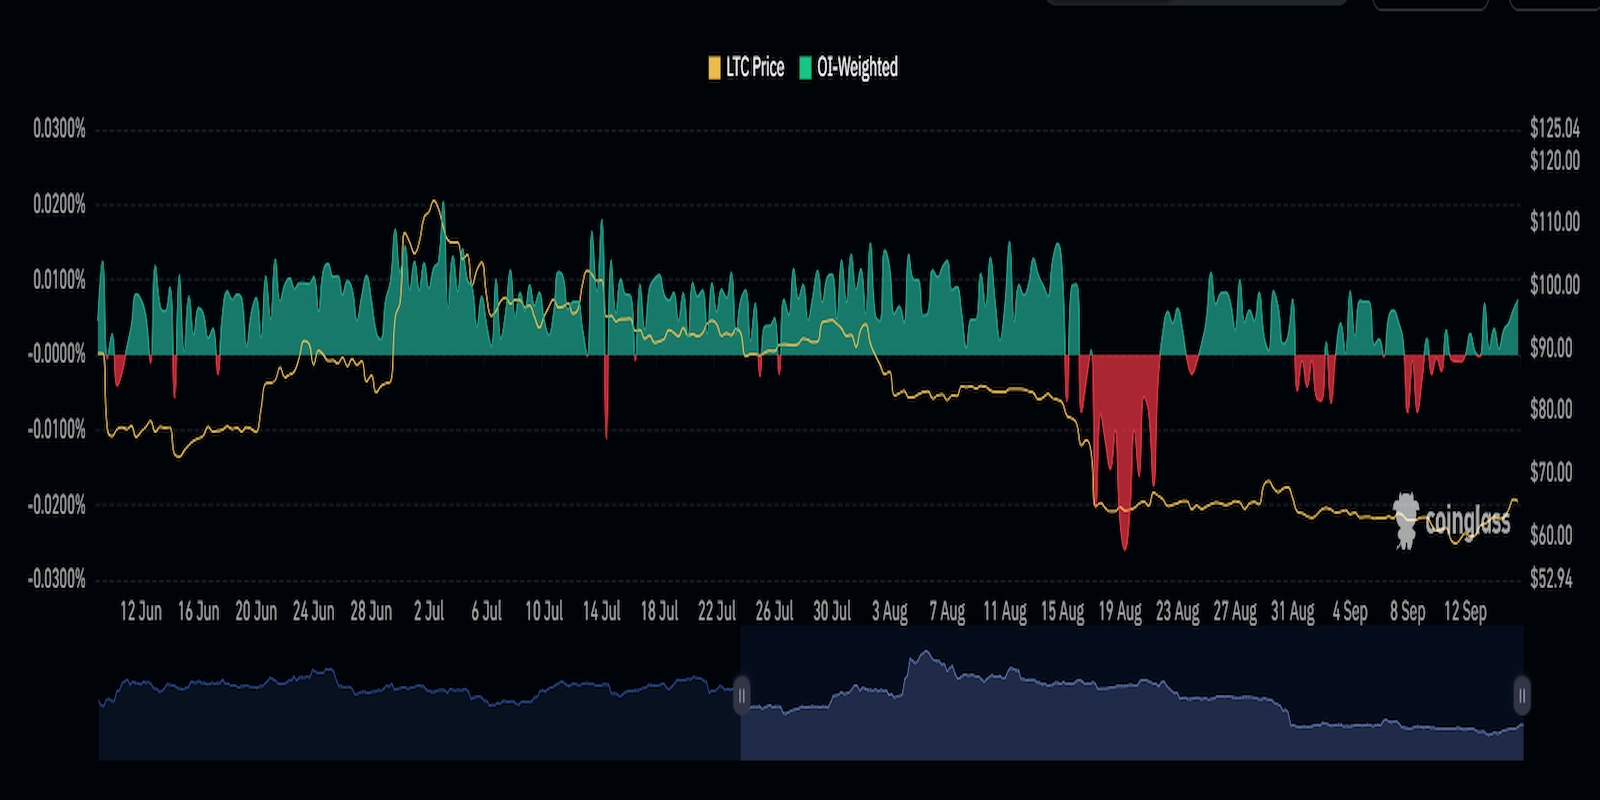
The Open Interest-weighted funding rate for LTC remained positive, rising 825% on Sept. 16 to reach 0.0074%. Funding rates refer to the periodic payments that futures contract holders receive, and it is equal to the difference between perpetual contracts and spot prices.
However, LTC contract liquidations remained more or less equally divided between long and short positions, with shorts taking a slight lead. Long liquidations suggest that traders might be adjusting their bullish forecast for the Litecoin token.
LTC Price Rally Stalls
LTC price rally stalled on Sept. 16 as the token dropped nearly 4% to reach a daily low near $64.43, suggesting bears might be booking profits near the 20-day EMA (red wave).
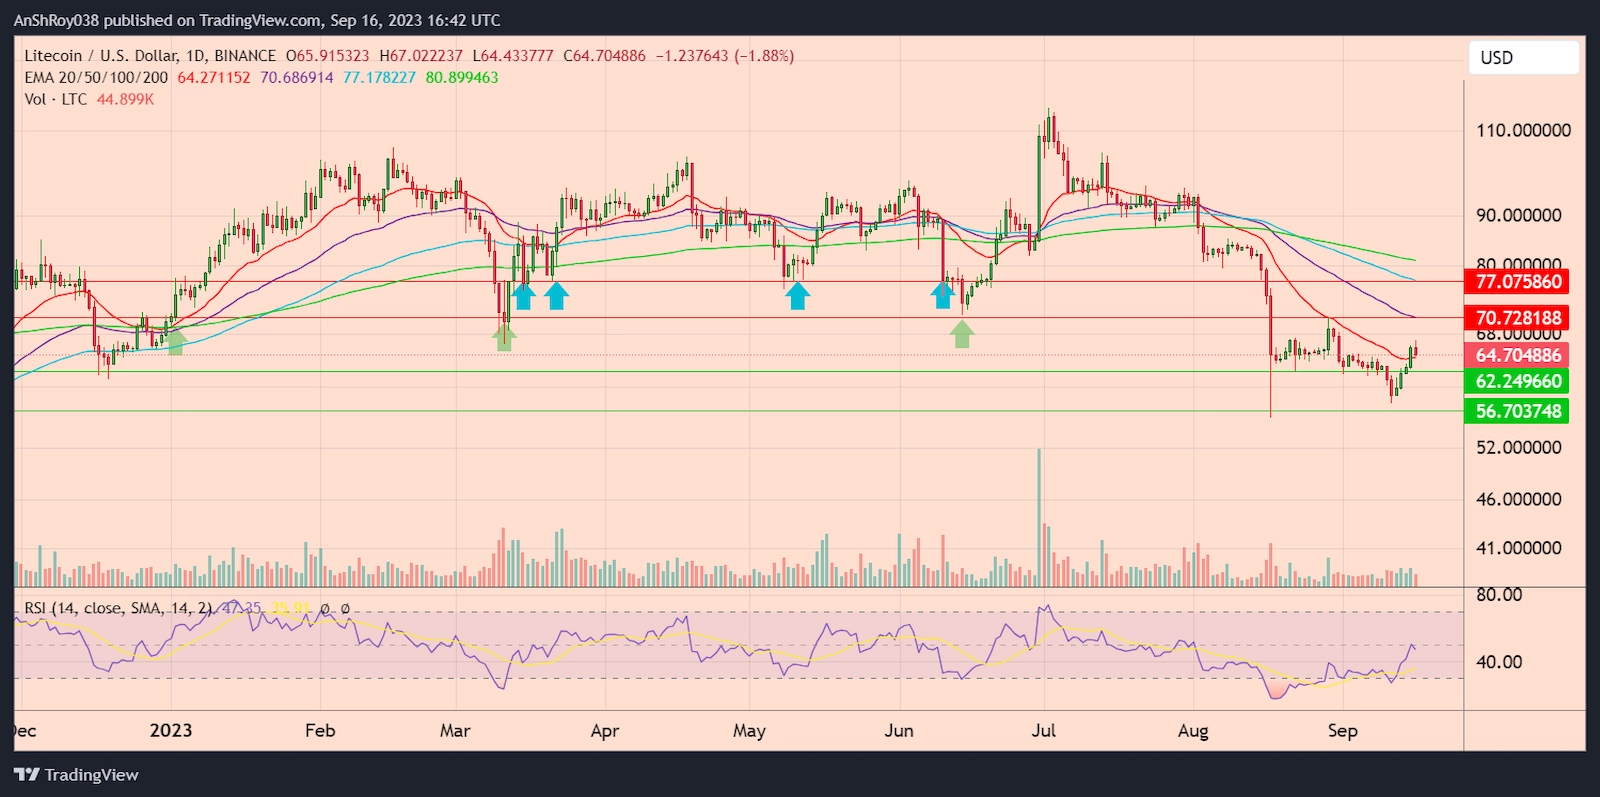
However, if the rally continues, LTC price will reach the 50-day EMA (purple wave) resistance near $70.73. The immediate resistance for the Litecoin token previously supported the token between Jan. and June 2023 (green arrows).
Breaking and consolidating above the immediate resistance might see LTC price target the 100-day EMA (blue wave) resistance near $77.1, which supported Litecoin price action between March and June 2023 (blue arrow).
Conversely, if the selling pressure increases, Litecoin price might drop to the support near $62.25. Moreover, failure of the immediate support level might force LTC price to test the support near $56.7 before recovering.
The RSI for LTC remained neutral, with a score of 47.35 on the daily charts.

… [Trackback]
[…] Find More here on that Topic: coinchapter.com/ltc-price-rallies-after-reaching-2023-lows-sentiment-for-litecoin-remains-bullish/ […]
… [Trackback]
[…] Info on that Topic: coinchapter.com/ltc-price-rallies-after-reaching-2023-lows-sentiment-for-litecoin-remains-bullish/ […]
… [Trackback]
[…] Read More Info here on that Topic: coinchapter.com/ltc-price-rallies-after-reaching-2023-lows-sentiment-for-litecoin-remains-bullish/ […]
… [Trackback]
[…] Find More Information here to that Topic: coinchapter.com/ltc-price-rallies-after-reaching-2023-lows-sentiment-for-litecoin-remains-bullish/ […]
… [Trackback]
[…] Info on that Topic: coinchapter.com/ltc-price-rallies-after-reaching-2023-lows-sentiment-for-litecoin-remains-bullish/ […]