
Key Takeaways
- The cryptocurrency market cap fell by $78 billion on July 8.
- Bitcoin prices fell as well, reaching $32,000 for the first time since July 2.
- Crypto market volatility has historically followed BTC price trends.
NEW DELHI (CoinChapter.com) — A rundown in Bitcoin prices Thursday, wherein the flagship cryptocurrency declined by up to 5.02%, pushed its rival digital assets likewise, insomuch that the net crypto market cap fell from $1.42tn to as low as $1.342tn.
The decline also was the second-highest this week, after Monday’s $91 billion market cap crash.
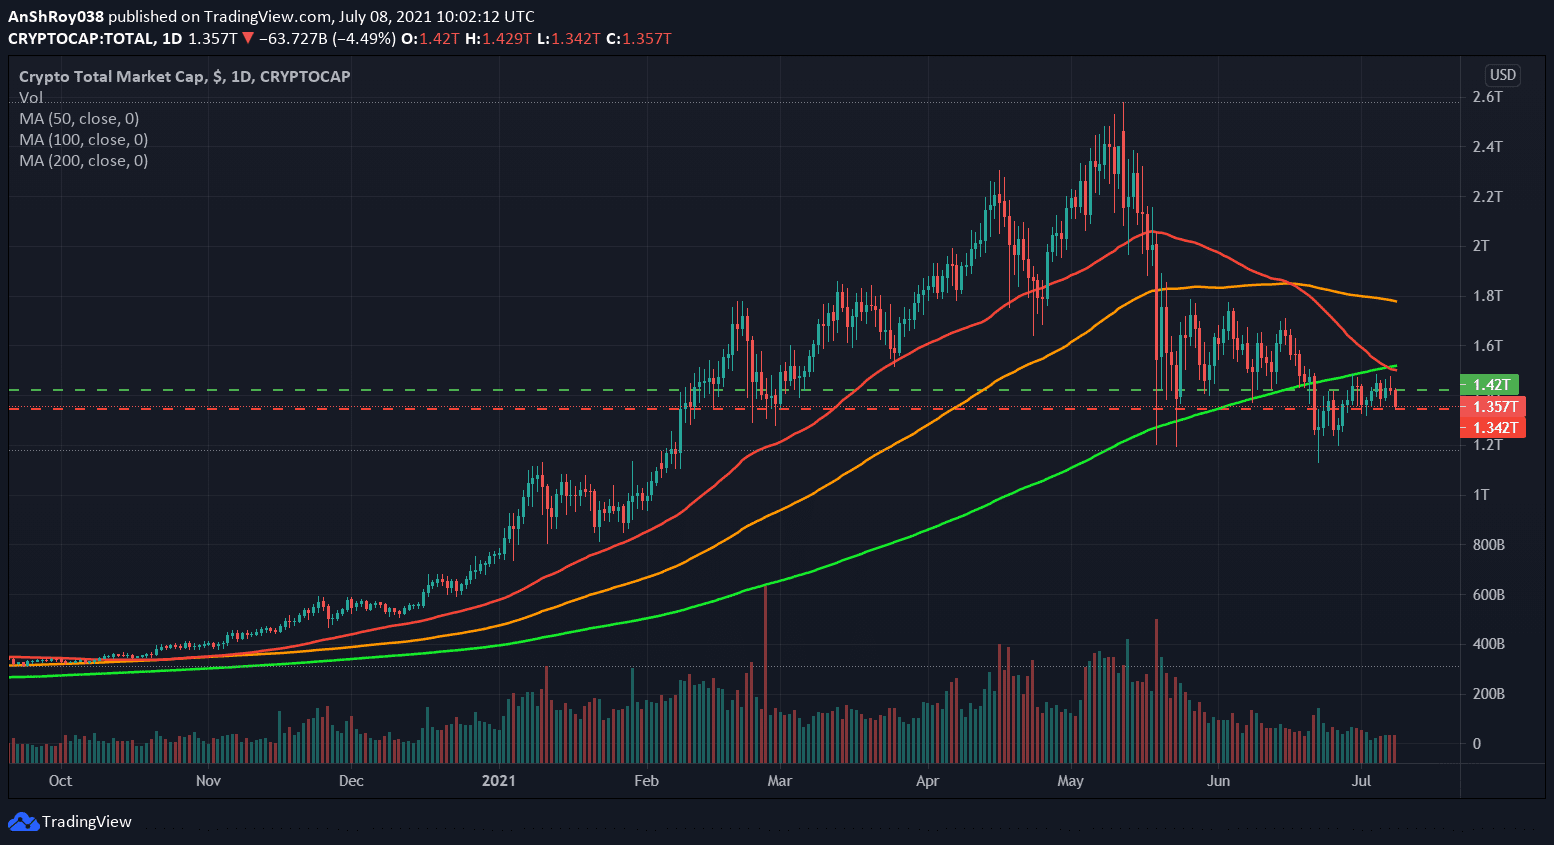
The crypto market cap has been trading below the 50-Day (Red) Moving Average line since May 17 and the 100-Day (Orange) Moving Average lines since the cataclysmic market crash of May 19, which saw investors lose $830 billion. When prices move below these two trend lines, an asset is considered bearish in the short and mid-term.
Related: Theta rallies 14% on patent application approval and Bloomberg feature.
Additionally, the two trend lines made a death cross on June 16, which dented crypto markets upwards rally. Since then, the market has struggled to move above the $1.48 trillion price level, which is the current resistance for the market. A death cross occurs when a short-term moving average crosses below its long-term moving average.
The 200-Day (Green) Moving Average line helps analyze long-term trends. For example, the crypto market cap moved below the trend line on June 21 and has remained there since then. Thus, it seems the crypto market is bearish in the long-term too.
Another development is the death cross that formed on July 6 between 50-Day and 200-Day MA. A second occurrence of the chart pattern in less than three weeks might dent investor confidence, inspiring sell-offs and a further fall in prices.
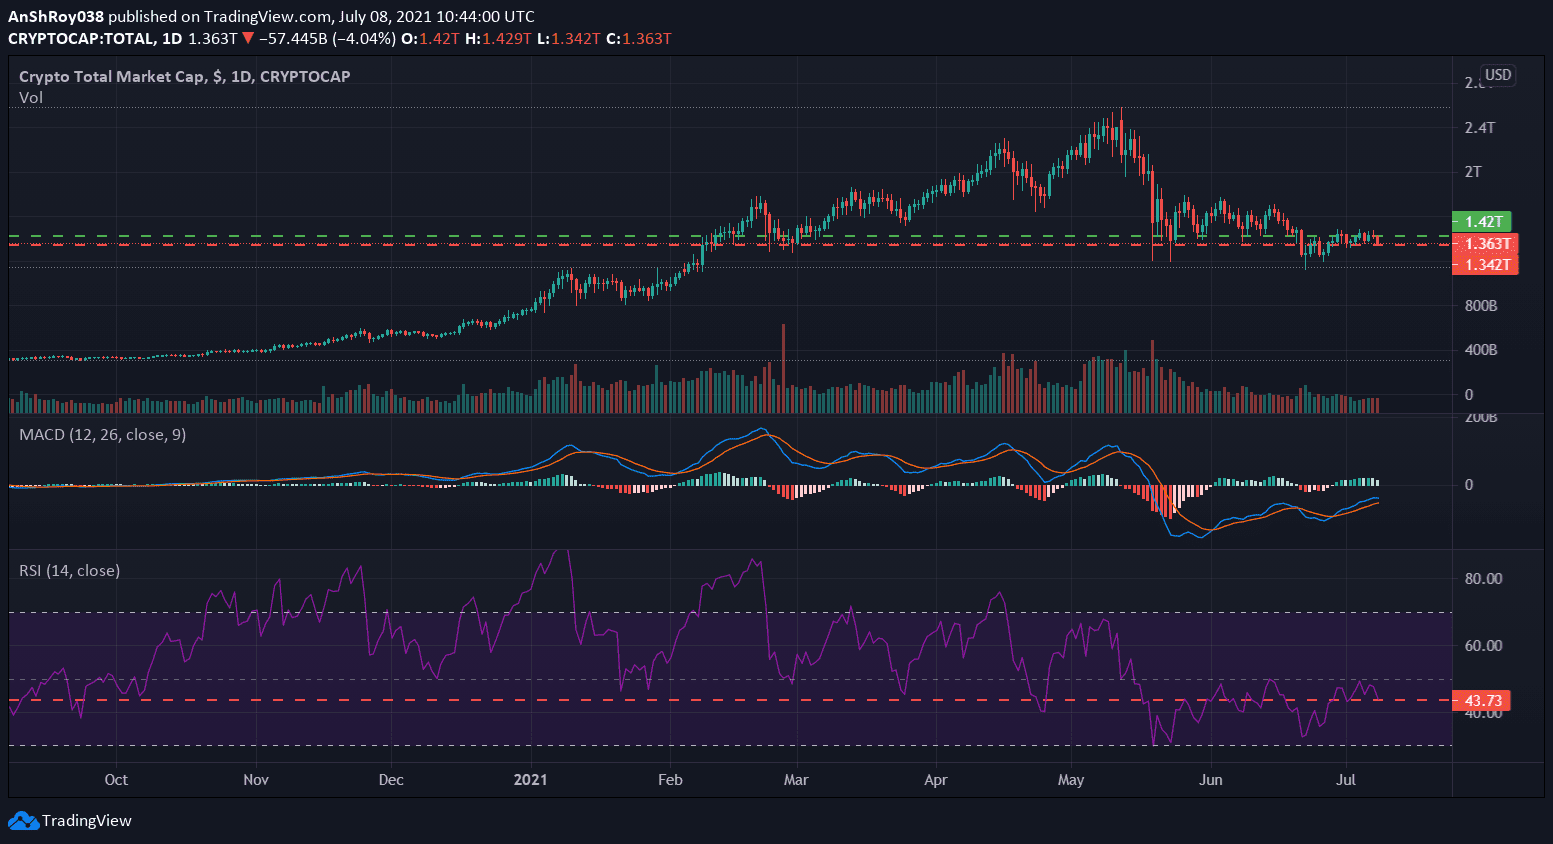
On the flip side, though, the MACD displays a bullish outlook for the market.
The MACD is a trend-following momentum indicator that shows the relationship between two moving averages of an asset. For the crypto market, the MACD line, which is a difference between 12-Day and 26-day Exponential Moving Average (on the daily chart), lies firmly above the MACD signal line (9-Day EMA of MACD). In addition, the MACD histogram, which plots the difference between the MACD line and MACD signal line, is above zero, further supporting a bullish outlook.
RSI, or Relative Strenght Index, for the crypto market, is at a neutral 43.73.
BTC Price Trends
Due to decreasing amounts of trading volume, a Bitcoin price move was likely. However, the breakout was bearish, which saw BTC lose more than $3,000 from Wednesday’s high of $35,106.

BTC prices have been trading below 50-Day (Red), 100-Day (Orange), and 200-Day (Green) Moving Average trend lines for quite some time now. As such, it is safe to say that the token has a bearish outlook in the short, mid, and long term. Today’s price level set a new low for July 2021. Moreover, prices have not gone below the $32,000 mark since Jun 27.
Also Read: Financial Times wrongly equates crypto with Albania’s Ponzi scheme debacle.
$32,250 seems to be critical support for BTC, with different support levels at $31,500 and $31,000.
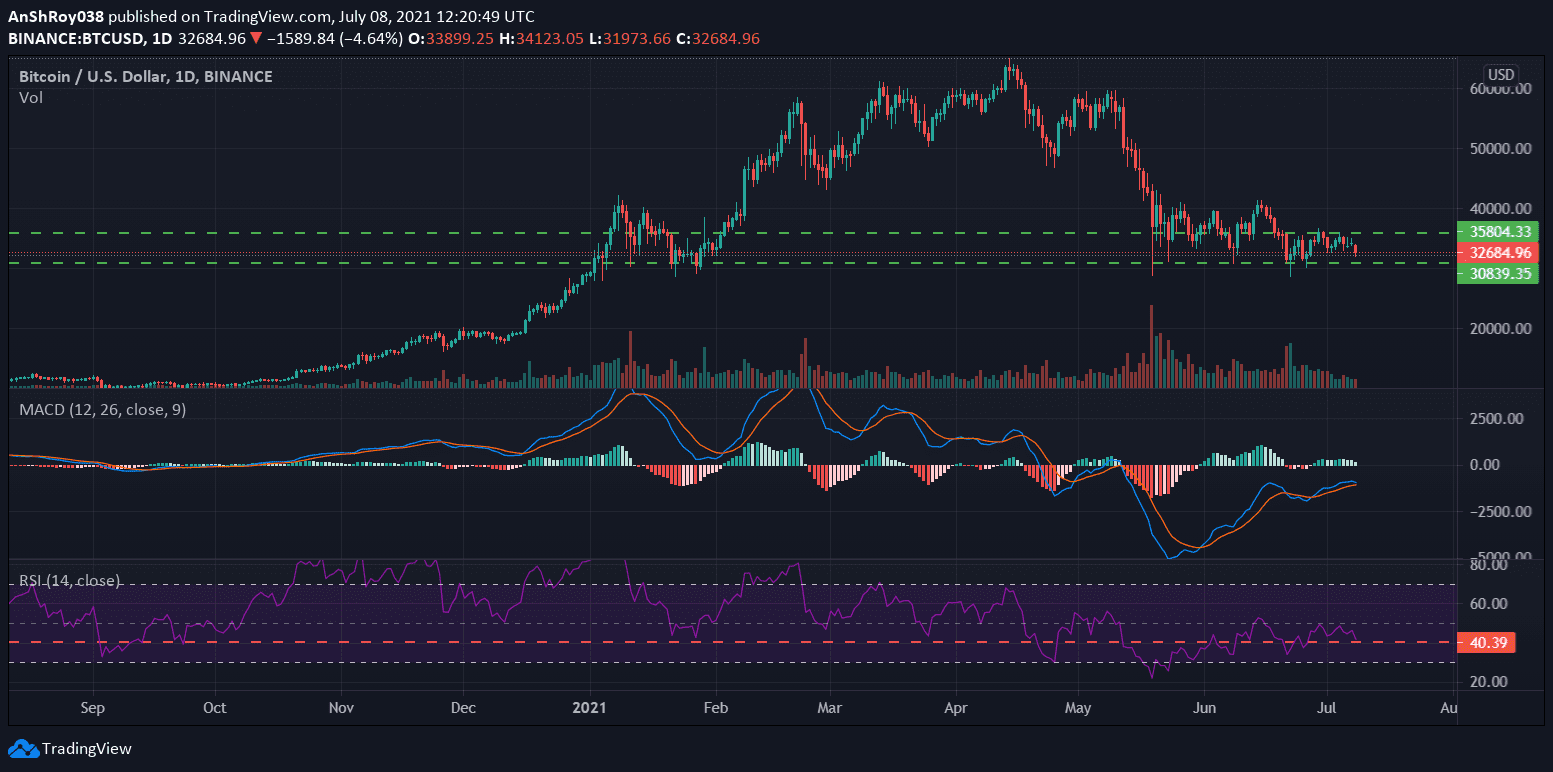
The MACD trend oscillator is not optimistic either. Although the MACD line for BTC is still above the MACD signal line, it is moving downwards, indicating bearish clouds on the horizon. Also, the MACD histogram is moving downwards too.
Additionally, RSI for BTC is 40.39 now. However, like the MACD, it moves downwards, forecasting an increasing downwards momentum for the token in the short term.
Before the breakdown, BTC prices were consolidating inside a short-term triangle pattern. As such, it can be facing more bearish action in the coming days. At the time of writing, BTC was trading at $32,989 per token.
Bitcoin price trends often impact the overall market cap of the crypto world. For example, if the crypto market and BTC charts are compared, there are several instances of an increase in overall market cap when Bitcoin recorded a new high and vice-versa.

… [Trackback]
[…] Read More Information here to that Topic: coinchapter.com/crypto-market-loses-78bn-intraday-as-bitcoin-drops-towards-32k/ […]
… [Trackback]
[…] There you can find 6517 more Information on that Topic: coinchapter.com/crypto-market-loses-78bn-intraday-as-bitcoin-drops-towards-32k/ […]
… [Trackback]
[…] Info to that Topic: coinchapter.com/crypto-market-loses-78bn-intraday-as-bitcoin-drops-towards-32k/ […]
… [Trackback]
[…] There you can find 43759 more Information on that Topic: coinchapter.com/crypto-market-loses-78bn-intraday-as-bitcoin-drops-towards-32k/ […]
… [Trackback]
[…] Read More on that Topic: coinchapter.com/crypto-market-loses-78bn-intraday-as-bitcoin-drops-towards-32k/ […]