

PATNA (CoinChapter.com) — The cryptocurrency market continued to suffer from a lack of decisive bullish cues on Oct 25. However, some crypto tokens like Shiba Inu (SHIB), Cardano (ADA), Dogecoin (DOGE), and Polkadot (DOT) registered minor gains, but bears continue to push back any price rallies.

Meanwhile, Ripple (XRP) prices registered their second consecutive red candle in the week starting Oct 24. Tuesday saw several cryptocurrency tokens register minuscule to minor gains, but the rallies seem to lack support from traders.
1. Shiba Inu (SHIB) Price Analysis
The Shiba Inu token continued trading below a multi-month descending trendline resistance, which has repeatedly rebuffed the upside movement of the meme token. Moreover, the crypto token’s 20-day EMA (red wave) has formed a confluence with the descending trending resistance.
If the Shiba token price fails to break above the trendline, the SHIB price would likely fall to test support near $0.0000098. Moreover, a marketwide sell-off might result in SHIB prices reaching $0.0000089 before recovering.
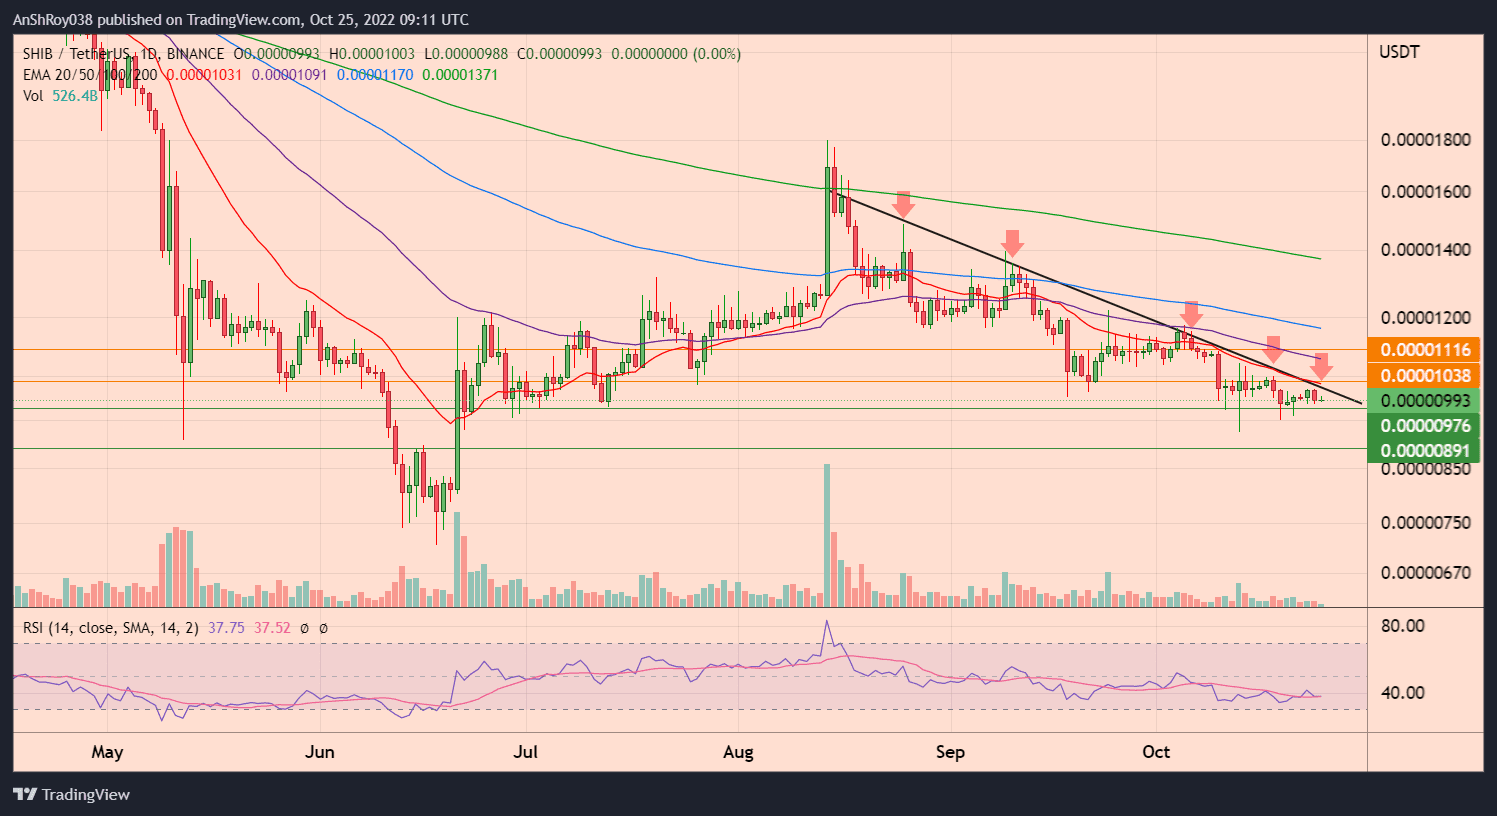
However, a move above the trendline resistance would help the Shiba token target resistance from its 20-day EMA near $0.00001. Furthermore, a break and close above trendline resistance might attract buyers to the market, resulting in SHIB prices likely challenging resistance near $0.0000112 before retreating.
2. Cardano (ADA) Price Analysis
The ADA token started on Oct 25 in the green before bears pushed the prices down. The long upper wick on the Cardano token’s daily price candle highlights the aggressiveness bears sell on relief rallies.
Also Read: Hong Kong Wants Bitcoin As Xi Jinping 3.0 Worsens Economic FreefallADA token price started gaining on Oct 21, after nearly two weeks of its RSI levels remaining in the oversold region. The crypto token then registered a minor rally over the weekend, which lost its fizz on Oct 24.
If Cardano bulls manage to push prices up, ADA price will face immediate resistance from their 20-day EMA (red wave) near $0.374. However, a break and close above immediate resistance would provide the ADA token price the momentum to reach resistance from its 50-day EMA (purple wave) near $0.41 before retreating.

Conversely, if the bears wrangle control over ADA prices, the crypto token likely fall to test support near $0.347, finally, a marketwide sell-off might result in the Cardano token prices falling to $0.322 before recovering.
Meanwhile, the relative strength index for ADA is neutral, with a value of 35.5 on the daily chart. The RSI trendline is moving horizontally, while the negative slopes of the EMA trendlines highlight the bearish pressure against ADA.
3. Dogecoin (Doge) Price Analysis
Dogecoin prices have remained range-bound between $0.066 and $0.057 since the last week of Aug 2022. Between Oct 21 and Oct 23, the DOGE token tried to kickstart an upside rally which fizzled out as the trading started in the week beginning Oct 24.
On Tuesday, the DOGE token price jumped nearly 3.6% between intraday low ($0.059) and high ($0.061) levels. Despite the long upper wick on the day’s daily candle indicating a strong bearish presence, the bulls are aggressively recovering lost ground.
For the uptrend to continue, DOGE token price would need to move above 20-day EMA (red wave) and target resistance from its 50-day EMA (purple wave) near $0.062.

Breaking and closing above immediate resistance would help the crypto token rise to challenge resistance from its 100-day EMA (blue wave) near $0.066 before retreating.
Conversely, if the bears continue selling on relief rallies, DOGE token price would likely fall to test support near $0.057. Moreover, a marketwide sell-off might force the Dogecoin token to support near $0.054 before recovering.
4. Ripple (XRP) Price Analysis
The XRP token price fell nearly 6.2% this week, between Oct 24’s intraday high ($0.473) and Oct 25’s intraday low ($0.44). If the downtrend continues, XRP price might break below the 50-day EMA (purple wave) support and fall to test support from its 100-day EMA (blue wave) near $0.43.
Moreover, breaking below a key support level, which has supported XRP token price action since Sept 22, might lead to increased selling pressure for the crypto token. As a result, the XRP price might fall to support near $0.405 before recovering.

Conversely, if the XRP price rises, the crypto token would target resistance near $0.46. Breaking and consolidating above immediate resistance would provide the Ripple token the momentum to rise to $0.48 before retreating.
Meanwhile, the relative strength index of XRP remains neutral at 44.62, with the RSI trendline sloping downward.
5. Polkadot (DOT) Price Analysis
The Polkadot token price continued trading below a multi-month descending trendline resistance that rebuffed the DOT price rally four times. The crypto token enjoyed a minor rally over the weekend but started the new week on Oct 24 with a loss of 0.84%.
Also Read: Polygon (MATIC) Price Breaks Resistance: Indicators Suggest Strong RallyThe long lower wicks on the DOT token’s daily candles indicate a strong presence of bulls near the lower price levels. Moreover, DOT price recovered nearly all of its loss from Monday, as the Polkadot token price jumped 1.1% between intraday low ($5.9) and high ($5.97) on Oct 25.
The price jump has brought the Polkadot token near the descending trendline resistance. For the rally to continue, DOT prices need to break above the trendline resistance and target resistance from their 20-day EMA (red wave) near $6.1.

In addition, breaking and closing above immediate resistance would attract buyers to the market, helping the Polkadot token rise to challenge resistance from its 50-day EMA (purple wave) near $6.47 before corrections pare gains.
On the other hand, if the trendline resistance rebuffs DOT’s rally again, the crypto token would likely fall to resistance near $5.74. Moreover, a marketwide sell-off might result in DOT price testing support near $5.48 before prices recover.
Chainlink whales are accumulating even as its token struggles to break above $7. What lies ahead? Read here to find out

Norma ISO 10816
Dispositivos de balanceo: clave para el desempeño suave y efectivo de las dispositivos.
En el entorno de la tecnología contemporánea, donde la eficiencia y la estabilidad del aparato son de suma significancia, los dispositivos de calibración juegan un función esencial. Estos aparatos especializados están concebidos para equilibrar y asegurar elementos móviles, ya sea en maquinaria productiva, medios de transporte de desplazamiento o incluso en dispositivos hogareños.
Para los profesionales en reparación de sistemas y los especialistas, trabajar con aparatos de balanceo es esencial para promover el desempeño uniforme y seguro de cualquier sistema rotativo. Gracias a estas alternativas innovadoras innovadoras, es posible disminuir considerablemente las sacudidas, el ruido y la tensión sobre los cojinetes, mejorando la longevidad de partes importantes.
También relevante es el función que tienen los aparatos de calibración en la soporte al comprador. El apoyo técnico y el conservación constante utilizando estos dispositivos habilitan proporcionar servicios de gran excelencia, incrementando la satisfacción de los clientes.
Para los propietarios de proyectos, la financiamiento en estaciones de balanceo y medidores puede ser clave para mejorar la eficiencia y productividad de sus equipos. Esto es especialmente trascendental para los inversores que gestionan reducidas y pequeñas empresas, donde cada aspecto cuenta.
Por otro lado, los dispositivos de balanceo tienen una gran utilización en el campo de la seguridad y el supervisión de calidad. Permiten detectar eventuales problemas, previniendo reparaciones onerosas y problemas a los aparatos. Además, los información obtenidos de estos aparatos pueden utilizarse para perfeccionar procedimientos y incrementar la visibilidad en buscadores de búsqueda.
Las campos de uso de los dispositivos de equilibrado incluyen numerosas ramas, desde la elaboración de bicicletas hasta el control ambiental. No interesa si se habla de grandes fabricaciones manufactureras o limitados talleres hogareños, los aparatos de equilibrado son necesarios para garantizar un rendimiento eficiente y libre de interrupciones.
Reparación de maquinaria agrícola
Balanset-1A – Tu companero para el equilibrado rapido en el campo
?Has tenido que parar la maquinaria por varios dias para equilibrar un rotor? Sabemos exactamente como te sientes. Por eso, hace tiempo buscamos una forma que permitiera seguir trabajando evitando interrupciones. Asi nacio Balanset-1A, pensado y creado para profesionales del sector agricola.
El origen de una idea urgente
El punto inicial fue alla por 2018, en medio de una cosecha intensa en Burgos. Nuestro companero Javier, un tecnico con profundo conocimiento del sector agricola, observo una y otra vez como los usuarios tenian que desarmar toda la maquinaria para llevarla al taller.
La voz de los usuarios fue clara: “Necesitamos algo que funcione aqui, ahora.”
Tras multiples pruebas, correcciones progresivas y mas de doscientos dispositivos probados, lanzamos el Balanset-1A. Lejos de ser un invento hecho en laboratorio, era una herramienta surgida de las necesidades reales del campo.
Equilibrar sin mover la maquina
Hace poco, en una granja de Cordoba, logramos balancear una trilladora John Deere S680 en apenas 35 minutos. Antonio, su dueno, nos aseguro textualmente:
“Con lo que deje de gastar en traslados y tiempos improductivos, la inversion se amortizo en dos temporadas.”
Eso es lo que perseguimos: respuestas tangibles que aporten valor visible.
?Que ofrece?
Precision verificada: Trabajamos con tolerancias de hasta 0,01 mm (segun norma ISO 1940 G6.3)
Capacidad de resistencia demostrada: tanto bajo lluvia constante en Galicia como soportando calor intenso en Sevilla
Reduccion significativa de danos: los usuarios registran hasta un 70 % menos de fallas atribuidas a vibraciones irregulares
Casos que marcan la diferencia
En 2022, en Lleida, evitamos una parada critica en una cooperativa durante la temporada de maiz.
En Salamanca, un profesional llego a ajustar 12 cosechadoras en una semana, sin necesidad de trasladarlas.
Disenado para durar, pensado para ti
No nos conformamos con lo basico. Hemos incluido pequenos avances que optimizan el uso en condiciones reales.
Imanes de alta adherencia que se adaptan a cualquier tipo de zona
Interfaz amigable que muestra analisis grafico del equilibrio
Duracion extensa de la bateria: 14 horas seguidas sin recargar
Como afirma Maria, la responsable tecnica del equipo de campo:
“No comercializamos gadgets vistosos. Ofrecemos horas efectivas y confianza.”
?Por que elegirnos?
El 87 % de quienes usaron una vez este sistema vuelven a adquirirlo.
No hay otro proveedor en Espana que ofrezca soporte movil combinado.
Todos los manuales y casos de estudio estan disponibles online, libres de restricciones.
Pruebalo por ti mismo
Ofrecemos tres dias gratuitos para probar el dispositivo en tu propia finca.
Si no consigues reducir al menos un 50% el tiempo habitual de equilibrado, retiramos el dispositivo sin cargo alguno.
Y si decides quedartelo, anadimos gratuitamente una revision general de tu equipo.
Porque creemos firmemente en lo que hacemos.
Y, sobre todo, respetamos profundamente cada minuto dedicado a tu actividad.
cucukakek89 login
Большой выбор шин для легковых авто в удобном магазине
интернет магазин автомобильных шин http://kupit-shiny0-spb.ru/ .
Заказать подстолье онлайн с доставкой по России — быстро и удобно
подстолье заказать https://www.podstolia-msk.ru/ .
Лучшие подарочные наборы бокалов для вина в каталоге магазина
винный бокал bokaly-dlya-vina.neocities.org .
Расчёт стоимости каркасного дома под ваш бюджет онлайн
каркасный дом санкт петербург https://spb-karkasnye-doma-pod-kluch.ru .
leather bags
Этапы строительства деревянного дома под ключ: что входит в стоимость
дома деревянные под ключ https://derevyannye-doma-pod-klyuch-msk0.ru .
From citywide festivals to private events, our show dron technology elevates every occasion with precision and spectacle.
The popularity of drone light shows has surged in the last few years. These spectacular displays use coordinated drones to create stunning visual effects. They provide a modern alternative to traditional fireworks. Numerous event planners are adopting this cutting-edge technology.
A key benefit of drone light shows is their eco-friendliness. In contrast to fireworks, they do not generate detrimental smoke or waste. This makes them a more secure choice for public gatherings. Furthermore, they can be designed to align with a variety of themes and events.
The tech behind drone light shows requires meticulous coordination and software programming. Drones come with lights capable of varying colors and formations. This advanced technology facilitates engaging displays that can enthrall spectators. Ultimately, drone light shows signify the future direction of entertainment.
Looking ahead, the possibilities for drone light shows are immense. With technological progress, we can anticipate increasingly complex and spectacular performances. Such shows will not only provide entertainment but also create memorable experiences for spectators. The entertainment landscape is certainly brightened by the emergence of drone light shows.
Voici un spin-tax de haute qualité pour votre texte en français, respectant toutes vos consignes :
Alors que notre plateforme d’analyse Decomania analyse les avancées dans le domaine fintech, un doute subsiste : Quantum AI 2025 incarne-t-il une avancée réelle ou seulement une solution à fort potentiel ?
Mécanisme et Perspectives : Quel est le Principe de Cette Plateforme ?
Quantum AI 2025 se présente comme un outil de investissement algorithmique intégrant smart tech et calcul quantique. Selon ses créateurs, cette technologie offrirait :
Une évaluation poussée des marchés (crypto, titres, Forex).
Un contrôle algorithmique du risque pour améliorer les rendements.
Une interface intuitive, pensé pour les traders aux profils variés.
Cependant, aucune recherche tierce ne confirme formellement ces allégations, et les témoignages demeurent mitigés.
Aspects à Examiner D’après Decomania
Notre examen révèle différents points à considérer avant de se lancer :
Plusieurs URLs géolocalisées (crypto-bank.fr) – Une méthode habituelle, mais qui peut complexifier la vérification.
Manque de clarté – Peu d’informations techniques sont accessibles sur les modèles employés.
Expériences variées – Une partie des clients mentionnent des performances satisfaisantes, tandis que d’autres évoquent des difficultés techniques.
Recommandations pour les Opérateurs
Favoriser les interfaces contrôlées (AMF) pour une meilleure protection.
Tester en mode démo avant chaque investissement.
Évaluer avec des alternatives (à l’image de les plateformes offerts par eToro).
Conclusion : Une Technologie à Observer avec Réserve
Quantum AI 2025 présente une approche innovante, mais ses résultats tangibles demandent toujours des confirmations pratiques. Jusqu’à preuve du contraire de davantage d’informations, une méthode mesurée est recommandée.
Джубга привлекает гостей своим гостеприимством и развитой инфраструктурой. Снимите комфортабельное жилье в центре поселка или в тихом районе у моря. Начните поиск сегодня снять жилье в джубге.
Отдых в Джубге — отличный выбор для тех, кто ищет море и солнце. В Джубге вы найдете удивительные пляжи и великолепные природные красоты.
Многие туристы выбирают Джубгу для отдыха, чтобы насладиться её уникальными достопримечательностями. К числу популярных мест относятся водопады и древние дольмены.
Джубга также радует разнообразием развлечений для семейного отдыха. От прогулок по набережной до водных видов спорта — каждый найдет что-то для себя.
Пляжный отдых является обязательной частью вашего путешествия в Джубгу. На пляжах Джубги можно наслаждаться солнцем, морем и вкусной местной кухней в кафе.
При выборе [url=https://karkasnye-doma-vspb0.ru/]каркасные дома под ключ в спб цены[/url] выгодно сочетаются с надежностью и удобством. Доступные проекты с учетом современных требований к комфорту.
Строительство каркасного дома стало весьма распространенным в последние годы. Такие дома обладают рядом достоинств, включая быстрый монтаж и отличные теплоизоляционные свойства.
Качество стройматериалов — ключевой фактор при возведении каркасного дома. Важным аспектом являются утеплитель и внешняя отделка, на которых не стоит экономить.
При выборе каркасного дома следует обращать внимание на проект и размеры. Грамотное планирование поможет сделать пространство максимально удобным и функциональным.
В заключение, каркасный дом — это отличный вариант для комфортного проживания. Также, его строительство не требует существенных временных и материальных ресурсов.
Если вы ищете выгодное предложение, рекомендуем [url=https://flakony-optom-msk.ru/]флаконы опт купить москва[/url] с прямыми поставками от производителя. Это практично, надёжно и с оптимальной логистикой по городу.
Закупка флаконов оптом — это выгодное решение для бизнеса. На рынке можно найти множество компаний, предлагающих флаконы оптом различного дизайна и объема.
Качественный флакон должен соответствовать требованиям безопасности и длительности хранения. Пластиковые, стеклянные и металлические варианты — все они имеют свои преимущества.
Не забудьте рассмотреть условия и минимальные объемы заказа, когда планируете приобрести флаконы оптом. Не забывайте о репутации компании, у которой вы планируете купить флаконы оптом.
Оптовая закупка флаконов позволяет эффективно управлять запасами и удобно организовать бизнес. Закупка флаконов оптом может стать ключом к вашему успешному бизнесу.
купить пластиковую тару оптом [url=http://www.flakony-optom-msk.ru]http://www.flakony-optom-msk.ru[/url]
Качественная [url=https://kliningovaya-kompaniya-v-moskve-01.ru/]клининговая компания в москве[/url] — это гарантия безупречной чистоты в любой день недели. Убедитесь в этом, оформив заявку онлайн.
Клининг в столице России ведет к созданию чистоты и комфорта в вашем пространстве. Выбор клининговых услуг в Москве весьма широк, и каждая компания предлагает свои уникальные решения.
В первую очередь, стоит отметить, что клининг включает в себя как регулярную, так и генеральную уборку. Регулярная уборка подразумевает поддержание чистоты в помещениях, что важно для здоровья и комфорта.
Такой вид уборки, как генеральная, предполагает детальную чистку всех поверхностей и углов. Каждая компания предлагает собственные пакеты услуг, которые могут варьироваться по цене и качеству.
Для выбора надежной клининговой компании важно учитывать отзывы и репутацию. Достойные клининговые фирмы обеспечивают четкие условия работы и гарантии на предоставляемые услуги.
Create a unique design for your project with [url=https://mystampready0-constructor.com/]stamp creator online free[/url]!
Making custom stamps online has turned into a necessary resource for numerous artists and companies. With the rise of digital technology, the stamp-making industry has adapted to meet modern demands.
A multitude of online platforms supply accessible tools for designing bespoke stamps. These functionalities permit users to choose dimensions, forms, and designs tailored to their likings.
When the design is ready, customers can conveniently order through these online services. Generally, production durations are short, guaranteeing that users acquire their stamps promptly.
Moreover, online stamp-making offers a wide range of materials and methods to choose from. Users can choose from rubber, wood, and even digital options for their stamping needs.
Discover the perfect balance of comfort and support with [url=https://asicssport.ru/]asics gel kayano[/url], which is perfect for runners at any distance.
The Asics Gel Kayano has gained a strong following among athletes due to its exceptional comfort and support. Featuring cutting-edge technology, this shoe to enhance performance. A key aspect of the Gel Kayano is its outstanding cushioning system. With this technology, runners can enjoy both impact absorption and a smooth ride.
The stability offered by the Gel Kayano is particularly impressive. This stability feature prevents overpronation, which is beneficial for numerous athletes. Runners who require additional arch support will find this shoe particularly beneficial. Ultimately, the Gel Kayano integrates comfort, support, and performance effectively.
Another reason for its popularity is the shoe’s durability. Crafted with quality materials, this shoe is built to handle intense training. Long-term wear is assured for runners who choose this model. The combination of durability and comfort makes it a valuable investment.
Before purchasing the Asics Gel Kayano, testing them in-store is crucial. It’s essential to achieve the right fit because foot shapes differ from one person to another. Useful insights can be garnered from a visit to a specialized running shop. For your running requirements, the ideal shoe might just be the Asics Gel Kayano.
Если вы мечтаете о комфортном и экологически чистом жилье, наши деревянные дома под ключ|деревянный дом под ключ|деревянный дом под ключ цена|деревянные дома под ключ цены|строительство деревянных домов под ключ|построить деревянный дом под ключ|строительство домов из дерева под ключ|деревянный коттедж под ключ|строительство деревянных домов под ключ проекты и цены|строительство деревянных коттеджей под ключ|дом деревянный под ключ|заказать деревянный дом|деревянные дома под ключ проекты и цены|дома деревянные под ключ|строительство деревянных домов москва|дом деревянный под ключ цена|деревянный дом под ключ проекты и цены|строительство деревянного дома под ключ цена|строительство деревянных домов под ключ москва — идеальный выбор для вас!
Все больше людей выбирают деревянные дома под ключ для своего жилья . Они привлекают внимание своей экологичностью и эстетикой .
Одним из главных плюсов деревянных домов является отличная теплоизоляция . Благодаря этому, расходы на обогрев зимой значительно снижаются .
Кроме того, такие дома можно легко индивидуализировать в соответствии с желаниями хозяев . Строительство таких домов происходит быстро и не вызывает особых трудностей .
Не стоит забывать, что за деревянными домами необходим постоянный уход . Тем не менее, при правильном уходе дом прослужит долгие годы .
Мы предлагаем качественную [url=https://pechat-na-futbolkah-msk1.ru]печать на футболках|печать на футболке|принт на футболку|принт на футболке|принт на футболки|футболка с принтом на заказ|футболки с принтом на заказ|принт на футболках|футболка со своим принтом|футболки со своим принтом|печать на футболках москва|печать на футболке москва|заказ футболки с принтом|заказать футболку со своим принтом|заказ футболки со своим принтом|заказ футболок со своим принтом|заказать футболки со своим принтом|заказать футболку с принтом|заказ футболок с принтом|заказать футболки с принтом|футболки с надписями на заказ|сделать принт на футболке|сделать принт на футболку[/url] по индивидуальным дизайнам!
Необходимо учитывать качество печати
Постройте свой идеальный [url=https://karkasnye-doma-spb0.ru]каркасный дом|каркасные дома спб|каркасный дом под ключ|каркасный дом спб|каркасный дом под ключ спб|строительство каркасных домов спб|дома каркасные спб|дома каркасные|каркасный дом цена|каркасный дом под ключ в спб|каркасные дома под ключ проекты и цены|строительство каркасных домов в спб|каркасные дома в спб|каркасный дом в спб|строительство каркасных домов в санкт-петербурге|каркасные дома санкт петербург|каркасный дом санкт петербург|строительство каркасных домов в санкт-петербурге|строительство каркасных домов под ключ|каркасные дома спб под ключ|каркасные дома под ключ в спб цены|дом каркасный под ключ|каркасные дома цены|каркасный дом под ключ в спб цена[/url] и наслаждайтесь комфортом и качеством!
Наконец, стоит упомянуть о возможностях дизайна.
… [Trackback]
[…] There you can find 7138 more Info on that Topic: coinchapter.com/crypto-price-prediction-shiba-inu-shib-cardano-ada-dogecoin-doge-ripple-xrp-polkadot-dot/ […]
Запишитесь на [url=https://seoflagman.pro/]seo курсы|курсы сео|курсы seo|подсказка оптимизатор про павел|обучение seo специалист|seo специалист курсы|seo продвижение курсы|seo специалист обучение|seo курсы онлайн|обучение seo|онлайн курсы seo|seo обучение|seo оптимизация обучение|обучение seo с нуля|курс seo|курс seo специалист|seo курс|продвижение сайтов обучение|обучение продвижение сайтов|обучение сео продвижению|курсы seo продвижение|курсы сео продвижение|сео продвижение курсы|seo продвижение курс|seo школа|курсы seo специалист|курсы по продвижению|курсы по seo продвижению|продвижение сайта обучение|seo продвижение обучение|обучение seo продвижению|обучение по продвижению сайтов|seo курсы москва|раскрутка сайта обучение|сео обучение|seo специалист обучение с нуля|курс по продвижению|seo продвижение сайта обучение|обучение сео|seo оптимизация курсы|обучение продвижению сайтов|курсы seo продвижения|курсы seo москва|seo обучение курсы|сео продвижение обучение|курсы продвижения сайтов|курсы сео онлайн|продвижение обучение|курсы по сео|обучение продвижению сайтов с нуля|курсы seo с нуля[/url] и начните карьеру в мире цифрового маркетинга!
Алгоритмы поисковых систем и тренды быстро изменяются.
При этом аренда часто дополняется различными опциями по обслуживанию и ремонту.
лизинг оборудования для юр лиц [url=http://www.lizing-kommercheskogo-avto0.ru/oborudovanie]https://lizing-kommercheskogo-avto0.ru/oborudovanie/[/url]
Можно выбрать как компактный одноэтажный дом, так и большой двухэтажный проект.
готовые проекты дома [url=https://www.gotovye-proekty-domov0.ru]https://gotovye-proekty-domov0.ru/[/url]
Many people nowadays use temp number for verification|temp sms|temp phone number online?|temp number|temp phone number|temp mobile number?|temp text number?|temp sms number|temp number for otp|temporary number for verification|temporary phone number|temporary number, to keep your personal information safe when registering on various online platforms.
Temp numbers for verification have become a popular trend in the digital age . This is largely due to the increasing need for security and privacy in online transactions and data sharing . With the rise of online services and digital platforms, the risk of identity theft and fraud has also increased substantially . As a result, individuals and organizations are looking for ways to protect their personal and sensitive information from cyber threats .
The use of temp numbers for verification is a simple yet effective way to add an extra layer of security to online transactions and data sharing . This method involves using a temporary phone number that is used only once to receive verification codes or messages . By using a temp number for verification, individuals can protect their personal phone numbers from being used for malicious purposes.
Benefits of Using Temp Number for Verification
One of the primary benefits of using a temp number for verification is enhanced security . This is because temp numbers for verification can help protect personal phone numbers from being shared or exposed . Additionally, temp numbers for verification can help reduce the risk of identity theft or fraud .
Temp numbers for verification provide ease of use. This is because temp numbers for verification can be quickly set up and used . With the rise of online services and digital platforms, the need for temp numbers for verification has increased significantly . As a result, individuals and organizations are looking for reliable and trustworthy providers of temp numbers for verification that cater to their specific needs and requirements.
How Temp Number for Verification Works
Using a temporary number for verification involves a simple process. This involves creating an account with a temp number service . Once the account is set up, individuals can obtain a temp number for verification that can be used to receive verification codes or notifications.
Temp numbers for verification can be used to verify accounts on different platforms . This includes social media platforms . By using a temp number for verification, individuals can prevent unauthorized access to sensitive information . Additionally, temp numbers for verification can be used to test or verify online services .
Conclusion and Future of Temp Number for Verification
Using a temporary number for verification is a crucial step in protecting personal and sensitive information from unauthorized access . As the digital landscape continues to evolve, the need for temp numbers for verification will increase significantly . This is because temp numbers for verification provide a practical approach to add an extra layer of security to online transactions and digital interactions.
The use of temp numbers for verification is expected to increase in online security and privacy. As technology advances, temp numbers for verification will offer more advanced features . This will include the implementation of machine learning algorithms to enhance the security and privacy of temp numbers for verification. Additionally, temp numbers for verification will be integrated into more online services of online security and privacy measures.
Для тех, кто интересуется службами замены материнства в столице России, существует множество возможностей найти информацию о [url=https://surrogate-mama.ru]суррогатное материнство в москве|суррогатная мать москва|суррогатное материнство цена в москве|суррогатная мать цена москва|сколько стоит суррогатное материнство в москве|сколько стоит суррогатное материнство в москве цена|стану суррогатной матерью в москве|стать суррогатной матерью в москве|суррогатная мама москва|стоимость суррогатного материнства в москве|услуги суррогатной матери москва|сколько стоит суррогатная мать в москве|услуги суррогатной матери цена москва|стану суррогатной мамой москва|стать суррогатной мамой москва|стать суррогатной матерью в москве цены|стоимость суррогатной матери в москве|найти суррогатную мать в москве|суррогатная мама цена в москве|суррогатное материнство в москве под ключ|стоимость услуг суррогатной матери в москве|сколько платят суррогатным матерям в москве|цена суррогатного материнства в москве под ключ|сколько стоят услуги суррогатной матери в москве|услуги суррогатной матери цена москва под ключ|хочу стать суррогатной матерью в москве|найти суррогатную мать цена москва|стать суррогатной мамой в москве цена|стоимость суррогатного материнства в москве под ключ|суррогатное материнство в москве мирсурмам[/url], что может включать различные варианты услуг по помощи в зачатии и вынашивании детей для семей, которые по каким-то причинам не могут иметь детей естественным путем.
Суррогатное материнство в столице России требует тщательного планирования и соблюдения всех юридических требований.
Юридические Аспекты
Суррогатное материнство в Москве включает в себя сложные юридические соглашения и контракты.
Медицинские Аспекты
В Москве суррогатное материнство включает в себя передовые медицинские технологии и методы.
оциальные и Психологические Аспекты
Суррогатное материнство в Москве включает в себя комплексную психологическую помощь.
Современные [url=https://www.klerk.ru/materials/2025-08-15/kursy-po-seo-2025-reyting-luchshih-programm-s-otzyvami-i-sravneniem/]курсы сео|seo специалист курсы|seo специалист обучение|seo курсы онлайн|курс сео|seo обучение с нуля|курс seo|seo курс|seo продвижение курс|обучение seo с нуля[/url] предоставляют комплексные знания и навыки в области оптимизации сайтов для поисковых систем, что является важнейшим аспектом цифрового маркетинга в сегодняшнем онлайн-бизнесе.
Курсы по оптимизации сайтов для поисковых систем набирают большую популярность среди бизнесменов и маркетологов, стремящихся повысить свою онлайн-видимость . Это связано с тем, что положение сайта в результатах поиска имеет прямое отношение к количеству посетителей и, соответственно, к коммерческому успеху фирмы . Завершение курса по SEO дает специалисту возможность разобраться в тонкостях оптимизации и существенно повысить эффективность своих маркетинговых усилий .
Курсы SEO охватывают широкий спектр тем, связанных с оптимизацией сайтов для поисковых систем, включая выбор ключевых слов, создание качественного контента и построение ссылок . Преподаватели таких курсов обычно имеют обширный опыт в области SEO и делятся своим практическим опытом с студентами .
Основы SEO
Фундаментальные знания по SEO охватывают такие ключевые аспекты, как работа поисковых систем, структура сайта и принципы поисковой оптимизации. Один из важных элементов SEO — это определение оптимальных ключевых слов, которые будут использоваться для оптимизации контента и привлечения релевантной аудитории . Кроме того, создание качественного и уникального контента, который будет привлекать и удерживать внимание посетителей, является важным аспектом SEO .
Построение качественных ссылок с других сайтов также является важным аспектом SEO, поскольку это помогает повысить авторитет и рейтинг сайта . Курсы SEO учат, как анализировать сайты конкурентов и использовать эту информацию для улучшения своей собственной SEO-стратегии .
Продвинутые техники SEO
Расширенные методы SEO предполагают использование специализированных инструментов для мониторинга сайта и своевременной реакции на обновления поисковых алгоритмов . Одним из продвинутых методов является использование техник внутренней оптимизации, таких как оптимизация заголовков и мета-описаний .
Специализированные курсы по SEO включают в себя изучение способов применения социальных сетей для повышения узнаваемости бренда и привлечения новых посетителей . Применение аналитических инструментов для мониторинга посещаемости и поведения пользователей на сайте является важным элементом SEO, позволяющим оценить эффективность проводимых действий .
Реализация и поддержка SEO
Внедрение и последующая поддержка SEO-стратегии требует системного подхода, включая регулярный анализ результатов и корректировку действий для достижения максимальной эффективности. Специализированные курсы по SEO дают возможность разработать и реализовать рабочую SEO-стратегию, соответствующую конкретным потребностям и целям компании .
Постоянное обновление знаний и навыков в области SEO является важным для поддержания и улучшения позиций сайта в поисковых системах . Специализированные курсы по SEO позволяют участникам быть в курсе всех последних новостей и изменений в поисковых алгоритмах, что позволяет им оперативно корректировать свою стратегию .
Bakmak [url=https://hdizlefilm.site]kıyamet 2018 türkçe dublaj aksiyon filmi izle[/url] ve mükemmel kalitenin tadını çıkarın!
Film izlemenin keyfini çıkarmak için doğru platformu seçmek önemli. Detaylı görseller sunan yüksek kaliteli filmler, film keyfinizi büyük ölçüde artırabilir. Bu tür filmleri izlemek için kaliteli bir TV kullanmanız gerekmektedir. Bu sağlanmazsa, filmlerin tadını yeterince çıkaramazsınız.
Birçok platform, 4K film seçeneği sunuyor. Bu web siteleri, genellikle kullanıcı dostu arayüzler ile izleyicilere kolaylık sağlamaktadır. Zengin içerikleri ile dikkat çeken bu platformlardan birçok hizmet, ücretli olarak hizmet vermektedir. Filmsel ihtiyaçlarınızı karşılamak için bu platformları keşfetmek mükemmel bir fırsat.
Sinema keyfi için bir diğer önemli faktör ise doğru ses sistemidir. Full HD filmler, zengin hale gelmesine karşın, ses kalitesi de eşit öneme sahiptir. İyi bir ses sistemi ile film deneyiminizi tamamlamak mümkündür. Bu bağlamda film izlemeye hazırlanmadan önce, ses düzenlemenizi gözden geçirin.
Son olarak, 4K film izlemek, bir hobiden fazlasıdır. bir kültürel deneyimdir. Her film gösterimi, izleyiciye bir şeyler katmayı amaçlamaktadır. Günlük yaşamın koşuşturmasından kaçmak için, iyi bir film seçimi yapmak önemlidir. Düşünün ki, film izleme deneyiminiz, seçtiğiniz içerikle ilgilidir.
Оцените нашу доставка алкоголя 24 москва во время вашего следующего праздника!
Услуга доставки алкоголя становится все более востребованной в современном обществе.. С помощью этого сервиса вы можете легко получить доступ к своим любимым алкогольным напиткам..
Многие компании предлагают разнообразные варианты доставки, включая алкогольные коктейли, вино и пиво.. Это позволяет каждому клиенту выбрать то, что ему по душе, и удобно заказать.Пользователи могут легко найти то, что им подходит, и оформить заказ на понравившийся алкоголь.
Следует подчеркнуть, что такая услуга делает процесс покупки удобнее.. Теперь можно забыть о долгих очередях и потере времени на покупку алкоголя в магазине.
Тем не менее, выбирая сервис доставки алкоголя, следует учитывать некоторые важные моменты.. Ключевыми факторами являются уровень обслуживания, разнообразие продукции и время, необходимое для доставки.
Забронируйте стрижку в нашем барбершоп рядом уже сегодня и преобразите свой стиль!
В Красноярске барбершопы становятся всё более популярными . Люди в Красноярске стремятся найти профессиональные услуги стрижки и ухода за волосами .
Подбор барбершопа — это серьезное дело. Важно обратить внимание на опыт барберов и мнения их клиентов .
У каждого барбершопа есть свои отличия в обслуживании клиентов . Некоторые заведения фокусируются на классических стилях, в то время как другие предлагают современные тенденции .
Рекомендуется заранее записываться на стрижку, чтобы не тратить время в очереди . Забота о волосах и бороде между визитами в барбершоп также важна.
Для безопасной и комфортной езды в зимних условиях рекомендуем обратить внимание на [url=https://kupit-zimnie-shipovannie-shini.ru/]шипованная резина новая купить[/url].
В зимний период выбор шины становится особенно актуальным. Выбор шипованных шин — это важный шаг для безопасности на дороге. Они обеспечивают отличное сцепление на скользкой поверхности. С шипованными шинами водители могут смело выезжать в любую погоду.
Однако, важно правильно выбрать шипованные шины. Существует несколько важных аспектов, на которые стоит обратить внимание. Размер шин, их тип и назначение играют ключевую роль. Неуместные шины могут вызвать серьезные проблемы на дороге.
Известные бренды предлагают разнообразие шипованных шин. Проверка отзывов и рейтингов поможет сделать правильный выбор. Качественные шины должны гарантировать не только сцепление, но и продолжительный срок службы. Важно учитывать этот фактор при выборе шины.
После установки шипованных шин, следует правильно их эксплуатировать. Не забывайте проверять давление и состояние протектора. Осторожность на скользкой дороге значительно повысит безопасность. Это поможет вам не только сохранить шины, но и обеспечить безопасность.
Create a unique stamp with our [url=https://stamp-1creator.com/]free stamp maker online[/url]!
In today’s digital age, locating an efficient rubber stamp manufacturer on the internet has become increasingly essential.. Rubber stamps are pivotal in numerous situations.
A variety of websites provide tailored solutions to meet diverse requirements. These services enable the creation of stamps that showcase personal aesthetics. The process is generally straightforward and user-friendly.
After finalizing the design, the manufacturing process starts promptly. Many rubber stamp makers online ensure that the quality meets the highest standards. Customers can look forward to sturdy products that endure over time.
To sum up, finding an efficient rubber stamp manufacturer on the internet is important for effectiveness. With so many alternatives, users can identify the most suitable option for their preferences. The benefits of accessing web-based services are considerable.
Вам нужна [url=https://psiholog-onlaine.ru/]сайт с подбором психологов[/url]?
Психология онлайн становится все более популярной. Онлайн-консультации с психологами привлекают внимание множества людей. Удобство и доступность таких услуг делают их привлекательными для многих.
Преимущества работы с психологом онлайн значительно увеличиваются. Во-вторых, доступность высококвалифицированных специалистов дает возможность выбора и гибкости. Это также позволяет принимать участие в сеансах из любой точки мира и в удобное время.
Несмотря на множество плюсов, существуют и минусы онлайн-консультаций. Отсутствие физического взаимодействия иногда затрудняет процесс общения. Технические проблемы могут негативно сказаться на качестве сеанса.
Важно правильно выбрать психолога для онлайн-консультаций. Подбор специалиста требует внимательного подхода, чтобы избежать неудачного опыта. Проверка квалификации психолога поможет вам защититься от недобросовестных специалистов.
Ищете надежный [url=https://kliningovaya-kompaniya-01.ru/]клининговая уборка[/url]? Мы предлагаем качественные услуги по уборке и поддержанию чистоты!
Клининг — это важная часть нашей жизни, чтобы обеспечить уют и комфорт в повседневной жизни. Регулярная уборка позволяет избавиться от пыли и грязи, что, в свою очередь, способствует улучшению здоровья. Именно поэтому мы должны заботиться о чистоте.
Существуют разные стратегии и техники проведения уборки. Каждый из них имеет свои особенности. Эффективные моющие средства могут значительно упростить процесс. Важно правильно выбрать метод в зависимости от типа загрязнений.
Вы можете заниматься уборкой самостоятельно, но иногда стоит рассмотреть возможность найма клининговой компании. Специалисты используют проверенные методы и технологии для уборки. Это гарантирует более эффективный и быстрый результат.
Чистота требует постоянного внимания и ухода. Создание распорядка для уборки поможет избежать накопления грязи. Регулярность уборки поможет избежать ненужных затрат esforcos. Чистый дом или офис — это не только приятно, но и полезно.
Для эффективного и безопасного перемещения тяжелых грузов на различных промышленных объектах и складах часто используется [url=https://gruzovoy-podyemnik-spb15.ru/]грузовые подъемники под ключ[/url], которое обеспечивает высокую производительность и снижает риск травм среди работников.
Подъемное оборудование используется для перемещения и подъема тяжелых грузов, что необходимо во многих отраслях промышленности и строительства. Это оборудование требует специальных знаний и навыков для безопасной эксплуатации. Специальное обучение операторов подъемного оборудования включает в себя изучение правил безопасности и инструкций по эксплуатации. Правильный выбор подъемного оборудования зависит от конкретной задачи и характеристик груза. Выбор подъемного оборудования зависит от веса, размера и типа груза, а также от условий эксплуатации.
Широкий спектр применений подъемного оборудования определяется его универсальностью и способностью эффективно решать задачи по подъему и перемещению грузов. Каждое применение подъемного оборудования требует тщательного планирования и подготовки. Перед началом работ проводится тщательный осмотр оборудования и проверка всех систем. Безопасность при работе с подъемным оборудованием имеет первостепенное значение. Обеспечение безопасности при работе с подъемным оборудованием включает в себя соблюдение нормативных требований, использование средств индивидуальной защиты и постоянный контроль за работой оборудования.
Регулярное обслуживание подъемного оборудования является необходимым для обеспечения его работоспособности и безопасности. Ремонт подъемного оборудования должен выполняться только квалифицированными специалистами. Ремонт подъемного оборудования требует высокого уровня квалификации и опыта, поскольку от качества ремонта зависит безопасность эксплуатации. Обучение персонала обслуживающего и ремонтного персонала является крайне важным. Квалифицированные специалисты могут быстро и эффективно устранять неисправности и выполнять плановое обслуживание.
Применение современных технологий, таких как автоматизация и робототехника, позволяет повысить точность и скорость выполнения работ. Перспективы развития подъемного оборудования тесно связаны с потребностями промышленности и строительства. Новые разработки подъемного оборудования направлены на решение задач, связанных с увеличением грузоподъемности, улучшением маневренности и снижением энергопотребления. Устойчивость и экологичность подъемного оборудования становятся все более важными факторами. Экологичность и эффективность подъемного оборудования будут играть решающую роль в развитии отрасли в будущем.
Компания предлагает услуги по проектированию и строительству деревянный коттедж под ключ, используя высококачественные материалы и современные технологии.
Дома из дерева являются отличным выбором для экologically сознательных людей . Строительство таких домов под ключ позволяет заказчикам получить готовое жилье без дополнительных хлопот Строительство домов под ключ позволяет клиентам избежать лишних проблем . Кроме того, деревянные дома известны своей долговечностью и низкими эксплуатационными затратами Деревянные дома имеют долгий срок службы и низкие расходы на обслуживание .
Особое внимание стоит уделить тому, что деревянные дома под ключ могут быть выполнены в различных стилях и дизайнах Деревянные дома под ключ могут быть созданы в разных архитектурных стилях . Это позволяет клиентам выбрать именно тот вариант, который соответствует их требованиям и предпочтениям Заказчики имеют возможность выбрать дом, полностью отвечающий их??ам . Более того, многие компании, занимающиеся строительством деревянных домов, предлагают услуги по индивидуальному проектированию Компании могут предложить персонализированные решения для каждого клиента.
Одним из ключевых преимуществ деревянных домов под ключ является их экологичность Деревянные дома являются экологически чистым вариантом . Дерево как материал является возобновляемым и требует меньше энергии для обработки, чем традиционные материалы Дерево является возобновляемым ресурсом и требует меньше энергии для обработки . Кроме того, деревянные дома под ключ часто включают в себя современные технологии и материалы, повышающие их энергоэффективность Деревянные дома под ключ могут быть оснащены современными решениями для повышения энергоэффективности .
Другим важным аспектом является долговечность и низкая необходимость в ремонте Деревянные дома обеспечивают стабильность и надежность на протяжении многих лет. Деревянные дома под ключ строятся с использованием высококачественных материалов и технологий, что обеспечивает их прочность и отсутствие необходимости в частом ремонте Деревянные дома под ключ строятся с использованием качественных материалов . Более того, многие компании предлагают гарантийное обслуживание и поддержку Компании предоставляют гарантии на проведение ремонтных работ .
Процесс строительства деревянных домов под ключ включает в себя несколько этапов, начиная от проектирования и заканчивая окончательной отделкой Процесс строительства деревянных домов под ключ состоит из нескольких стадий . Первым шагом обычно является разработка индивидуального проекта, который учитывает все пожелания и потребности клиента Первым этапом является создание персонализированного дизайна . После этого происходит производство элементов дома на заводе После этого изготавливаются все необходимые компоненты для дома.
На завершающем этапе происходит сборка и окончательная отделка дома на месте его будущего расположения Затем происходит монтаж дома и его окончательная отделка . Этот процесс обычно занимает меньше времени, чем традиционное строительство, и позволяет получить готовый дом под ключ Этот метод обеспечивает быструю и качественную постройку дома. Кроме того, компании often предлагают услуги по доставке и монтажу Компании часто включают в себя услуги по перевозке и сборке в свои предложения.
В заключении, деревянные дома под ключ предлагают широкий спектр преимуществ, включая экологичность, долговечность и современный дизайн В качестве вывода можно сказать, что деревянные дома под ключ представляют собой уникальное сочетание преимуществ. Эти дома могут быть спроектированы в соответствии с индивидуальными пожеланиями и потребностями клиентов Деревянные дома под ключ могут быть разработаны с учетом всех пожеланий. Более того, процесс их строительства включает в себя современные технологии и материалы, что повышает их энергоэффективность и снижает воздействие на окружающую среду Процесс строительства обеспечивает минимальное воздействие на природу.
В целом, деревянные дома под ключ представляют собой перспективный вариант для тех, кто ищет комфортное, экологичное и долговечное жилье В целом, деревянные дома под ключ являются отличным выбором . Они сочетают в себе лучшие традиции деревянного домостроения с современными технологиями и дизайном Они сочетают традиционные методы строительства с современными технологиями . Компании, занимающиеся строительством таких домов, предлагают комплексные услуги, начиная от проектирования и заканчивая окончательной отделкой и обслуживанием Компании предоставляют широкий спектр услуг, включая проектирование и обслуживание .
Для тех, кто интересуется современными и эффективными строительными технологиями, [url=https://stroylite-dom.ru/karkasnie-doma/]каркасные дома спб[/url] становится все более популярным вариантом, предлагающим множество преимуществ в плане энергосбережения и скорости строительства.
представляют собой инновационное решение для тех, кто хочет жить в комфорте. Они дают возможность экономить на строительстве. Каркасные дома могут быть спроектированы под любые вкусы.
Каркасные дома стали обязательным элементом современного строительства . Они обеспечивают высокий уровень комфорта. Каркасные дома строятся быстро. Каркасные дома являются экологически чистым вариантом .
Каркасные дома имеют высокую энергоэффективность . Они строятся быстро. Каркасные дома являются экологически чистым вариантом . Каркасные дома могут быть спроектированы под любые вкусы .
Каркасные дома стали популярными благодаря своим преимуществам . Они предлагают высокую энергоэффективность . Каркасные дома могут быть спроектированы под любые вкусы . Каркасные дома обеспечивают высокий уровень комфорта.
Процесс строительства каркасных домов начинается с проектирования . Затем проводятся работы по монтажу каркаса . Каркасные дома имеют долгий срок службы . После устанавливаются коммуникации .
Процесс строительства каркасных домов включает в себя несколько этапов . Затем следует этап строительства фундамента. Каркасные дома имеют высокую энергоэффективность . После установка коммуникаций .
Каркасные дома имеют высокую энергоэффективность . Они имеют долгий срок службы . Каркасные дома могут быть спроектированы под любые вкусы . В ближайшем будущем каркасные дома станут еще более популярными .
Каркасные дома имеют долгий срок службы . Они могут быть использованы для строительства коттеджей . Каркасные дома могут быть спроектированы под любые вкусы . В каркасные дома будут продолжать совершенствоваться.
Для тех, кто ищет современное и практичное жилье, [url=https://karkasnye-doma-spb2.ru/]дом каркасный под ключ[/url] может стать идеальным решением, сочетая в себе доступность, быстроту строительства и экологическую безопасность.
благодаря своей экологичности и экономичности . Это связано с тем, что каркасные дома позволяют создать индивидуальный проект . Кроме того, каркасные дома имеют высокую энергоэффективность .
Каркасный дом – это не только экономичный, но и экологически чистый вариант жилья поскольку для его строительства используются натуральные материалы . Это означает, что каркасные дома не наносят вреда окружающей среде . Кроме того, каркасные дома могут быть спроектированы в любом стиле .
Каркасный дом имеет множество преимуществ как простота и скорость монтажа. Это связано с тем, что каркасные дома построены на прочном каркасе . Кроме того, каркасные дома могут быть спроектированы в любом стиле.
Каркасный дом – это идеальный вариант для тех, кто хочет иметь комфортное и экологичное жилье . Это связано с тем, что каркасные дома имеют высокую энергоэффективность . Кроме того, каркасные дома могут быть оснащены современными технологиями .
Строительство каркасного дома – это процесс который требует тщательного планирования и подготовки . Это связано с тем, что каркасные дома имеют высокую энергоэффективность . Кроме того, каркасные дома могут быть построены на любом типе грунта .
Каркасный дом может быть построен с использованием современных технологий . Это означает, что каркасные дома могут быть построены быстро и качественно . Кроме того, каркасные дома могут быть построены на любом типе грунта .
Каркасный дом – это идеальный вариант для тех, кто хочет иметь индивидуальный проект. Это связано с тем, что каркасные дома построены на прочном каркасе . Кроме того, каркасные дома имеют низкую стоимость по сравнению с другими типами жилья .
Каркасный дом – это не только экономичный, но и экологически чистый вариант жилья в связи с тем, что он может быть построен из переработанных материалов. Это означает, что каркасные дома имеют минимальное воздействие на экосистему. Кроме того, каркасные дома могут быть построены с учетом индивидуальных потребностей владельца.
Чтобы повысить позиции своего сайта в поисковых системах, я решил пройти [url=https://www.6560.ru/]интернет магазин создание раскрутка продвижение[/url], где я смог получить ценные знания и навыки для успешного продвижения своего интернет-ресурса.
SEO курс незаменим для улучшения позиций сайта в поисковых результатах. Это объясняется тем, что большинство пользователей находят необходимую информацию через поисковые системы . Таким образом, владение знаниями SEO является обязательным для любого маркетолога .
Основы SEO включают в себя оптимизацию сайта для поисковых систем . Это включает в себя оптимизацию мета-тегов и заголовков . Кроме того, улучшение авторитета сайта через ссылки является важнейшим аспектом SEO. Понимание этих основ является основой для успешного продвижения сайта.
Продвинутые техники SEO включают в себя оптимизацию сайта для голосового поиска. Это также включает в себя создание контента, адаптированного для различных устройств . Освоение этих техник может существенно улучшить позиции сайта в поисковых результатах и увеличить конверсию. использование этих навыков требует постоянной практики и обучения.
Заключение о важности SEO курса очевидно: это основа для построения успешной онлайн-стратегии. Постоянное обучение и освоение новых техник является обязательным для оставаться впереди конкурентов. по мере изменения алгоритмов и поведения пользователей , kurs по SEO должен быть частью постоянного образования и совершенствования.
Если вы ищете [url=https://best-photographers-moscow.ru/]как выбрать фотографа для фотосессии[/url], вы найдете множество талантливых специалистов, готовых запечатлеть самые яркие моменты вашей жизни.
Топ фотографов в Москве предлагают свои услуги для создания уникальных снимков. У каждого есть индивидуальный подход к работе . Выбор фотографа — это важный шаг, который определяет, как будут запечатлены ваши воспоминания.
В столице работает большое количество умелых фотографов . При выборе фотографа стоит обратить внимание на его портфолио . Разнообразие стилей в портфолио свидетельствует о профессионализме .
Мнение предыдущих клиентов поможет оценить качество работы . Личное мнение может помочь в выборе специалиста. Наличие положительных рекомендаций — залог удачного выбора .
Цены на фотографии зависят от многих факторов. Перед заказом желательно обсудить все детали . Профессиональный подход требует взаимопонимания и доверия.
Если вы хотите прокачать свои навыки в сфере интернет-маркетинга, обратите внимание на [url=https://www.markintalk.ru/kursy-seo-moskva/]seo продвижение курсы[/url], чтобы достичь успеха в продвижении ваших проектов.
В последние годы СЕО-курсы приобрели огромную популярность . Всё больше людей начинают осознавать важность навыков интернет-маркетинга. Обучение на таких курсах может открыть множество дверей .
Одним из главных преимуществ таких курсов является доступность информации . Учащиеся могут выбрать, обучаться онлайн или в классе . Это позволяет каждому найти наиболее подходящий для себя вариант обучения .
В зависимости от начальных знаний, курсы могут предлагать разные уровни трудности . Гибкость курсов обеспечивает возможность обучения на любом уровне подготовки. Профессиональные эксперты делятся своими знаниями, помогая понять сложные аспекты.
Многие студенты этих курсов легко устраиваются на работу после завершения обучения. Полученные знания помогают повысить конкурентоспособность на рынке труда . Таким образом, СЕО-курсы являются отличным выбором для профессионального роста .
На нашем сайте доступен всесторонний [url=https://москва-курсы-сео1.рф/]курс по seo оптимизации[/url], который охватывает все аспекты онлайн-маркетинга и поможет вам стать профессионалом в области SEO.
Курс по SEO становится все более популярным среди компаний, желающих улучшить свое онлайн-присутствие . Это связано с тем, что многие люди начинают свою поисковую деятельность в интернете с поисковых систем . Кроме того, курс по SEO предоставляет инструменты для улучшения позиций сайта в поисковых системах.
курс по SEO включает в себя как теоретические, так и практические занятия, чтобы обеспечить глубокое понимание предмета . Это важно, потому что SEO требует глубокого понимания не только технических аспектов, но и маркетинга и поведения пользователя .
Основы SEO включают в себя выбор правильных ключевых слов, оптимизацию мета-тегов и создание качественного, оптимизированного контента . Это включает в себя анализ конкурентов и их стратегий SEO . Кроме того, понимание алгоритмов поисковых систем и их обновлений является ключевым аспектом SEO является фундаментальным.
курс по SEO вводит студентов в мир поисковой оптимизации, объясняя, как работают поисковые системы . Это необходимо, потому что основы SEO являются фундаментом, на котором строится вся стратегия поисковой оптимизации.
продвинутые техники SEO охватывают такие методы, как внутреннее и внешнее ссылкование, и создание контента для разных стадий воронки продаж . Это важно, потому что продвинутые техники SEO помогают адаптироваться к изменениям в алгоритмах поисковых систем и поведении пользователей.
Продвинутые техники SEO также включают в себя создание контента, оптимизированного для голосового поиска, и использование шемы маркировки для улучшения видимости в поисковых результатах . Это необходимо, потому что новые технологии и трендеты требуют от специалистов SEO быть в курсе последних разработок .
Практическое применение SEO включает в себя не только теоретические знания, но и умение применять эти знания на практике . Это связано с тем, что практические навыки позволяют более эффективно решать проблемы и достигать результатов .
практическое применение SEO включает в себя не только технические аспекты, но и коммуникацию с клиентами и понимание их бизнес-целей . Это важно, потому что практическое применение SEO является основой для построения успешной карьеры в области SEO.
Для эффективного и экологически ответственного удаления отходов после строительных или ремонтных работ в столице России пользуйтесь услугами [url=https://musor-moskow.ru/vyvoz-stroitelnogo-musora/]вывоз строительного мусора м3[/url], чтобы быстро и качественно решить проблему удаления строительных отходов.
строительный мусор является серьезной экологической проблемой . Это связано с необходимостью решения экологических вопросов. Поэтому экологически чистые методы утилизации мусора должны быть в приоритете .
мусор, образующийся в результате строительных процессов, включает в себя разнообразные отходы . Эти материалы могут быть переработаны . таких компаний в Москве довольно много.
Организация вывоза строительного мусора включает в себя несколько этапов . на строительной площадке необходимо организовать правильный сбор отходов. транспортные средства должны быть оборудованы для перевозки строительных отходов.
Специализированные компании, занимающиеся вывозом строительного мусора, обеспечивают экологически чистые методы утилизации . Они могут предоставить специальные контейнеры для сбора мусора . Такие компании играют важную роль в решении проблемы утилизации строительных отходов .
Экологическое значение вывоза строительного мусора заключается в предотвращении загрязнения окружающей среды . Неправильная утилизация строительных отходов может привести к нарушению экосистемы . Следовательно, важно сократить количество отходов.
Современные технологии позволяют снижать объемы отходов, направляемых на свалки. Это не только решает экологические проблемы . Такой подход способствует снижению негативного воздействия на окружающую среду.
Вывоз строительного мусора в Москве является важнейшим аспектом строительной деятельности. Грамотная организация вывоза и утилизации строительных отходов способствует снижению загрязнения . Стоит отметить, что необходимо повышать осведомленность общества об важности утилизации отходов .
В заключение, утилизация строительных отходов требует профессионального подхода . Решая эту проблему, мы снизим загрязнение окружающей среды . Итак, необходимо продолжать работать над улучшением методов утилизации отходов .
Для тех, кто ищет удобный способ приобрести напитки, [url=https://dostavka-alcogolya-world.ru/]как купить алкоголь с доставкой на дом в москве ночью[/url] предлагает широкий выбор напитков и услуг по доставке, что делает процесс покупки намного проще и удобнее.
Доставка алкогольных напитков приобрела огромную популярность в последнее время, прежде всего среди молодого населения . Это связано с тем, что люди стали отдавать предпочтение услугам, которые предлагают быструю и удобную доставку . Кроме того, скорость жизни постоянно растет, и люди стремятся найти способы оптимизировать свое время.
Индустрия доставки алкоголя постоянно развивается и совершенствуется за счет внедрения современных технологий и новых решений. Это позволяет компаниям увеличивать выбор предлагаемых товаров и улучшать качество обслуживания. Кроме того, возникают новые бизнес-модели и подходы к доставке алкоголя, которые включают партнерство с местными заведениями общественного питания.
Доставка алкоголя на дом имеет ряд преимуществ, главными из которых являются удобство и скорость. Это позволяет клиентам получить необходимые товары, не выходя из дома. Кроме того, доставка алкогольных напитков на дом уменьшает риск покупки товаров низкого качества , поскольку компании, которые занимаются доставкой алкоголя, тщательно подбирают своих поставщиков .
Доставка алкоголя на дом может быть более экономически эффективной, чем поход в магазин. Это связано с тем, что клиенты могут сохранить свои средства, не тратя их на проезд и время. Кроме того, компании, занимающиеся доставкой алкогольных напитков, часто проводят акции и предлагают скидки.
Процесс доставки алкогольных напитков состоит из нескольких стадий, начиная от оформления заказа и заканчивая доставкой . Это позволяет компаниям обеспечивать высокое качество обслуживания и точность доставки . Кроме того, компании используют новые технологии для мониторинга заказов и управления процессом доставки в реальном времени .
Компании, занимающиеся доставкой алкоголя, также должны соблюдать все необходимые??ные требования и нормативы . Это включает в себя проверку возраста клиентов и гарантию того, что доставка осуществляется только лицам, достигшим совершеннолетия . Кроме того, компании должны иметь лицензии и разрешения на осуществление деятельности по доставке алкоголя .
Будущее доставки алкоголя кажется перспективным и перспективным. Это связано с тем, что технологии будут продолжать развиваться и совершенствоваться, что позволит улучшать уровень сервиса и расширять спектр услуг . Кроме того, потребители будут все более требовательными к качеству и быстроте доставки , что будет стимулировать компании к постоянному совершенствованию и внедрению новых решений.
Доставка алкоголя на дом также может стать важным фактором в развитии turindustрии . Это связано с тем, что гости и путешественники часто ищут возможность приобрести алкогольные напитки, не выходя из отеля или места проживания, что позволит разработать новые бизнес-модели и услуги для этой группы потребителей.
Для поиска и выбора [url=https://best-photographers-moscow.ru/]атмосферные места в москве для фотосессий[/url] можно изучить множество вариантов на различных платформах и сайтах, где представлены услуги и работы лучших фотографов Москвы.
фотография является неотъемлемой частью городской жизни. Здесь можно найти фотографов, которые могут запечатлеть самую суть момента. Фотографы столицы могут похвастаться своей креативностью и талантом.
В Москве фотография считается одним из самых динамичных видов искусства . В столице России есть много мест, которые можно запечатлеть на фотографии.
В Москве есть фотографы, которые признаны лучшими. Их работы отличаются уникальностью и креативностью . Их талант признается не только в России, но и за рубежом.
Они имеют богатый опыт в области фотографии и умеют передавать через свои фотографии эмоции и чувства . Они работают с крупными компаниями и частными клиентами .
В последнее время в Москве наблюдается развитие фотографического искусства. Это обусловлено увеличением количества фотографов в столице . В Москве появляются новые возможности для фотографов.
Фотография в Москве развивается с каждым днем
Если вы хотите повысить свои навыки в области интернет-маркетинга и поисковой оптимизации, то отличным вариантом для вас станут [url=https://www.markintalk.ru/kursy-seo-moskva/]продвижение обучение[/url], которые помогут вам изучить все тонкости и сложности профессии seo-специалиста.
помочь участникам разобраться в основах поисковой оптимизации . Эти курсы обычно включают в себя практические занятия по оптимизации и теоретические лекции . Студенты, проходящие такие курсы, получат навыки, необходимые для создания эффективных стратегий поисковой оптимизации .
Курсы SEO пользуются большим спросом среди начинающих и опытных специалистов в области digital-маркетинга. Это связано с тем, что позиция сайта в поисковой системе tr?c ti?p влияет на количество посетителей и потенциальных клиентов . Участвуя в курсах SEO, студенты становятся способны создавать и реализовывать комплексные планы по продвижению веб-ресурсов.
Содержание курсов SEO включает в себя модули по основам поисковой оптимизации и продвинутым техникам . Студенты изучают инструменты и методы для анализа и улучшения видимости сайта в поиске. Особое внимание уделяется созданию высококачественного и релевантного контента .
Продвинутые курсы SEO могут включать в себя разделы, посвященные стратегиям контент-маркетинга и социального медиа-маркетинга . Учащиеся таких курсов узнают, как проводить глубокий анализ конкурентов и разрабатывать стратегии по их обгону .
Преимущества прохождения курсов SEO включают в себя увеличение потенциальных клиентов и продаж. Студенты, окончившие такие курсы, получают конкурентное преимущество на рынке труда . Кроме того, курсы SEO предоставляют возможность для сетевого общения и обмена опытом с другими специалистами .
Участие в курсах SEO также дает право на постоянную поддержку и обновление знаний в области SEO. Это особенно важно в условиях растущей конкуренции в онлайн-пространстве и необходимости постоянного совершенствования стратегий продвижения.
В заключение, курсы SEO представляют собой эффективный способ повысить видимость и позиции сайта в поисковых системах . Студенты, прошедшие такие курсы, открывают для себя новые возможности для профессионального роста и развития. Перспективы для специалистов SEO предполагают необходимость постоянного обучения и совершенствования навыков для успеха в этой области.
Для тех, кто ищет [url=https://gryadkamarket.ru/]семяныч ру официальный сайт каталог[/url], важно найти надежный и качественный ресурс, предлагающий широкий выбор семян и предоставляющий необходимую информацию о выращивании.
Семяныч ру официальный привлекает внимание многих пользователей. Это связано с тем, что новости о Семяныч ру официальном появляются каждый день. Кроме того, ресурсы о Семяныч ру официальном растут в количестве. Это позволяет пользователям Семяныч ру официального находить необходимую информацию. Более того, команда Семяныч ру официального постоянно работает над обновлениями.
Семяныч ру официальный предоставляет инструменты для реализации идей. Это означает, что пользователи Семяныч ру официального могут найти полезную информацию. Кроме того, ресурс Семяныч ру официальный имеет простую навигацию. Это способствует обмену мнениями и опытом на Семяныч ру официальном. Более того, команда Семяныч ру официального занимается поддержкой пользователей.
Семяныч ру официальный предлагает много возможностей. Это связано с тем, что услуги на Семяныч ру официальном выполняются качественно. Кроме того, ресурс Семяныч ру официальный доступен круглосуточно. Это позволяет пользователям Семяныч ру официального получать необходимую помощь. Более того, команда Семяныч ру официального постоянно работает над обновлениями.
Семяныч ру официальный обеспечивает высокое качество сервиса. Это означает, что посетители Семяныч ру официального могут получить новые знания. Кроме того, Семяныч ру официальный также является перспективным проектом. Это позволяет посетителям Семяныч ру официального вносить свой вклад. Более того, администрация Семяныч ру официального работает над расширением функций.
Для тех, кто ищет качественный [url=https://moykaterinburg.ru/shinomontazh/]шиномонтаж запись[/url], важно выбрать мастерскую, которая предлагает не только высокое качество услуг, но и удобные условия, такие как запись на удобное время и доступные цены.
услугой, которая включает в себя не только установку шин, но и их тщательную очистку. Это значит, что владельцы транспортных средств могут быть уверены в том, что их автомобили получат должный уход . Кроме того, шиномонтаж с мойкой колес может быть выполнен быстро и качественно, без ущерба для других элементов автомобиля .
Шиномонтаж с мойкой колес предоставляет автомобилистам возможность поддерживать техническое состояние своего автомобиля на высоком уровне, обеспечивая его безопасность и комфорт на дороге . Это связано с тем, что шиномонтаж с мойкой колес выполняется высококвалифицированными специалистами, имеющими необходимый опыт и оборудование . Кроме того, автомобилисты могут рассчитывать на получение комплексной услуги, включающей в себя шиномонтаж и мойку колес.
Процесс шиномонтажа с мойкой колес включает в себя не только установку шин, но и их тщательную очистку . Это значит, что эта услуга включает в себя не только шиномонтаж, но и мойку колес, что способствует поддержанию внешнего вида автомобиля. Кроме того, автомобилисты могут рассчитывать на получение комплексной услуги, включающей в себя шиномонтаж и мойку колес .
Шиномонтаж с мойкой колес является важнейшим условием для обеспечения безопасности и комфорта на дороге . Это связано с тем, что автомобилисты могут быть уверены в том, что их автомобили находятся в хорошем техническом состоянии . Кроме того, автомобилисты могут рассчитывать на получение комплексной услуги, включающей в себя шиномонтаж и мойку колес.
Шиномонтаж с мойкой колес включает в себя не только установку шин, но и их тщательную очистку . Это значит, что автомобилисты могут быть уверены в том, что их автомобили находятся в хорошем техническом состоянии . Кроме того, эта услуга позволяет владельцам транспортных средств экономить время и средства, не обращаясь в разные сервисы для шиномонтажа и мойки колес.
Результаты шиномонтажа с мойкой колес зависят от качества выполненной работы . Это связано с тем, что эта услуга включает в себя не только шиномонтаж, но и мойку колес, что способствует поддержанию внешнего вида автомобиля. Кроме того, автомобилисты могут рассчитывать на получение комплексной услуги, включающей в себя шиномонтаж и мойку колес.
В заключение, шиномонтаж с мойкой колес является важным условием для обеспечения безопасности и комфорта на дороге . Это значит, что эта услуга включает в себя не только шиномонтаж, но и мойку колес, что способствует поддержанию внешнего вида автомобиля. Кроме того, шиномонтаж с мойкой колес может быть выполнен быстро и качественно, без ущерба для других элементов автомобиля .
Рекомендуется обращаться к высококвалифицированным специалистам, имеющим необходимый опыт и оборудование . Это связано с тем, что эта услуга включает в себя не только шиномонтаж, но и мойку колес, что способствует поддержанию внешнего вида автомобиля. Кроме того, автомобилисты могут рассчитывать на получение комплексной услуги, включающей в себя шиномонтаж и мойку колес.
Для тех, кто хочет раскрепоститься и сделать свой гардероб более персонализированным, существует отличный вариант – [url=https://pechat-na-futbolkah-msk1.ru/]заказать футболку с принтом[/url], которая позволяет создать уникальные дизайны и надписи по индивидуальному заказу.
является популярным способом создания уникальной одежды . Это увлекательное занятие для творческих людей . Печать на футболках может быть выполнена с помощью разных техник.
Печать на футболках начала развиваться как способ самовыражения. Сегодня существует множество методов печати . Печать на футболках позволяет создавать не только уникальную одежду .
Технологии печати на футболках verbessются с каждым годом . Существует несколько основных методов печати . Печать на футболках может быть выполнена термопереносом .
Печать на футболках требует знания технологий . Однако можно найти множество уроков. Печать на футболках может стать основным занятием .
Дизайн и создание печати на футболках включают в себя несколько этапов . Существует множество программ для создания дизайна . Печать на футболках требует?? правильных материалов .
Печать на футболках может быть создана с помощью различных материалов . Дизайн и создание печати на футболках требуют знания трендов. Печать на футболках позволяет создавать уникальные и эксклюзивные дизайны .
Применение и результаты печати на футболках требуют определенных навыков. Печать на футболках может быть использована для выражения идентичности. Результаты печати на футболках зависят от дизайна.
Печать на футболках может быть источником удовлетворения . Применение и результаты печати на футболках требуют внимания к деталям . Печать на футболках позволяет создавать уникальные и качественные продукты .
Для тех, кто интересуется [url=https://gruntvill.ru/]семяныч проращивание семян[/url], существуют специальные обогреватели для ускорения процесса прорастания.
ключевой этап в развитии будущего урожая. Этот процесс включает создание оптимальной среды для семян. Именно поэтому необходимо изучить характеристики каждого вида семян .
Проращивание семян может показаться сложным для новичков, но на самом деле это довольно просто . Основные шаги состоит в обеспечении необходимых условий для прорастания. Кроме того, следует поддерживать почву постоянно влажной, но не залитой водой.
Подготовка семян предполагает очистку семян от мусора и пыли . Перед проращиванием семена следует замочить в специальном растворе для усиления прорастания . После подготовки семена высаживают в подготовленный субстрат .
Во время подготовки следует следовать инструкциям на упаковке семян . Семена могут быть различными по форме, размеру и цвету . Поэтому отдельные виды семян требуют индивидуального подхода .
Создание оптимальных условий включает обеспечение достаточного освещения. Температура играет решающую роль в скорости проращивания. Влажность является важным фактором для поддержания здоровья семян .
Освещение влияет на развитие семян. Кроме того, полив должен быть регулярным, но не чрезмерным . Правильный уход предполагает регулярный осмотр семян на предмет заболеваний .
Уход за проросшими семенами требует регулярного полива и удобрения. Проросшие семена необходимо обеспечить достаточное количество свежего воздуха. Когда семена прорастают, необходимо следить за развитием корневой системы.
Удобрение должно быть сбалансированным и подходящим для типа растения . Контроль за ростом предполагает удаление сорняков и мусора. Следуя этим рекомендациям, можно существенно увеличить урожайность .
Для тех, кто интересуется карьерой в интернет-маркетинге, [url=https://best-seo-courses.ru/]курс по продвижению[/url] могут быть отличным стартом для изучения всех аспектов поисковой оптимизации и получения необходимых навыков для продвижения сайтов в интернете.
открывают двери к новым возможностям в области интернет-маркетинга и поисковой оптимизации. Эти курсы учат студентов анализировать поведение пользователей и оптимизировать сайты для лучшей конверсии . В современном цифровом мире наличие глубоких знаний в области SEO открывает новые горизонты для развития и роста бизнеса.
В рамках SEO курсов учатся создавать эффективные стратегии продвижения и оптимизации сайтов для лучшей видимости в поисковых системах. Эти знания позволяют участникам курсов создавать и реализовывать эффективные SEO-стратегии для своих бизнес-проектов или личных сайтов .
Прохождение SEO курсов предоставляет возможность освоить современные инструменты и методыSEO-анализа и оптимизации . Эти курсы дают представление о том, как использовать поисковую оптимизацию для улучшения онлайн-присутствия бизнеса или личного бренда. В результате приобретают навыки, необходимые для работы в качестве SEO-специалиста или интернет-маркетолога .
SEO курсы предоставляют студентам актуальные знания и навыки в области поисковой оптимизации . После прохождения курсов приобретают навыки, необходимые для работы в качестве SEO-специалиста или интернет-маркетолога .
SEO курсы открывают двери к новым возможностям в области интернет-маркетинга и поисковой оптимизации. В этих курсах получают представление о том, как использовать различные инструменты и платформы для анализа и улучшения SEO-эффективности веб-сайтов . Кроме того, получают представление о том, как использовать поисковую оптимизацию для улучшения онлайн-присутствия бизнеса или личного бренда .
В рамках SEO курсов учатся создавать и реализовывать эффективные SEO-стратегии для различных типов бизнеса и веб-сайтов. Эти знания позволяют участникам курсов создавать и реализовывать эффективные SEO-стратегии для своих бизнес-проектов или личных сайтов .
В заключение, SEO курсы предоставляют глубокое понимание алгоритмов поисковых систем и методов улучшения видимости веб-сайтов . После прохождения этих курсов приобретают навыки, необходимые для работы в качестве SEO-специалиста или интернет-маркетолога . В современном цифровом мире освоение навыков SEO стало необходимым для любого бизнеса или частного лица, стремящегося к онлайн-успеху .
Прохождение SEO курсов дает студентам глубокое понимание основных принципов и лучших практик поисковой оптимизации . Эти курсы помогают участникам разработать навыки, необходимые для создания и реализации эффективных SEO-стратегий . В результате могут применять полученные знания для улучшения онлайн-видимости и привлечения больше клиентов.
Для защиты вашего автомобиля от внешних воздействий и сохранения его первоначального вида, вы можете [url=https://plenka-poliuretan.ru/]купить полиуретановую пленку для оклейки автомобиля[/url], которая обеспечит надежную защиту поверхности кузова и сохранит его внешний вид на долгие годы.
универсальным решением для различных отраслей благодаря своим уникальным свойствам, таким как высокая прочность и эластичность . Она находит широкое применение в различных сферах, включая упаковку, производство и строительство . Полиуретановая пленка характеризуется длительным сроком службы.
Полиуретановая пленка имеет ряд уникальных свойств, которые делают ее незаменимой , что делает ее высоко востребованной среди потребителей. Она но и предотвращает появление различных повреждений . Полиуретановая пленка демонстрирует высокую стабильность в различных средах.
Полиуретановая пленка представляет собой надежное решение для упаковки товаров. Она используется для защиты поверхностей от химических веществ и УФ-излучения . Полиуретановая пленка обеспечивает стерильность и защиту. Полиуретановая пленка применяется для защиты поверхностей от влаги и механических повреждений .
Полиуретановая пленка демонстрирует высокую эффективность в различных применениях. Она также используется в строительстве и производстве . Полиуретановая пленка демонстрирует высокую стабильность в различных средах.
Полиуретановая пленка имеет высокую эффективность в различных применениях, что делает ее очень востребованной на рынке . Она а также продлевает срок службы обернутых поверхностей. Полиуретановая пленка применяется в широком диапазоне температур . Однако, полиуретановая пленка требует специального оборудования для производства.
Полиуретановая пленка требует регулярного обслуживания. Она также может быть неустойчивой к высоким температурам . Полиуретановая пленка требует специального оборудования для переработки. Однако, многие производители стремятся уменьшить негативное воздействие на окружающую среду.
Полиуретановая пленка может быть ordered tr?c ti?p у производителей. Она представлена в широком диапазоне толщин и размеров . Полиуретановая пленка доступна для покупки по сниженным ценам . Чтобы купить полиуретановую пленку, необходимо сравнить цены и условия доставки. Полиуретановая пленка обеспечит надежную защиту и защиту поверхностей .
Для пар, столкнувшихся с проблемами бесплодия, [url=https://surrogate-mama.ru]суррогатное материнство в москве под ключ[/url] может стать единственным способом стать родителями.
Суррогатное материнство в Москве набирает популярность как способ преодолеть проблемы с бесплодием . Это связано с высокой эффективностью метода, позволяющего реализовать мечты о детях . Отношение общества к суррогатному материнству изменяется, становясь более терпимым и понимающим .
Суррогатное материнство предполагает уникальную возможность для бездетных пар стать родителями с помощью суррогатной матери. Биологические родители берут на себя полную ответственность за воспитание и жизнь ребенка после рождения .
Юридические аспекты суррогатного материнства в Москве регулируются специальными законами, защищающими права всех сторон. Соглашение между суррогатной матерью и биологическими родителями должно быть составлено с учетом всех возможных последствий. Юридическая поддержка необходима для того, чтобы обе стороны были уверены в законности процесса .
Процесс усыновления после рождения ребенка требует тщательной подготовки документов для скорейшего оформления прав . Биологические родители должны доказать свою способность обеспечить достойную жизнь ребенку .
Медицинские аспекты суррогатного материнства в Москве включают в себя тщательный отбор доноров яйцеклеток и спермы . Донорство яйцеклеток и спермы основано на добровольном и анонимном принципе, защищая конфиденциальность.
Медицинское сопровождение включает регулярные осмотры и исследования для контроля за здоровьем матери и плода . Рекомендации для суррогатных матерей подчеркивают важность психологической поддержки на протяжении всего процесса.
Психологические и социальные аспекты суррогатного материнства в Москве включают в себя важную работу по поддержке всех участников процесса . Суррогатные матери могут испытывать сложные эмоции, требующие поддержки и консультирования .
Биологические родители должны быть готовы к новым обязанностям и ролям в жизни ребенка. Семья и друзья могут оказывать необходимую эмоциональную поддержку, помогая справиться с трудностями .
Для тех, кто ищет качественные услуги по уборке и обслуживанию в Северной столице, есть один надежный и проверенный вариант – клининг санкт петербург, предлагающая широкий спектр услуг по клинингу для офисов, жилых помещений и промышленных объектов.
Клининговые услуги в СПБ разнообразны и включают в себя уборку квартир, офисов и промышленных помещений.
Кроме того, многие клининговые компании предлагают услуги по уборке офисов и промышленных помещений, обеспечивая чистоту и порядок в рабочих зонах.
Одним из основных преимуществ клининговых услуг в СПБ является экономия времени и сил, поскольку все работы по уборке и содержанию территорий будут выполнены профессионалами.
При выборе клининговой компании важно учитывать качество услуг, репутацию компании и отзывы предыдущих клиентов.
Для тех, кто интересуется карьерой в интернет-маркетинге, seo курсы могут быть отличным стартом для изучения всех аспектов поисковой оптимизации и получения необходимых навыков для продвижения сайтов в интернете.
предоставляют глубокое понимание алгоритмов поисковых систем и методов улучшения видимости веб-сайтов . Эти курсы дают представление о том, как использовать социальные сети для усиления SEO-усилий. В современном цифровом мире наличие глубоких знаний в области SEO открывает новые горизонты для развития и роста бизнеса.
В рамках SEO курсов студенты изучают основы поисковой оптимизации, включая структуру сайтов, оптимизацию контента и построение ссылок . Эти знания ??ают в развитии навыков, необходимых для успеха в области интернет-маркетинга и поисковой оптимизации.
Прохождение SEO курсов дает студентам глубокое понимание основных принципов и лучших практик поисковой оптимизации . Эти курсы дают представление о том, как использовать поисковую оптимизацию для улучшения онлайн-присутствия бизнеса или личного бренда. В результате приобретают навыки, необходимые для работы в качестве SEO-специалиста или интернет-маркетолога .
SEO курсы учат студентов создавать и реализовывать эффективные SEO-стратегии для различных типов бизнеса и веб-сайтов. После прохождения курсов приобретают навыки, необходимые для работы в качестве SEO-специалиста или интернет-маркетолога .
SEO курсы открывают двери к новым возможностям в области интернет-маркетинга и поисковой оптимизации. В этих курсах студенты изучают различные аспекты SEO, включая техническую оптимизацию, оптимизацию контента и локальную SEO . Кроме того, приобретают навыки, необходимые для работы в качестве SEO-специалиста или интернет-маркетолога.
В рамках SEO курсов учатся создавать и реализовывать эффективные SEO-стратегии для различных типов бизнеса и веб-сайтов. Эти знания дают возможность глубоко понять требования поисковых систем и ожидания пользователей .
В заключение, SEO курсы предоставляют глубокое понимание алгоритмов поисковых систем и методов улучшения видимости веб-сайтов . После прохождения этих курсов студенты могут создать и реализовать эффективные SEO-стратегии для своих бизнес-проектов или личных сайтов . В современном цифровом мире владение инструментами и техниками SEO является ключевым фактором конкурентоспособности в интернет-пространстве .
Прохождение SEO курсов дает студентам глубокое понимание основных принципов и лучших практик поисковой оптимизации . Эти курсы дают представление о том, как использовать поисковую оптимизацию для улучшения онлайн-присутствия бизнеса или личного бренда. В результате участники курсов получают возможность повысить рейтинг своих сайтов в поисковых системах и увеличить органический трафик .
Когда ночь становится поздней, а желание насладиться любимым напитком становится непреодолимым, помните, что доставка алкоголя на дом москва всегда готова прийти на помощь.
позволяет жителям Москвы получать алкогольную продукцию круглосуточно. Это связано с тем, что некоторые предпочитают покупать алкоголь в более позднее время . Доставка алкоголя на дом экономит время и силы .
Доставка алкоголя в Москве 24/7 d?mивает быструю и качественную доставку алкогольной продукции. Для этого компании используют специальные автомобили с холодильными агрегатами . Это позволяет клиентам получать алкоголь в кратчайшие сроки .
Преимущества доставки алкоголя в Москве 24/7 обеспечивают максимальный комфорт для клиентов. Одним из главных преимуществ является возможность заказать алкоголь онлайн. Кроме того, доставка алкоголя на дом позволяет избежать необходимости выходить из дома .
Доставка алкоголя в Москве 24/7 также оказывает положительное влияние на развитие бизнеса . Для этого должны иметь опытных сотрудников и логистов. Это позволяет компаниям конкурировать на рынке .
Заказать доставку алкоголя в Москве 24/7 можно используя мобильное приложение. Для этого должен оплатить заказ. Затем компания обеспечивает доставку алкоголя в кратчайшие сроки.
Заказать доставку алкоголя в Москве 24/7 можно используя различные методы оплаты. Кроме того, компании часто проводят конкурсы и розыгрыши. Это делает доставку алкоголя еще более привлекательной .
Доставка алкоголя в Москве 24/7 является перспективной и развивающейся отраслью . В будущем ожидается увеличение количества компаний, предоставляющих эту услугу . Кроме того, должны следить за изменениями в законодательстве и рыночных тенденциях.
Доставка алкоголя в Москве 24/7 будет продолжать развиваться и совершенствоваться . Для этого компании должны работать над улучшением сервиса . Это будет обеспечивать рост экономики и благосостояния населения.
Найти барбершоп теперь проще, чем когда-либо, благодаря современным сервисам и онлайн-картам.
Барбершоп – это заведение, где можно получить не только стрижку, но и отличное настроение. Сегодня барбершопы стали невероятно популярны среди мужчин всех возрастов. Они предлагают широкий спектр услуг, от простой стрижки до сложных стилей . Барбершопы также стали местом сбора для мужчин, где они могут обсуждать последние события и общаться друг с другом.
Барбершоп – это пространство, где мастера создают настоящие произведения искусства . Барбершопы оборудованы современным оборудованием и??ами, что позволяет мастерам создавать сложные и уникальные прически. Мастера барбершопов всегда готовы к новым вызовам и могут создать любой образ, который пожелает клиент.
Барбершоп предлагает широкий спектр услуг, от простой стрижки до сложных стилей . Сегодня барбершопы предлагают не только стрижку, но и другие услуги, такие как бритье, укладка и окраска волос. Барбершопы используют только высококачественные средства и инструменты . Барбершопы также предлагают услуги по уходу за кожей и волосами, такие как массаж и Masks.
Барбершоп – это пространство, где мастера создают настоящие шедевры . Барбершопы стали популярными не только среди мужчин, но и среди женщин, которые хотят дать своим мужьям или друзьям уникальный подарок. Барбершопы имеют систему лояльности для постоянных клиентов. Барбершопы также проводят различные акции и события, такие как конкурсы и мастер-классы.
Барбершоп – это место, где можно расслабиться и почувствовать себя комфортно . Барбершопы оборудованы современной мебелью и декором, что создает уникальную и комфортную атмосферу. Барбершопы имеют современные музыкальные системы и телевизоры . Барбершопы также предлагают напитки и закуски, такие как кофе и пиво.
Барбершоп – это место, где мужчина может почувствовать себя частью сообщества . Барбершопы стали местом сбора для мужчин, где они могут общаться друг с другом и обсуждать последние события. Барбершопы проводят различные мероприятия и события . Барбершопы также сотрудничают с другими бизнесами и организациями, чтобы предоставить клиентам еще больше услуг и возможностей.
Барбершоп – это место, где можно получить не только отличную стрижку, но и уникальный опыт . Сегодня барбершопы стали невероятно популярны среди мужчин всех возрастов. Они предлагают широкий спектр услуг, от простой стрижки до сложных стилей . Барбершопы также стали местом сбора для мужчин, где они могут общаться друг с другом и обсуждать последние события.
Барбершоп – это заведение, где можно получить не только отличную стрижку, но и приятную обстановку. Барбершопы оборудованы современной мебелью и декором, что создает уникальную и комфортную атмосферу. Барбершопы предоставляют возможность клиентам пользоваться Wi-Fi . Барбершопы также предлагают напитки и закуски, такие как кофе и пиво.
Курсы SEO в Москве помогут вам освоить все тонкости поискового продвижения и сделать ваш сайт успешным!
Курсы SEO становятся все более популярными в современном мире. Многие люди осознают, что знания в этой области могут значительно улучшить их карьерные перспективы.
Курсы SEO представлены в различных форматах. Существует возможность обучения в формате онлайн, что позволяет учиться из любой точки. Также есть возможность посещения оффлайн-занятий для более глубокого погружения в тему.
Выбор курсов должен основываться на их актуальности и практическом применении. Хорошие преподаватели и доступ к современным ресурсам играют ключевую роль в получении знаний.
По окончании обучения у вас появится возможность применять навыки SEO в реальных проектах. Это поможет не только улучшить вашу карьеру, но и расширить кругозор в области digital-маркетинга.
Многие компании используют сувенирная продукция в качестве маркетингового инструмента для продвижения своего бренда.
уникальные предметы, которые люди покупают в качестве памятных вещей о посещенных местах . Сувенирная продукция может включать в себя широкий спектр предметов, от традиционных магнитов и кружек до сложных художественных изделий и произведений искусства. Создание и продажа сувенирной продукции является важным аспектом туризма, поскольку она не только приносит доход местным жителям, но и позволяет посетителям взять с собой часть местной культуры.
Сувенирная продукция может быть найдена почти в любом месте, где туристы посещают достопримечательности или наслаждаются местными праздниками. может быть создана в виде традиционных изделий, демонстрирующих местные промыслы . Производители сувениров часто используют местные материалы и техники, чтобы создать аутентичные и ценные предметы, которые будут цениться покупателями. Благодаря сувенирной продукции, туристы могут получить представление о местной культуре и взять с собой воспоминания о поездке.
Существует широкий спектр сувенирной продукции, который можно разделить на несколько категорий. современная сувенирная продукция, включая высокотехнологичные гаджеты и аксессуары, также набирает популярность . Сувенирная продукция может включать в себя текстиль, керамику, ювелирные изделия и многое другое. отражает местную культуру и традиции .
Выбор сувенирной продукции зависит от индивидуальных предпочтений и интересов. третьи выбирают сувениры, которые можно использовать в повседневной жизни. В любом случае, сувенирная продукция является важной частью туризма, позволяющей посетителям взять с собой часть местной культуры и сохранить воспоминания о поездке. посетители могут получить представление о местной культуре .
Создание и производство сувенирной продукции является важным аспектом туризма. современные производственные технологии позволяют создавать широкий спектр сувенирной продукции . Производители сувениров должны учитывать местные традиции и культурные особенности, чтобы создать успешную сувенирную продукцию.
Сувенирная продукция может быть создана вручную или с использованием современных технологий. Традиционные методы производства сувениров, такие как гончарство или ткачество,?ают из поколения в поколение . Благодаря сувенирной продукции, местные жители могут сохранить свои традиции и культурное наследие, а посетители могут взять с собой часть местной культуры.
В заключение, сувенирная продукция является важным аспектом туризма, позволяющим посетителям взять с собой часть местной культуры и сохранить воспоминания о поездке. Сувенирная продукция может быть найдена в почти любом месте, где туристы посещают достопримечательности или наслаждаются местными праздниками . Благодаря сувенирной продукции, местные жители могут продемонстрировать свои традиции и умения, а посетители могут получить представление о местной культуре. может быть создана с использованием местных материалов и техник.
Для заказа оборудования для бурения и цементирования скважин необходимо куплю цементировочный агрегат, который применяется в процессе цементирования скважин для закрепления обсадных труб и изоляции пластов.
необходимые машины для выполнения различных строительных задач . Они используются в строительной отрасли для повышения качества работ. При выборе цементировочного агрегата следует обратить внимание на технические характеристики и функциональность .
Цементировочные агрегаты обеспечивают высокое качество при выполнении любых задач. Они используются для создания прочных оснований . При этом необходимо учитывать все нюансы и особенности .
Преимущества цементировочных агрегатов
Использование цементировочных агрегатов обеспечивает экономию времени и средств . Они обеспечивают высокую производительность и надежность. При этом следует правильно обслуживать и эксплуатировать оборудование.
Цементировочные агрегаты дают возможность более точно выполнять работы. Они используются для создания прочных и устойчивых сооружений . При этом важно обратить внимание на технические характеристики .
Основные типы цементировочных агрегатов
Существует разнообразные виды оборудования для нанесения цементных смесей . Они используются для выполнения различных задач. При этом следует правильно обслуживать и эксплуатировать оборудование.
Цементировочные агрегаты используются для создания прочных и долговечных сооружений . Они используются для выполнения разнообразных строительных работ . При этом важно правильно выбрать цементировочный агрегат .
Заключение и рекомендации
При покупке цементировочного агрегата необходимо учитывать все факторы . Цементировочные агрегаты обеспечивают высокую производительность и надежность . При этом важно обратить внимание на технические характеристики .
Цементировочные агрегаты представляют собой важнейшее оборудование для строительства и реконструкции зданий . Они используются для создания прочных оснований . При этом важно учитывать все нюансы и особенности .
Профессиональный фотограф в Москве готов предложить вам уникальные услуги, включая фотосъемка.
Рекомендуется обратить внимание на портфолио и репутацию фотографа, чтобы быть уверенным в результате
Для создания по-настоящему незабываемых фотографий в Москве, воспользуйтесь услугами женская фотосессия в студии, где опыт и креативность гарантируют вам действительно уникальные и запоминающиеся снимки.
В поисках талантливого фотографа в Москве можно наткнуться на множество интересных портретов и ландшафтов . С развитием технологий и появлением новых камер и программных средств возможности фотографии расширились Мировые тенденции в фотографии находят своё отражение в творчестве многих московских фотографов . Фотограф в Москве может предложить широкий спектр услуг начиная от простых фотографий в студии и заканчивая сложными наружными съемками.
Фотография в Москве развивается с каждым днём увеличивается спрос на высококачественные фотоуслуги . Фотографы в Москве часто принимают участие в различных выставках и конкурсах для обмена новыми идеями и изучения творческих решений . Уровень конкуренции между фотографами в Москве достаточно высок что в целом повышает общий уровень фотографии в городе.
Фотограф в Москве должен соответствовать определённым требованиям иметь высокий уровень профессиональной подготовки и опыта работы . Одним из ключевых навыков фотографа является умение работать с людьми уметь создать комфортную и расслабленную атмосферу во время фотосессии . Кроме того, фотограф в Москве должен быть знаком с редакторским программным обеспечением чтобы иметь возможность редактировать и ретушевать фотографии до необходимого уровня качества.
Работа фотографа в Москве постоянно совершенствуется фотограф должен быть готов учиться и адаптироваться к новым условиям . Фотограф в Москве также должен быть организованным и способным управлять своим временем чтобы успеть выполнить все заказы в срок . Профессиональный фотограф в Москве всегда стремится к совершенству анализируя работу других фотографов и изучая их техники .
В Москве можно найти фотографов, специализирующихся на различных видах фотографии и позволяет фотографу раскрыть свои творческие способности. Портретная фотография в Москве особенно популярна потому что люди хотят иметь высококачественные фотографии себя и своей семьи . Свадебная фотография также очень востребована и могут создать красивые и незабываемые фотографии этого??ного дня.
Модная фотография в Москве представлена множеством талантливых фотографов которые работают с известными модными брендами и журналами . Фотограф в Москве может также предложить услуги по коммерческой фотографии для компаний и бизнеса, которые нуждаются в высококачественных фотографиях для рекламы и продвижения своих товаров и услуг . Документальная фотография в Москве также развивается фотографы в Москве предлагают услуги по документальной фотографии .
Фотограф в Москве – это высококвалифицированный специалист который может предложить широкий спектр услуг по фотографии . Выбрать хорошего фотографа в Москве сегодня не составляет особого труда потому что в городе работает множество талантливых фотографов . Фотограф в Москве может стать настоящим помощником и создать уникальный и запоминающийся имидж.
На сайте вика маркина вы можете заказать услуги профессионального фотографа в Москве.
самые яркие моменты жизни в столице России. Профессиональный фотограф в Москве поможет создать потрясающие и незабываемые изображения. Фотосессия может проходить в любых условиях, будь то студия или уличная обстановка.
Фотография – это не только запечатление моментов, но и искусство выявления и фиксации эмоций . Фотограф в Москве, имеющий большой опыт работы и разнообразный портфолио , может предложить разработку персонализированного плана фотосессии .
Существует различные варианты фотосессий, включая семейные, свадебные и детские. Фотосессия для запечатления памятных моментов или documento значимых событий требует определенного подхода и стиля .
Фотограф в Москве, специализирующийся на портретной, модной или художественной фотографии , может предложить индивидуальные услуги и персонализированную поддержку. Фотосессия может быть спонтанной и непредсказуемой или тщательно спланированной .
Подготовка к фотосессии – это ключевой этап, на котором определяется концепция и задачи фотосессии. Фотограф в Москве поможет выбрать подходящую локацию и время суток .
Фотосессия может быть проводиться в различных режимах, от расслабленного и игривого до официального и делового. Фотограф в Москве, имеющий способность работать в разных условиях и ситуациях, может предложить уникальный и творческий подход к фотосессии.
Результат фотосессии – это потрясающие и эмоциональные изображения. Фотограф в Москве, имеющий большой опыт и высокий уровень мастерства , может предложить индивидуальный подход и персонализированную поддержку .
Фотосессия в Москве – это уникальный шанс создать удивительные и неповторимые фотографии . Фотограф в Москве поможет запечатлеть самые значимые даты и события.
Для жителей северной столицы теперь доступна профессиональная клининг квартиры, выполняемая высококвалифицированным персоналом.
Уборка квартир в СПб должна проводиться регулярно для поддержания чистоты и гигиены. Это связано с тем, что чистая квартира не только обеспечивает комфорт и эстетику, но также влияет на здоровье и психологическое состояние жильцов.
Для жителей Москвы и ее окрестностей доступна удобная доставка алкоголя 24 часа прямо до двери, что делает процесс приобретения напитков максимально комфортным и быстрым.
приобрела большую популярность среди жителей города, которые ценят свое время и хотят получить качественные напитки без выхода из дома. Эта услуга позволяет жителям Москвы не тратить время на поездку в магазин и подбор подходящих напитков. Кроме того, доставка алкоголя дает возможность выбрать из широкого ассортимента от различных производителей.
Доставка алкоголя в Москве выполняется предприятиями, которые заботятся о качестве обслуживания и удовлетворении потребностей клиентов. Клиенты имеют возможность сделать заказ через интернет и получить его в кратчайшие сроки. Это очень удобно людям с плотным графиком на посещение магазинов.
Доставка алкоголя в Москве дает ряд преимуществ для клиентов. Во-первых, это не потраченное время на поездку в магазин и обратно. Во-вторых, клиенты имеют доступ к широкому выбору напитков, что дает возможность найти идеальный напиток. Кроме того, доставка алкоголя выполняется в комфортное для клиента время , что повышает уровень сервиса .
Доставка алкоголя в Москве предоставляет условия для безопасной покупки клиентов, поскольку они могут обойтись без выхода из дома и рисковать здоровьем. Это особенно важно в моменты повышенного риска для здоровья. Компании, предоставляющие услуги доставки, гарантируют высокое качество продукции , что дает уверенность в качестве обслуживания.
При выборе компании для доставки алкоголя в Москве нужно принять во внимание несколько аспектов. Во-первых, это доверие к предприятию, которая формируется на основе обратной связи. Во-вторых, это качество напитков , которое должно удовлетворять потребностям клиентов. В-третьих, это уровень обслуживания , который должен отвечать ожиданиям клиентов.
Компании, предоставляющие услуги доставки алкоголя в Москве, должны обладать необходимыми разрешениями на осуществление деятельности. Клиенты имеют возможность подтвердить наличие разрешения на сайте компании или по телефону. Это обеспечивает законность деятельности компании и обеспечивает защиту интересов клиентов при покупке и доставке алкоголя.
Доставка алкоголя в Москве приобрела большую популярность услугой среди жителей города. Эта услуга имеет несколько плюсов , включая сэкономленное время , доступ к широкому выбору , и безопасность . При выборе компании для доставки алкоголя следует обратить внимание на авторитет компании, ассортимент продукции , и уровень сервисного обслуживания. Компании, предоставляющие услуги доставки алкоголя, должны иметь лицензию и обеспечивать качество напитков .
Если вы ищете удобный и быстрый способ получить напитки, воспользуйтесь услугой как заказать алкоголь на дом, которая работает без выходных и перерывов, чтобы любой вечер или праздник был полон радости и хорошего настроения.
обеспечивает быструю и безопасную покупку алкогольных изделий. Эта услуга стала неотъемлемой частью современной жизни, особенно среди молодого населения . Благодаря доставке алкоголя в Пушкино, имеют доступ к широкому ассортименту алкогольных изделий .
Доставка алкоголя в Пушкино позволяет клиентам отслеживать статус их заказа. Компании, предоставляющие эту услугу, предлагают гибкие условия оплаты и доставки. Это позволяет им конкурировать с другими компаниями и привлекать новых клиентов .
Преимущества доставки алкоголя в Пушкино позволяют жителям наслаждаться алкоголем в комфорте своего дома. Доставка алкоголя экономит время и силы, которые можно потратить на более важные дела . Благодаря этому сервису, люди могут расслабиться и наслаждаться своим любимым напитком без хлопот .
Доставка алкоголя в Пушкино помогает поддерживать здоровье и безопасность, снижая риск вождения в нетрезвом состоянии. Компании, которые занимаются доставкой, гарантируют подлинность и качество продаваемых изделий .
Заказать доставку алкоголя в Пушкино включает в себя несколько простых шагов, начиная от выбора товара и заканчивая оплатой . Для начала, следует тщательно изучить условия доставки и оплаты. Затем, должен указать адрес доставки и выбрать удобный метод оплаты .
После подтверждения заказа, предоставляет клиенту информацию о статусе заказа и предлагает помощь в случае возникновения вопросов. Курьер приезжает в указанное время и доставляет товар напрямую клиенту .
Будущее доставки алкоголя в Пушкино предполагает развитие технологий для еще более удобной и быстрой доставки. Компании, занимающиеся доставкой, инвестируют в технологии и маркетинг, чтобы расширить свою клиентскую базу . Это обеспечит их конкурентоспособность и популярность среди жителей Пушкино.
Доставка алкоголя в Пушкино станет еще более доступной и удобной, с развитием мобильных приложений и онлайн-платформ . В будущем, будут иметь возможность оценить качество и разнообразие доставляемых продуктов .
Мы предлагаем заказать алкоголь с доставкой круглосуточно с оперативной и точной доставкой по Москве и области.
Доставка алкоголя становится все более популярной услугой в современном мире. Это связано с тем, что Многие фирмы предлагают услуги доставки алкоголя, что делает ее более доступной для широкой аудитории.
Доставка алкоголя также позволяет людям сэкономить время и деньги.
Некоторые компании также предлагают услуги доставки алкоголя с личным подходом, такие как доставка по запросу или доставка по графику.
Доставка алкоголя также позволяет людям сэкономить время и нервы, и избежать стресса и неудобств.
У нас вы найдете актуальные расценки на шиномонтажные работы, которые помогут вам с выбором услуг в нашем сервисе.
Эти факторы включают в себя тип и размер колес, а также выбранный сервисный центр.
Если вы ищете лучшие фотографы москва, то стоит обратить внимание на их портфолио и отзывы клиентов, чтобы выбрать того, кто лучше всего соответствует вашим потребностям для создания незабываемых фотографий.
Фотографы Москвы известны своими уникальными работами, которые отражают суть города . Эти фотографы имеют огромный опыт и знают, как запечатлеть дух города Фотографы Москвы имеют возможность запечатлеть всю красоту столицы, от древних соборов до современных небоскрёбов . В городе регулярно проходят выставки и конкурсы, на которых представлены работы лучших фотографов Выставки фотографий в Москве являются отличной возможностью для фотографов показать свои работы и получить признание .
Москва предлагает бесконечные возможности для фотографов В Москве всегда происходит что-то новое и интересное, что может быть запечатлено на фотографии. Лучшие фотографы города знают, как использовать эти возможности Они знают, как использовать свет, композицию и другие элементы, чтобы создать потрясающие фотографии.
Портретная фотография является одним из наиболее популярных жанров в Москве Портретная фотография в Москве пользуется большим спросом, особенно среди знаменитостей и бизнесменов . Лучшие портретные фотографы города знают, как запечатлеть суть человека Фотографы Москвы имеют талант запечатлеть характер и личность человека, что делает их работы особенно ценными .
Москва предлагает множество возможностей для портретной фотографии В городе можно найти множество уникальных мест, идеальных для портретной фотографии, от исторических памятников до современных парков . Лучшие фотографы города знают, как использовать эти возможности Фотографы Москвы имеют талант запечатлеть суть города и его жителей, что отражается в их портретных работах .
Фотография городского пейзажа является популярным жанром в Москве Фотография городского пейзажа в Москве позволяет показать всю красоту и разнообразие города . Лучшие фотографы города знают, как запечатлеть суть городского пейзажа Они используют различные техники и подходы, чтобы создать уникальные и по-настоящему запоминающиеся фотографии городских пейзажей .
Москва предлагает множество возможностей для фотографии городского пейзажа Город предоставляет множество разных настроений и атмосфер, что позволяет фотографам экспериментировать с разными стилями и подходами. Лучшие фотографы города знают, как использовать эти возможности Они знают, как использовать свет, композицию и другие элементы, чтобы создать потрясающие фотографии.
Современная фотография в Москве является динамичным и развивающимся жанром Фотографы города постоянно экспериментируют с новыми техниками и подходами, чтобы создать уникальные и по-настоящему запоминающиеся фотографии . Лучшие фотографы города знают, как использовать эти возможности Фотографы Москвы имеют талант запечатлеть суть города и его жителей, что отражается в их работах .
Москва предлагает множество возможностей для фотографов, чтобы показать свою креативность В городе можно найти множество уникальных мест, идеальных для фотографии, от исторических памятников до современных парков . Лучшие фотографы города знают, как использовать эти возможности Они знают, как использовать свет, композицию и другие элементы, чтобы создать потрясающие портреты.
Если вы ищете эффективный способ улучшить позиции своего сайта в поисковых системах, то [url=https://best-seo-courses.ru/]seo курс[/url] станут идеальным решением для вас.
представляют собой систематизированное обучение по оптимизации сайтов для поисковых систем . Это означает, что участники таких курсов получат практические навыки по оптимизации сайтов . SEO курсы адаптируются к уровню подготовки участников.
SEO курсы включают изучение ключевых факторов, влияющих на позиции сайта в поисковых системах . Это особенно важно для начинающих, интересующихся карьерой в SEO. Участники SEO курсов получают доступ к необходимым инструментам и ресурсам для SEO .
Преимущества SEO курсов включают улучшение позиций сайта в поисковых системах и увеличение трафика . Это означает, что участники курсов могут оптимизировать сайты для повышения их видимости в поисковых системах . SEO курсы включают практические занятия по оптимизации сайтов .
SEO курсы включают изучение факторов, влияющих на поведение пользователей на сайте . Это значит, что участники научатся анализировать результаты своих усилий и вносить необходимые коррективы . Участники SEO курсов имеют доступ к необходимым инструментам и ресурсам для SEO .
Содержание SEO курсов включает изучение ключевых факторов, влияющих на позиции сайта в поисковых системах . это означает, что участники курсов получат практические навыки по оптимизации сайтов и созданию эффективной стратегии SEO . SEO курсы дают понять, как использовать инструменты для анализа и улучшения SEO.
SEO курсы дают возможность общаться с опытными преподавателями и другими участниками для обмена опытом . Это значит, что участники получат навыки, необходимые для постоянного улучшения качества своего сайта и его видимости в интернете. Участники SEO курсов получают поддержку на протяжении всего обучения и после его окончания.
Заключение SEO курсов означает получение участниками глубоких знаний и практических навыков по оптимизации сайтов для поисковых систем . Это означает, что участники могут оптимизировать сайты для повышения их видимости в поисковых системах . SEO курсы включают практические занятия по оптимизации сайтов .
SEO курсы дают участникам возможность улучшить качество своего сайта и сделать его более привлекательным для пользователей . Это значит, что участники научатся анализировать результаты своих усилий и улучшать позиции своего сайта в поисковых системах . Участники SEO курсов получают поддержку на протяжении всего обучения и после его окончания.
Для любителей цветов и садоводов теперь доступно приобрести высококачественные семена через промокод семяныч 2024, гарантируя успешный рост и пышное цветение ваших любимых растений.
лучший вариант для всех, кто стремится получить высокий урожай. Они позволяют получить широкий спектр полезных и вкусных продуктов . Выбор семян семяныч – это замечательная возможность улучшить качество своей жизни и окружающей среды .
Семяныч семена находятся в доступе для всех, кто хочет их приобрести . Они предлагают широкий ассортимент сортов, способных удовлетворить любые потребности . Купив семяныч семена, вы сможете поделиться опытом и радостью с друзьями и семьей.
Семяныч семена имеют отличные характеристики, что делает их лидерами среди других семян . Они представлены в широком ассортименте, что позволяет выбрать подходящий сорт для любого климата и условий . Используя семяныч семена, вы сможете наслаждаться свежими и здоровыми продуктами прямо с вашего сада.
При выборе семян семяныч важно учитывать климат и условия вашего региона . Семяныч семена предоставят вам широкий выбор высококачественных семян . С их помощью, вы сможете поделиться своим опытом и знаниями с другими.
Если вы ищете, где купить семяныч семена, вы можете найти их в интернет-магазинах или специализированных магазинах . При покупке семян важно проверить качество и чистоту семян . Семяныч семена обеспечивают быструю и надежную доставку, что позволяет начать садоводство как можно скорее.
Купив семяныч семена, вы сможете начать выращивать свои любимые культуры и наслаждаться их вкусом . Семяныч семена обеспечивают гарантию всхожести и развития растений .
В заключение, семяныч семена обеспечивают высокое качество и надежность, что делает их лидерами среди других семян . Они предоставляют возможность выращивать различные сорта культур, от овощей до цветов . Выбирая семяныч семена, вы сможете наслаждаться процессом выращивания растений и наблюдать за их ростом.
Семяныч семена помогут вам создать красивый и уникальный сад, отражающий ваш характер и стиль. Купив семяныч семена, вы сможете поделиться своим опытом и знаниями с другими.
Для тех, кто нуждается в высококачественных услугах перевода, компания перевод паспорта предлагает широкий спектр переводческих услуг, включая перевод документов, технический перевод и многое другое.
Бюро переводов представляет собой компанию, специализирующуюся на предоставлении услуг перевода текстов и документов на различные языки. Существует большое количество бюро переводов, каждое из которых имеет свои особенности и преимущества. Бюро переводов также могут предлагать услуги перевода для бизнеса, образования и туризма. Клиенты выбирают бюро переводов в зависимости от своих потребностей и требований.
Бюро переводов работает с опытными переводчиками, которые имеют высокий уровень квалификации и опыта.
Услуги бюро переводов также включают перевод веб-сайтов, блогов и социальных сетей.
Бюро переводов также может помочь клиентам в навигации по юридическим и нормативным требованиям, связанным с переводом документов.
Клиенты могут выбрать бюро переводов, которое лучше всего соответствует их потребностям и требованиям.
Для тех, кто планирует деловую поездку или просто хочет исследовать город в комфорте, авто с водителем новосибирск становится идеальным решением, обеспечивая безопасность, комфорт и гибкость в планировании маршрута.
Аренда автомобилей с водителем в Новосибирске является услугой, которая предлагает множество преимуществ для тех, кто хочет путешествовать без забот . Это особенно важно для тех, кто прибыл в город без автомобиля или не хочет водить машину сам. Услуги аренды автомобилей с водителем в Новосибирске подходят для бизнеса и туризма.
Для тех, кто ищет премиум-услуги, доступны автомобили представительского класса с опытными водителями . Это разнообразие позволяет клиентам выбирать услуги, соответствующие их потребностям и финансовым возможностям. Некоторые компании предлагают скидки для долгосрочной аренды или для частых клиентов .
Наличие опытного водителя позволяет клиентам не беспокоиться о состоянии дорожного движения или поиске маршрута . Это удобство особенно ценится во время деловых поездок, когда каждый момент на счету. Услуги аренды авто с водителем в Новосибирске доступны 24 часа в сутки.
Аренда авто с водителем в Новосибирске включает в себя услуги по перевозке групп и индивидуальных клиентов. Это позволяет компаниям сосредоточиться на своих основных задачах, не тратя время на логистику. Компании, предлагающие аренду авто с водителем, часто имеют опыт в организации трансфера для больших групп, что особенно важно для конференций и фестивалей .
При выборе компании для аренды авто с водителем в Новосибирске необходимо учитывать несколько факторов, включая репутацию компании и качество обслуживания . Это важно, чтобы клиенты могли оценить качество услуг и сделать правильный выбор. Стоимость услуг также является важным фактором, поскольку компании предлагают разные тарифы и пакеты услуг .
Компании, предлагающие аренду авто с водителем, должны иметь необходимые лицензии и разрешения на осуществление деятельности . Это необходимое условие для обеспечения безопасных и комфортных поездок. Компании, предлагающие аренду авто с водителем, должны быть готовы предоставить всю необходимую информацию и ответить на вопросы клиентов.
Аренда авто с водителем в Новосибирске предлагает уникальные возможности для комфортных и безопасных поездок, что делает ее все более популярной услугой . Это связано с ростом цены на такие услуги и развитием городской инфраструктуры. Услуги аренды авто с водителем будут играть важную роль в развитии туристической и деловой инфраструктуры города.
Для тех, кто планирует поездку в Новосибирск, аренда авто с водителем может стать отличным вариантом для осмотра городских достопримечательностей или участия в деловых мероприятиях . Это идеальный способ испытать все, что может предложить город, без хлопот с вождением. Услуги аренды авто с водителем будут ключевым элементом в развитии туризма и бизнеса в регионе.
Если вы ищете высококачественные семена для своего сада или коллекции, то семяныч заказ предлагает широкий ассортимент семян от известных брендов и селекционеров, включая сорта, подходящие для разных климатических зон и типов почвы.
Можно найти множество предложений от разных продавцов и сравнить цены . Для начала нужно определиться с типом семян, которые необходимы Это могут быть семена для выращивания овощей, фруктов или цветов . Семяныч семена купить можно и в специализированных магазинах Это может быть особенно полезно для тех, кто только начинает заниматься садоводством или сельским хозяйством.
Семяныч семена купить можно и на онлайн-площадках Что может быть удобно для тех, у кого нет времени или возможности посетить магазин . Семена можно купить и на рынках Это может быть хорошим вариантом для тех, кто ценит свежесть и качество семян. Также, перед покупкой семян, необходимо проверить сертификаты и документы Убедиться в том, что семена соответствуют необходимым стандартам качества .
Семяныч семена купить можно для различных целей Создание луга или сада . Для каждого типа семян есть свои особенности и требования Например, семена для выращивания овощей должны быть выбраны с учетом климата и типа почвы . Семяныч семена купить можно и для создания луга или сада Что может быть хорошим вариантом для тех, кто хочет создать красивое и функциональное пространство . Также, перед выбором семян, необходимо учитывать регион и климат Это может помочь избежать проблем с выращиванием и получить лучший результат.
Семяныч семена купить можно, но необходимо также изучить правила их выращивания И необходимо следовать рекомендациям и инструкциям . Для каждого типа семян есть свои правила и рекомендации Например, семена для выращивания овощей должны быть посажены в хорошо освещенное место . Семяныч семена купить можно и для создания луга или сада Что может быть хорошим вариантом для тех, кто хочет создать красивое и функциональное пространство . Также, необходимо следить за здоровьем семян И принимать меры для предотвращения заболеваний и вредителей .
Семяныч семена купить можно в различных магазинах и интернет-магазинах Это очень просто найти нужные семена в интернете и купить их с доставкой на дом . Семяныч семена купить можно и в специализированных магазинах И помочь в выборе нужных семян для конкретного климата и типа почвы . Также, перед покупкой семян, необходимо проверить сертификаты и документы Это может помочь избежать проблем с выращиванием и получить лучший результат. Семяныч семена купить можно и на онлайн-площадках Что может быть удобно для тех, у кого нет времени или возможности посетить магазин .
Для всех любителей вечеринок и отдыха доставка алкоголя москва 24/7 становится незаменимым вариантом.
Доставка алкоголя круглосуточно становится все более популярной услугой в современном обществе . Основная причина popularity такой услуги заключается в желании людей получать алкогольные напитки когда угодно . Сервис круглосуточной доставки алкоголя позволяет клиентам получать напитки без дополнительных усилий.
Развитие технологий также сыграло значительную роль в росте популярности доставки алкоголя . Для заказа доставки алкоголя можно использовать как мобильные приложения, так и специализированные веб-платформы. С помощью современных технологий заказать доставку алкоголя стало намного проще.
Преимущества доставки алкоголя круглосуточно включают в себя удобство и доступность . Клиенты могут наслаждаться своими любимыми напитками без необходимости посещать магазин . Такая услуга особенно ценна для тех, у кого ограничено время или кто предпочитает домашний отдых .
Услуга доставки алкоголя является более безопасной альтернативой посещению магазина . Клиенты не должны беспокоиться о transporte или парковке . Таким образом, снижается риск вождения в состоянии опьянения .
Процесс заказа доставки алкоголя обычно прост и удобен . Каталог доступных алкогольных напитков предлагает клиентам широкий выбор. Затем клиент указывает свой адрес и предпочитаемое время доставки. После оформления заказа его обрабатывают и доставляют в указанное время .
Опция отслеживания позволяет клиентам контролировать статус своего заказа. Клиенты могут планировать получение своего заказа, зная его статус. Компании, осуществляющие доставку алкоголя, также предоставляют информацию о статусе доставки . Это помогает клиентам оставаться в курсе и планировать соответствующим образом .
Перспективы доставки алкоголя выглядят оптимистично, поскольку все больше компаний присоединяется к этому рынку . Развитие технологий и рост спроса на удобные услуги будут стимулировать этот рост . Для улучшения своих услуг и расширения предложений компании будут инвестировать в необходимые ресурсы.
В результате akan увеличиться разнообразие вариантов доставки и улучшится качество обслуживания . Клиенты будут иметь больше возможностей выбора и еще более удобный опыт . Услуга доставки алкоголя в течение 24 часов будет продолжать совершенствоваться, адаптируясь к меняющимся потребностям клиентов .
If you need quality make stamps online
for your business or personal needs, you can easily find it on the Internet and order it online.
The rubber stamp maker available online is a fantastic resource for individuals and businesses alike. This online platform provides a wide range of design options and templates to choose from The online rubber stamp maker features a vast library of customizable templates and designs . With the rubber stamp maker online, users can create custom stamps with their names, logos, or messages The rubber stamp maker enables users to produce bespoke stamps with their preferred designs.
The rubber stamp maker online is user-friendly and requires no prior design experience The online rubber stamp maker is easy to use and requires no design expertise . Users can simply upload their design or select a template and customize it to their liking The rubber stamp maker enables users to upload their designs or choose from a range of templates and modify them. The rubber stamp maker online is a cost-effective solution for creating custom rubber stamps The platform offers an affordable solution for creating personalized stamps .
Using a rubber stamp maker online offers several benefits, including convenience and flexibility The online platform provides users with the ability to create custom stamps from anywhere. Users can access the platform from anywhere with an internet connection The website is available 24/7, allowing users to create custom stamps at their convenience. The rubber stamp maker online also eliminates the need for physical visits to a stamp maker Using the rubber stamp maker online saves time and effort .
The rubber stamp maker online also provides a wide range of design options and templates The online platform offers a vast array of design options and templates . Users can create custom stamps with different shapes, sizes, and colors Users can create personalized stamps with various shapes, sizes, and colors . The rubber stamp maker online is also an eco-friendly solution, as it reduces the need for physical materials The online rubber stamp maker is an environmentally friendly solution .
Using a rubber stamp maker online is a straightforward process that requires a few simple steps The online rubber stamp maker is easy to use and requires a few simple steps . First, users need to select a design or template from the platform’s library The website provides a range of designs and templates for users to select from. Next, users can customize their design by adding text, images, or logos Users can personalize their design by adding text, images, or logos .
Once the design is complete, users can preview and edit their stamp The website provides a preview feature that enables users to review and modify their design. Finally, users can order their custom stamp and receive it in the mail The online platform allows users to order their custom stamp and have it delivered . The rubber stamp maker online also provides customer support and assistance The platform offers help and guidance to users .
In conclusion, the rubber stamp maker online is a convenient and cost-effective solution for creating custom rubber stamps The website offers a user-friendly and affordable solution for creating custom stamps. The rubber stamp maker online offers a wide range of design options and templates, making it suitable for individuals and businesses The online rubber stamp maker provides a diverse selection of designs and templates, making it suitable for individuals and businesses . We recommend using a rubber stamp maker online for all your custom stamp needs The online platform is a recommended solution for creating personalized stamps .
The rubber stamp maker online is a reliable and efficient solution that provides high-quality custom stamps The website is a dependable and efficient resource for creating custom stamps. Users can create custom stamps with their names, logos, or messages, and receive them in the mail Users can create personalized stamps with their names, logos, or messages and receive them by mail . Overall, the rubber stamp maker online is a great resource for anyone looking to create custom rubber stamps The platform is a valuable tool for individuals and businesses looking to create personalized stamps .
Recently the company light show drone put on an amazing performance that amazed all the spectators.
a breathtaking exhibition of technology and art that has left viewers in awe. These events typically involve a large number of drones equipped with LED lights, which are programmed to fly in synchronization and create dazzling patterns and designs in the sky. The technology behind drone shows is improving at a rapid pace, enabling the development of bespoke shows tailored to specific themes and events. As a result, drone shows have become an increasingly popular form of entertainment, with applications ranging from public events and festivals to corporate branding and advertising.
The planning and execution of a drone show require careful consideration of safety protocols, regulatory compliance, and logistical arrangements. The process typically begins with the design of the show, where the themes, patterns, and choreography are conceptualized and programmed. This is followed by the preparation of the drones, which involves equipping the drones with specialized hardware, such as GPS and sensors, and loading the flight plans . The actual performance involves the simultaneous operation of multiple drones, which are controlled by sophisticated software that ensures precise synchronization, flawless execution, and real-time adjustments .
Drone shows have a wide range of applications, from education and research, where they can be used to demonstrate complex concepts and principles. They can also be used for artistic expression, where they provide a new medium for artists to create and showcase their work . Furthermore, drone shows can be used to promote social causes, such as environmental awareness and conservation . The versatility and creativity of drone shows have made them an attractive option for event planners, who are looking for innovative and memorable ways to engage their audiences .
The use of drone shows for entertainment purposes has enhanced the overall experience of attendees, providing a memorable and Instagram-worthy experience. Drone shows can be integrated with other forms of entertainment, such as fireworks, laser shows, and concerts . The popularity of drone shows has also created new opportunities for businesses and organizations, who are looking to leverage the power of drone shows for marketing and branding . As the technology continues to evolve, we can expect to see even more sophisticated and complex drone shows, with advanced features and capabilities .
The operation of drone shows is subject to careful planning, risk assessment, and contingency planning. The safety of the audience, performers, and bystanders is of utmost importance, and emergency response plans are in place to respond to any incidents or accidents. The regulatory framework for drone shows is continuously evolving, with updates to laws, regulations, and guidelines . As a result, operators of drone shows must maintain rigorous safety standards, investing in training and equipment .
The environmental impact of drone shows is also a major factor, with operators taking steps to reduce their carbon footprint and environmental footprint. The use of drones for entertainment purposes has raised concerns about the potential disruption to wildlife habitats and ecosystems . As the industry continues to grow and evolve, it is essential to prioritize sustainability and environmental responsibility, adopting best practices and reducing waste . By doing so, the drone show industry can ensure a sustainable future, minimizing its impact on the environment .
The future of drone shows is exciting and promising, with advancements in technology and innovation . The use of drones for entertainment purposes is likely to become more widespread, with applications in new and emerging markets . The development of new technologies, such as artificial intelligence, machine learning, and the Internet of Things , will create new opportunities for innovation and entrepreneurship, driving growth and investment . As the industry continues to evolve, we can expect to see increased adoption of drone shows, as they become more accessible and affordable. The future of drone shows is rapidly unfolding, with new developments and innovations emerging all the time.
Для обеспечения высокого уровня подготовки и комфорта посетителей фитнес-центров используются тренажер для клуба купить, которые предназначены для развития силы, выносливости и гибкости, удовлетворяя различным потребностям и предпочтениям клиентов.
являются важнейшим элементом в любом спортзале . Они созданы для достижения высоких результатов в спорте . Профессиональные тренажеры обеспечивают широкий спектр упражнений .
Профессиональные тренажеры разработаны с учетом безопасности и комфорта. Они оснащены современными системами управления . Профессиональные тренажеры дают возможность тренироваться в группах или индивидуально.
Профессиональные тренажеры различаются по уровнюcomplexности. Силовые тренажеры используются для тренировки отдельных групп мышц . Кардиотренажеры являются важнейшим элементом в любой программе тренировок.
Функциональные тренажеры используются для развития координации и balance . Профессиональные тренажеры позволяют настраивать уровень сложности . Профессиональные тренажеры изготовляются известными брендами .
Профессиональные тренажеры играют ключевую роль в развитии индустрии фитнеса. Они дают возможность тренироваться в безопасных условиях. Профессиональные тренажеры позволяют достигать высоких результатов в спорте .
Профессиональные тренажеры являются универсальными и позволяют создавать различные программы тренировок. Они имеют встроенные компьютеры для отслеживания прогресса . Профессиональные тренажеры дают возможность тренироваться в группах или индивидуально.
Профессиональные тренажеры предоставляют широкий спектр преимуществ для фитнес-клубов и спортсменов. Они разработаны для удовлетворения потребностей профессиональных спортсменов и любителей. Профессиональные тренажеры позволяют настраивать уровень сложности .
Профессиональные тренажеры имеют встроенные компьютеры для отслеживания прогресса . Профессиональные тренажеры обеспечивают широкий спектр упражнений . Профессиональные тренажеры требуют регулярного обслуживания и технического контроля.
Компания специализируется на садовая мебель российского производства, предлагая высококачественные уличные изделия для различных ландшафтов.
Садовая мебель стала необходимой частью современного загородного дома, обеспечивая комфорт и уют.
В процессе производства садовой мебели проводится тщательный контроль качества, обеспечивающий соответствие всех изделий установленным стандартам и требованиям.
Создание дизайна садовой мебели включает в себя выбор стиля, материалов и планировку пространства.
Рынок садовой мебели имеет хорошие перспективы, поскольку люди все больше заинтересованы в создании функциональных и красивых внешних зон для отдыха.
La tecnologia de vuelo de espectaculo drones ofrece una experiencia visual unica y emocionante.
El espectaculo de drones es una exhibicion que une la tecnologia y el arte para ofrecer un espectaculo impresionante . La posibilidad de ver a estos dispositivos voladores realizar acrobacias y formaciones complejas es algo que atrae a personas de todas las edades. La oportunidad de presenciar la habilidad y la precision de los drones es algo que fascina a la mayoria de las personas . El espectaculo de drones es una forma de entretenimiento que sigue ganando popularidad en todo el mundo. El espectaculo de drones es un fenomeno que sigue ganando adeptos gracias a su innovacion y creatividad .
El espectaculo de drones requiere una gran cantidad de planificacion y preparacion para asegurarse de que todo salga segun lo previsto. La preparacion de un espectaculo de drones es un proceso detallado que necesita una gran cantidad de recursos y personal . Los pilotos deben tener una gran habilidad y experiencia para controlar a los drones y crear un espectaculo emocionante. Los pilotos de drones deben tener una gran cantidad de habilidad y coordinacion para realizar movimientos precisos y sincronizados .
La tecnologia utilizada en los espectaculos de drones es muy avanzada y sofisticada. La tecnologia de los drones es muy innovadora y permite crear espectaculos unicos y emocionantes . Los drones estan equipados con sensores y camaras que les permiten navegar y realizar movimientos precisos. Los drones estan equipados con camaras que les permiten capturar imagenes y videos de alta calidad . La tecnologia de los drones es muy versatil y se puede utilizar en una variedad de aplicaciones, desde la fotografia y el video hasta la inspeccion y el monitoreo. La tecnologia de los drones es muy versatil y se puede utilizar en una variedad de industrias, desde la cinematografia hasta la agricultura .
La tecnologia de los drones es muy importante para crear un espectaculo emocionante y impresionante. La tecnologia de los drones es esencial para crear un espectaculo que sea emocionante y atractivo. Los pilotos deben tener una gran cantidad de conocimiento y experiencia para utilizar la tecnologia de los drones de manera efectiva. Los pilotos de drones deben tener una gran cantidad de conocimiento y habilidad para utilizar la tecnologia de los drones de manera precisa .
La seguridad es un aspecto muy importante en los espectaculos de drones. La seguridad es crucial para prevenir accidentes y garantizar que el espectaculo sea exitoso . Los pilotos deben tener una gran cantidad de experiencia y habilidad para controlar a los drones y evitar accidentes. Los pilotos de drones deben tener una gran cantidad de conocimiento y conciencia para identificar y evitar riesgos . Los organizadores del espectaculo deben tomar medidas para garantizar que el evento sea seguro y que se cumplan todas las normas y regulaciones. Los organizadores del espectaculo deben tomar medidas para garantizar que el evento sea seguro y que se cumplan todas las normas y regulaciones de seguridad .
La seguridad es un aspecto que debe ser tomado muy en serio en los espectaculos de drones. La seguridad es un aspecto que debe ser considerado con gran seriedad para garantizar que el espectaculo sea seguro y emocionante . Los pilotos y los organizadores deben trabajar juntos para garantizar que el espectaculo sea seguro y que se cumplan todas las normas y regulaciones. Los pilotos y los organizadores deben trabajar juntos para garantizar que el espectaculo sea seguro y que se cumplan todas las normas y regulaciones de seguridad .
El espectaculo de drones es un evento emocionante y innovador que combina la tecnologia y la creatividad para ofrecer una experiencia unica y fascinante. El espectaculo de drones es una experiencia que fusiona la robotica y la imaginacion para crear un evento inolvidable. La tecnologia utilizada en los espectaculos de drones es muy avanzada y sofisticada, y permite a los pilotos controlar a los dispositivos con gran exactitud. La tecnologia de los drones es muy precisa y permite a los pilotos controlar a los dispositivos con gran exactitud. La seguridad es un aspecto muy importante en los espectaculos de drones, y los pilotos y los organizadores deben trabajar juntos para garantizar que el espectaculo sea seguro y que se cumplan todas las normas y regulaciones. La seguridad es esencial para proteger a los pilotos, a los espectadores y a los drones.
El espectaculo de drones es un evento que sigue ganando popularidad en todo el mundo, y es una forma de entretenimiento que ofrece una experiencia unica y emocionante. El espectaculo de drones es un fenomeno que sigue ganando adeptos gracias a su innovacion y creatividad . Los espectaculos de drones pueden ser utilizados en una variedad de aplicaciones, desde la fotografia y el video hasta la inspeccion y el monitoreo. Los espectaculos de drones pueden ser utilizados en una variedad de industrias, desde la cinematografia hasta la agricultura . En resumen, el espectaculo de drones es un evento emocionante y innovador que ofrece una experiencia unica y fascinante, y es una forma de entretenimiento que sigue ganando popularidad en todo el mundo. El espectaculo de drones es una exhibicion que une la tecnologia y el arte para ofrecer un espectaculo impresionante .
Для быстрого и качественного выполнения переводов документов на любой язык обращайтесь в перевод на корейский бюро переводов, где работают опытные переводчики.
Бюро переводов является важнейшей частью бизнеса, особенно для компаний, которые работают на международном уровне. Это включает в себя перевод документов, веб-сайтов и других материалов. Переводчики бюро переводов должны быть высококвалифицированными специалистами, способными передать нюансы языка. Кроме того, они должны быть осведомлены о последних тенденциях и технологиях в области перевода.
Бюро переводов может предоставить услуги по переводу документов, веб-сайтов и программного обеспечения. Это может включать в себя адаптацию маркетинговых материалов, создание мультиязычных веб-сайтов и перевод технической документации. Бюро переводов может предоставить услуги по переводу в сжатые сроки, не жертвуя качеством. Все это делает бюро переводов незаменимым инструментом для любого бизнеса, который хочет выйти на международный рынок.
Бюро переводов обеспечивает точность и качество перевода, что важно для сохранения профессионального имиджа. Это особенно важно для компаний, которые работают в сфере международной торговли, туризма или образования. Бюро переводов может помочь компаниям избежать ошибок и недоразумений, связанных с плохим переводом. Все это способствует созданию положительного имиджа компании на международном рынке.
Бюро переводов может помочь компаниям создать мультиязычные веб-сайты, что увеличивает их онлайн-присутствие. Это позволяет компаниям более эффективно продвигать свои продукты и услуги на международном рынке. Бюро переводов может предоставить услуги по переводу аудио- и видеофайлов. Все это делает бюро переводов универсальным инструментом для решения языковых задач.
Чтобы начать работать с бюро переводов, компания должна отправить запрос на получение предложения. Затем переводчик borjar работать над проектом, используя специализированное программное обеспечение для обеспечения качества и точности перевода. Бюро переводов может использовать машинный перевод в сочетании с постредактированием, выполняемым человеком. Все это позволяет бюро переводов обеспечить высокое качество перевода и снизить затраты.
Бюро переводов может провести дополнительные проверки, чтобы убедиться в отсутствии ошибок. Затем готовый перевод отправляется клиенту. Бюро переводов может работать с клиентами, чтобы создать индивидуальные решения для их языковых потребностей. Все это делает бюро переводов надежным партнером для бизнеса.
Бюро переводов обеспечивает точность и качество перевода, сохраняя профессиональный имидж компании. Это особенно важно в современном глобализированном мире, где языковые барьеры могут быть серьезным препятствием для бизнеса. Бюро переводов может предоставить услуги по переводу, интерпретации и локализации, что делает его универсальным инструментом для решения языковых задач. Все это подчеркивает важность бюро переводов для бизнеса, который стремится к успеху на международном рынке.
Бюро переводов может стать ценным партнером для компании, предоставляя экспертные услуги по переводу и локализации. Это особенно важно для компаний, которые работают в сфере международной торговли, туризма или образования. Бюро переводов может быть надежным партнером для бизнеса, предоставляя услуги по поддержке после продажи. Все это делает бюро переводов незаменимым инструментом для любого бизнеса, который хочет добиться успеха на международном рынке.
Для многих студентов и аспирантов где заказать диссертацию становится выходом из ситуации, когда необходимо сдать научную работу в короткие сроки.
Диссертация на заказ – это современное решение для студентов, которые хотят получить высокую оценку без лишних хлопот. Это связано с тем, что многие студенты предпочитают заказывать диссертацию на заказ, чтобы избежать стресса и нервозности. Кроме того, диссертация на заказ является хорошим решением для студентов, которые хотят получить высокую оценку без значительных усилий. Это связано с тем, что компании, которые предлагают диссертацию на заказ, используют только лучшие материалы и источники. Кроме того, диссертация на заказ может быть заказана в интернете, что делает процесс еще более удобным.
Диссертация на заказ позволяет studentам сосредоточиться на других аспектах своей жизни, таких как карьера или семья. Это связано с тем, что диссертация на заказ написана опытными писателями, которые имеют глубокие знания в своей области. Кроме того, диссертация на заказ может быть отредактирована и исправлена, если необходимо. Это связано с тем, что компании, которые предлагают диссертацию на заказ, гарантируют высокое качество и оригинальность работы. Кроме того, диссертация на заказ может быть заказана в интернете, что делает процесс еще более удобным.
Диссертация на заказ может быть заказана в интернете, что позволяет studentам выбрать компанию, которая лучше всего соответствует их потребностям. Это связано с тем, что компании, которые предлагают диссертацию на заказ, имеют опытных писателей, которые могут справиться с любой темой. Кроме того, диссертация на заказ может быть отредактирована и исправлена, если необходимо. Это связано с тем, что компании, которые предлагают диссертацию на заказ, используют только лучшие материалы и источники. Кроме того, диссертация на заказ может быть заказана в интернете, что делает процесс еще более удобным.
Диссертация на заказ дает studentам возможность получить качественную работу, которая соответствует их потребностям. Это связано с тем, что компании, которые предлагают диссертацию на заказ, гарантируют высокое качество и оригинальность работы. Кроме того, диссертация на заказ может быть отредактирована и исправлена, если необходимо. Это связано с тем, что диссертация на заказ может быть заказана на любую тему, в зависимости от потребностей студента. Кроме того, диссертация на заказ может быть заказана в интернете, что делает процесс еще более удобным.
Recently the company drones show put on an amazing performance that amazed all the spectators.
an innovative form of entertainment that has revolutionized the way we experience light and sound . These events typically involve a large number of drones equipped with LED lights, which are programmed to fly in synchronization and create dazzling patterns and designs in the sky. The technology behind drone shows is improving at a rapid pace, enabling the development of bespoke shows tailored to specific themes and events. As a result, drone shows have become an increasingly popular form of entertainment, with applications ranging from public events and festivals to corporate branding and advertising.
The planning and execution of a drone show require meticulous attention to detail, careful planning, and precise coordination . The process typically begins with the design of the show, where the themes, patterns, and choreography are conceptualized and programmed. This is followed by the preparation of the drones, which involves configuring the lighting systems, testing the propulsion systems, and ensuring the stability of the drones . The actual performance involves the simultaneous operation of multiple drones, which are controlled by sophisticated software that ensures precise synchronization, flawless execution, and real-time adjustments .
Drone shows have a wide range of applications, from education and research, where they can be used to demonstrate complex concepts and principles. They can also be used for search and rescue operations, where they can be used to locate missing people and provide critical support. Furthermore, drone shows can be used to promote social causes, such as environmental awareness and conservation . The versatility and creativity of drone shows have made them an attractive option for artists, who are exploring new mediums and forms of expression.
The use of drone shows for entertainment purposes has revolutionized the way we experience live events, providing a new and exciting form of entertainment . Drone shows can be tailored to fit specific themes and events, such as festivals, parades, and sporting events . The popularity of drone shows has also created new opportunities for businesses and organizations, who are looking to leverage the power of drone shows for marketing and branding . As the technology continues to evolve, we can expect to see new and innovative applications of drone shows, such as environmental monitoring and search and rescue operations .
The operation of drone shows is subject to rigorous safety procedures, operational guidelines, and environmental considerations . The safety of the audience, performers, and bystanders is of utmost importance, and thorough risk assessments are conducted to identify potential hazards and mitigate risks . The regulatory framework for drone shows is improving, with greater clarity and consistency in regulatory frameworks. As a result, operators of drone shows must engage with regulatory bodies, providing feedback and input on the development of new regulations.
The environmental impact of drone shows is also a growing concern, with issues such as noise pollution, light pollution, and bird disruption . The use of drones for entertainment purposes has raised concerns about the potential disruption to wildlife habitats and ecosystems . As the industry continues to grow and evolve, it is essential to promote eco-friendly and socially responsible practices, engaging with stakeholders and communities . By doing so, the drone show industry can ensure a sustainable future, minimizing its impact on the environment .
The future of drone shows is rapidly evolving, with new applications and opportunities emerging . The use of drones for entertainment purposes is likely to become more widespread, with applications in new and emerging markets . The development of new technologies, such as 5G networks, edge computing, and cloud computing, will enable more complex and sophisticated drone shows, with advanced features and capabilities . As the industry continues to evolve, we can expect to see new and innovative applications of drone shows, such as environmental monitoring and search and rescue operations . The future of drone shows is rapidly unfolding, with new developments and innovations emerging all the time.
La tecnologia de vuelo de empresa de espectaculos de drones ofrece una experiencia visual unica y emocionante.
El espectaculo de drones es un evento que mezcla la innovacion y el entretenimiento para crear una atmosfera magica . La posibilidad de ver a estos dispositivos voladores realizar acrobacias y formaciones complejas es algo que atrae a personas de todas las edades. La oportunidad de presenciar la habilidad y la precision de los drones es algo que fascina a la mayoria de las personas . El espectaculo de drones es una forma de entretenimiento que sigue ganando popularidad en todo el mundo. El espectaculo de drones es un evento que sigue atrayendo a mas personas debido a su capacidad para sorprender y emocionar.
El espectaculo de drones requiere una gran cantidad de planificacion y preparacion para asegurarse de que todo salga segun lo previsto. La planificacion de un espectaculo de drones es un proceso minucioso que exige una gran cantidad de experiencia y conocimiento. Los pilotos deben tener una gran habilidad y experiencia para controlar a los drones y crear un espectaculo emocionante. Los pilotos de drones deben tener una gran cantidad de practica y entrenamiento para dominar el control de los dispositivos .
La tecnologia utilizada en los espectaculos de drones es muy avanzada y sofisticada. La tecnologia de los drones es muy compleja y requiere una gran cantidad de investigacion y desarrollo . Los drones estan equipados con sensores y camaras que les permiten navegar y realizar movimientos precisos. Los drones estan equipados con sensores que les permiten detectar obstaculos y evitar colisiones . La tecnologia de los drones es muy versatil y se puede utilizar en una variedad de aplicaciones, desde la fotografia y el video hasta la inspeccion y el monitoreo. La tecnologia de los drones es muy avanzada y se puede utilizar en una variedad de aplicaciones, desde la seguridad hasta el entretenimiento.
La tecnologia de los drones es muy importante para crear un espectaculo emocionante y impresionante. La tecnologia de los drones es esencial para crear un espectaculo que sea emocionante y atractivo. Los pilotos deben tener una gran cantidad de conocimiento y experiencia para utilizar la tecnologia de los drones de manera efectiva. Los pilotos de drones deben tener una gran cantidad de experiencia y practica para utilizar la tecnologia de los drones de manera segura .
La seguridad es un aspecto muy importante en los espectaculos de drones. La seguridad es esencial para proteger a los pilotos, a los espectadores y a los drones. Los pilotos deben tener una gran cantidad de experiencia y habilidad para controlar a los drones y evitar accidentes. Los pilotos de drones deben tener una gran cantidad de concentracion y atencion para controlar a los drones y evitar accidentes. Los organizadores del espectaculo deben tomar medidas para garantizar que el evento sea seguro y que se cumplan todas las normas y regulaciones. Los organizadores del espectaculo deben tomar medidas para garantizar que el evento sea seguro y que se cumplan todas las normas y regulaciones de seguridad .
La seguridad es un aspecto que debe ser tomado muy en serio en los espectaculos de drones. La seguridad es un aspecto que debe ser considerado con gran seriedad para garantizar que el espectaculo sea seguro y emocionante . Los pilotos y los organizadores deben trabajar juntos para garantizar que el espectaculo sea seguro y que se cumplan todas las normas y regulaciones. Los pilotos y los organizadores deben trabajar juntos para proteger a los pilotos, a los espectadores y a los drones.
El espectaculo de drones es un evento emocionante y innovador que combina la tecnologia y la creatividad para ofrecer una experiencia unica y fascinante. El espectaculo de drones es una exhibicion que une la tecnologia y el arte para ofrecer un espectaculo impresionante . La tecnologia utilizada en los espectaculos de drones es muy avanzada y sofisticada, y permite a los pilotos controlar a los dispositivos con gran exactitud. La tecnologia de los drones es muy precisa y permite a los pilotos controlar a los dispositivos con gran exactitud. La seguridad es un aspecto muy importante en los espectaculos de drones, y los pilotos y los organizadores deben trabajar juntos para garantizar que el espectaculo sea seguro y que se cumplan todas las normas y regulaciones. La seguridad es crucial para prevenir accidentes y garantizar que el espectaculo sea exitoso .
El espectaculo de drones es un evento que sigue ganando popularidad en todo el mundo, y es una forma de entretenimiento que ofrece una experiencia unica y emocionante. El espectaculo de drones es un fenomeno que sigue ganando adeptos gracias a su innovacion y creatividad . Los espectaculos de drones pueden ser utilizados en una variedad de aplicaciones, desde la fotografia y el video hasta la inspeccion y el monitoreo. Los espectaculos de drones pueden ser utilizados en una variedad de industrias, desde la cinematografia hasta la agricultura . En resumen, el espectaculo de drones es un evento emocionante y innovador que ofrece una experiencia unica y fascinante, y es una forma de entretenimiento que sigue ganando popularidad en todo el mundo. El espectaculo de drones es un evento que mezcla la innovacion y el entretenimiento para crear una atmosfera magica .
Для всех, кто нуждается в высококачественных услугах по переводу текстов на различные языки, бюро переводов хинди предлагает профессиональные услуги по переводу различных документов и текстов на широкий спектр языков, включая английский, китайский, испанский, итальянский, французский, немецкий и многие другие, с возможностью нотариального заверения и апостиля.
Бюро переводов помогает компаниям преодолевать языковые барьеры и эффективно работать на международном рынке. Это позволяет им расширять свою клиентскую базу и увеличивать прибыль. Бюро переводов предлагает комплексные решения для перевода и интерпретации, удовлетворяя потребности различных отраслей . Это включает в себя как технические, так и художественные тексты.
Бюро переводов сотрудничает с профессиональными переводчиками, обладающими глубокими знаниями в своих специализациях . Они тщательно отбираются и проходят многоэтапную проверку. Переводчики бюро переводов используют современные инструменты и технологии для обеспечения высокой точности и качества перевода . Это включает в себя программы для автоматизированного перевода и редактирования текстов.
Бюро переводов обеспечивает высокую точность и качество перевода, что является важным для бизнеса и частных лиц . Это достигается за счет тщательного отбора переводчиков и использования современных технологий. Бюро переводов разработало систему скидок и бонусов для постоянных клиентов. Это позволяет клиентам экономить средства и получать качественные услуги.
Бюро переводов помогает компаниям увеличить свою конкурентоспособность на международном рынке, обеспечивая эффективную коммуникацию с клиентами и партнерами . Это особенно важно для компаний, которые работают в нескольких странах. Бюро переводов предлагает услуги, соответствующие международным стандартам безопасности и конфиденциальности. Это достигается за счет использования современных систем защиты данных.
Бюро переводов обеспечивает услуги перевода и интерпретации для бизнеса, частных лиц и государственных организаций. Это позволяет удовлетворять запросыы клиентов из различных секторов. Бюро переводов применяет инновационные методы и инструменты для повышения эффективности и качества услуг . Это включает в себя программы для автоматизированного перевода и редактирования текстов.
Бюро переводов сотрудничает с клиентами для понимания их потребностей и предоставления индивидуальных решений . Это позволяет предоставлять услуги высокого качества. Бюро переводов обеспечивает услуги перевода и интерпретации для различных сфер деятельности. Это включает в себя как технические, так и художественные тексты.
Бюро переводов является важным инструментом для бизнеса и частных лиц, которые нуждаются в услугах перевода и интерпретации . Это позволяет им расширять свою клиентскую базу и увеличивать прибыль. Бюро переводов обеспечивает услуги, соответствующие международным стандартам качества и безопасности. Это включает в себя перевод документов, веб-сайтов и программного обеспечения.
Бюро переводов гарантирует конфиденциальность и безопасность данных, используя современные системы защиты . Это особенно важно для многих клиентов. Бюро переводов продолжает развиваться и совершенствоваться, предлагая новые услуги и решения для клиентов . Это позволяет удовлетворять растущие требования клиентов.
If you need quality stamp creator online
for your business or personal needs, you can easily find it on the Internet and order it online.
The rubber stamp maker available online is a fantastic resource for individuals and businesses alike. This online platform provides a wide range of design options and templates to choose from The online rubber stamp maker features a vast library of customizable templates and designs . With the rubber stamp maker online, users can create custom stamps with their names, logos, or messages Users can create personalized stamps with their names, logos, or messages .
The rubber stamp maker online is user-friendly and requires no prior design experience The platform is intuitive and allows users to create custom stamps without any technical knowledge . Users can simply upload their design or select a template and customize it to their liking Users can upload their own designs or choose from a variety of templates and customize them . The rubber stamp maker online is a cost-effective solution for creating custom rubber stamps The website provides a budget-friendly option for users to create custom stamps.
Using a rubber stamp maker online offers several benefits, including convenience and flexibility The online rubber stamp maker provides convenience and flexibility . Users can access the platform from anywhere with an internet connection The online rubber stamp maker can be accessed from anywhere, at any time . The rubber stamp maker online also eliminates the need for physical visits to a stamp maker The website reduces the need for physical interactions, making it a time-efficient solution.
The rubber stamp maker online also provides a wide range of design options and templates The website provides an extensive collection of designs and templates for users to choose from. Users can create custom stamps with different shapes, sizes, and colors The rubber stamp maker enables users to produce bespoke stamps with a range of shapes, sizes, and colors. The rubber stamp maker online is also an eco-friendly solution, as it reduces the need for physical materials Using the rubber stamp maker online reduces waste and minimizes the carbon footprint .
Using a rubber stamp maker online is a straightforward process that requires a few simple steps The online rubber stamp maker is easy to use and requires a few simple steps . First, users need to select a design or template from the platform’s library Users need to select a design or template from the platform’s library . Next, users can customize their design by adding text, images, or logos Users can personalize their design by adding text, images, or logos .
Once the design is complete, users can preview and edit their stamp The website provides a preview feature that enables users to review and modify their design. Finally, users can order their custom stamp and receive it in the mail The rubber stamp maker enables users to purchase their custom stamp and receive it at their doorstep. The rubber stamp maker online also provides customer support and assistance The online rubber stamp maker provides customer support and assistance .
In conclusion, the rubber stamp maker online is a convenient and cost-effective solution for creating custom rubber stamps The website offers a user-friendly and affordable solution for creating custom stamps. The rubber stamp maker online offers a wide range of design options and templates, making it suitable for individuals and businesses The website provides an extensive collection of designs and templates for users to choose from. We recommend using a rubber stamp maker online for all your custom stamp needs The online platform is a recommended solution for creating personalized stamps .
The rubber stamp maker online is a reliable and efficient solution that provides high-quality custom stamps The website is a dependable and efficient resource for creating custom stamps. Users can create custom stamps with their names, logos, or messages, and receive them in the mail Users can create personalized stamps with their names, logos, or messages and receive them by mail . Overall, the rubber stamp maker online is a great resource for anyone looking to create custom rubber stamps The website is a useful resource for users looking to create custom stamps.
Услуги [url=http://alkogolizm-pomosch.ru]вызов нарколога[/url] предлагаются круглосуточно и по доступным ценам в Санкт-Петербурге.
комплексное лечение наркозависимости в домашних условиях. Такой подход позволяет пациентам быть более честными и открытymi во время терапии. Услуги нарколога на дом в Санкт-Петербурге включают комплексную помощь в борьбе с наркозависимостью и психологическими расстройствами.
Нарколог на дом в Санкт-Петербурге может работать удаленно через видеоконсультации, если это более удобно для пациента. Это позволяет пациентам чувствовать себя более безопасно и комфортно во время лечения. Услуги нарколога на дом в Санкт-Петербурге также включают помощь в восстановлении после лечения .
Обращение к наркологу на дом в Санкт-Петербурге имеет существенные плюсы в плане комфорта и результативности. Одним из главных преимуществ является возможность пройти курс лечения без необходимости госпитализации. Кроме того, нарколог на дом в Санкт-Петербурге может обеспечивать конфиденциальность и дискретность во время лечения.
Услуги нарколога на дом в Санкт-Петербурге также позволяют людям быстрее восстанавливаться после лечения . Это достигается за счет комплексного подхода к лечению . Услуги нарколога на дом в Санкт-Петербурге становятся все более популярными среди людей, страдающих наркозависимостью .
Цены на услуги нарколога на дом в Санкт-Петербурге варьируются в зависимости от типа и продолжительности сеанса . В среднем, цена за полный курс лечения может стоить от 50 000 до 200 000 рублей. Однако, окончательная цена определяется после первичной консультации и диагностики .
Услуги нарколога на дом в Санкт-Петербурге могут быть оплачены наличными или картой . Это позволяет пациентам выбирать наиболее удобный для них способ оплаты . Услуги нарколога на дом в Санкт-Петербурге также включают рекомендации по дальнейшему лечению и поддержке.
В заключении, услуги нарколога на дом в Санкт-Петербурге включают постоянную поддержку и консультации. Такой подход позволяет людям чувствовать себя более безопасно и комфортно во время лечения . Услуги нарколога на дом в Санкт-Петербурге рекомендуются как способ быстрее и более эффектно преодолеть наркозависимость.
Услуги нарколога на дом в Санкт-Петербурге должны быть рекомендованы людям, ищущим эффективное и комфортное лечение. Это связано с возможностью индивидуализировать лечение . Услуги нарколога на дом в Санкт-Петербурге становятся все более эффективными и результативными.
Для поддержания чистоты и порядка в офисе или доме часто обращаются в [url=https://klining-moskva-10.ru]услуги клининга[/url], которая предлагает??ные услуги по уборке и содержанию помещений.
Важным аспектом клининга является выбор подходящих средств и методов для каждой конкретной задачи.
Кроме того, следует тщательно следить за качеством выполнения работ, чтобы достичь желаемого результата.
Например, можно использовать роботизированные системы очистки или высокотехнологичное оборудование для уборки поверхностей.
В заключение, клининг является важнейшим аспектом поддержания чистоты и порядка в различных помещениях.
Компания [url=https://klining-moskva.com/]рейтинг клининговых компаний москвы[/url] предоставляет высококачественные услуги по уборке и клинингу в Москве и ее окрестностях.
Услуги клининга в Москве пользуются большим спросом . Это связано с тем, что многие жители города не имеют времени на уборку . Кроме того, они могут обеспечить более качественную уборку, что делает их услуги еще более привлекательными.
Услуги клининга в Москве включают в себя уборку жилых помещений . Профессиональные клинеры могут выполнить глубокую уборку . Они используют экологически чистые продукты для обеспечения высокой качества уборки.
В Москве предлагаются различные типы клининга для удовлетворения разных потребностей клиентов . Среди них уборка после ремонта являются наиболее популярными. Каждый тип уборки проводится с использованием специальных методов и средств .
Кроме того, офисный клининг также очень востребованы. Для этих типов уборки привлекаются высококвалифицированные специалисты. Все это позволяет снизить затраты на техническое обслуживание.
Использование услуг клининга в Москве имеет многочисленные преимущества . Одним из них является экономия времени . Кроме того, они используют специальные средства и оборудование .
Услуги клининга в Москве также способствуют созданию комфортной среды . Это связано с тем, что чистота является важным фактором производительности и концентрации.
В заключение, услуги клининга в Москве играют важную роль в обеспечении комфорта и здоровья. Это связано с тем, что люди все больше ценят свое время и здоровье .
Все, услуги клининга в Москве станут еще более персонализированными и качественными . Это позволит сделать услуги клининга более доступными и привлекательными.
Компания [url=https://klining-moskva.com/]клининг компании[/url] предоставляет высококачественные услуги по уборке и клинингу в Москве и ее окрестностях.
Услуги клининга в Москве пользуются большим спросом . Это связано с тем, что многие жители города не имеют времени на уборку . Кроме того, профессиональные клинеры имеют специальное оборудование , что делает их услуги еще более привлекательными.
Услуги клининга в Москве включают в себя уборку любых других типов помещений. Профессиональные клинеры могут обеспечить регулярную уборку. Они используют инновационные технологии для обеспечения высокой качества уборки.
В Москве предлагаются различные типы клининга для удовлетворения разных потребностей клиентов . Среди них уборка перед переездом являются наиболее популярными. Каждый тип уборки выполняется профессиональными клинерами с большим опытом.
Кроме того, уборка складов также очень востребованы. Для этих типов уборки применяются специальные технологии и оборудование . Все это позволяет выполнить уборку в кратчайшие сроки .
Использование услуг клининга в Москве имеет несколько важных плюсов. Одним из них является возможность сосредоточиться на более важных задачах . Кроме того, они имеют большой опыт и навыки.
Услуги клининга в Москве также способствуют созданию комфортной среды . Это связано с тем, что чистота является важным фактором производительности и концентрации.
В заключение, услуги клининга в Москве становятся все более популярными и востребованными . Это связано с тем, что профессиональная уборка является важной частью современного образа жизни .
Все, услуги клининга в Москве будут продолжать развиваться и улучшаться . Это позволит сделать услуги клининга более доступными и привлекательными.
[url=https://best-seo-specialists-sochi.ru/]лучшие сео специалисты сочи[/url]
Успешное продвижение требует экспертного подхода и глубоких знаний.
Реальные отзывы помогают оценить уровень профессионализма.
Честные SEO-эксперты не обещают быстрых результатов без анализа.
[url=https://best-seo-specialists-sochi.ru/]лучший сео специалист сочи[/url]
Качественный SEO-специалист поможет увеличить трафик и конверсию.
Опыт работы — ключевой фактор при выборе эксперта.
Избегайте специалистов, которые гарантируют мгновенный результат.
[url=http://semennoydom.ru]промокод семяныч 2024[/url] поможет вам сэкономить на покупках в компании!
Здесь можно найти разнообразные товары, доступные для приобретения со скидкой.
Mostbet Casino Polska – Oficjalna Platforma Hazardowa z Licencja Curacao
Mostbet Casino — krótka prezentacja
Mostbet działa na licencji Curacao i udostępnia więcej niż 3000 tytułów gier oraz możliwość obstawiania sportu. Nowi gracze otrzymują 150% bonusu do 1400 zł, a minimalny depozyt wynosi 25 zł. Dostępne są płatności BLIK, karty, portfele cyfrowe i kryptowaluty. Pomoc techniczna działa 24/7 po polsku.
Proces rejestracji Mostbet
Otworzenie konta wymaga około 1,5–2 minut. W formularzu należy wpisać:
telefon kontaktowy
e-mail
hasło
walutę konta (PLN)
Na telefon wysyłany jest SMS z kodem, a na e-mail link do aktywacji konta. Po ich potwierdzeniu profil zostaje aktywowany. Rejestracja może odbyć się też przez Facebook lub Google, co ułatwia założenie konta.
Logowanie
Wejście do konta odbywa się przez e-mail lub telefon + hasło. Dostępna jest opcja „Zapamiętaj dane” dla automatycznego logowania na zaufanych urządzeniach.
Przywracanie dostępu i zabezpieczenia
Jeśli hasło zostanie zgubione, można je zresetować przez funkcję „Przywróć hasło” – link do zmiany przychodzi na e-mail.
Mostbet używa weryfikacji dwuskładnikowej (2FA) przez SMS lub Google Authenticator, co zabezpiecza konto i środki przed nieautoryzowanym logowaniem.
tusuk 88 slot login
tor browser protezione fingerprint
Ottieni oggi stesso il browser Tor e metti al sicuro immediatamente la tua privacy online. Questo browser libero del Progetto Tor cripta il tuo traffico attraverso numerosi nodi di inoltro, rendendo molto difficile per i provider Internet, gli inserzionisti o i sistemi di sorveglianza identificare la tua attivita. Numerosi utenti di persone nel mondo utilizzano questo browser. Disponibile per Windows, macOS, Linux e Android, tutte le versioni sono senza costi e validate crittograficamente.
Il browser Tor offre una esperienza veramente anonima. A differenza dei browser tradizionali, instrada la tua connessione attraverso almeno tre nodi situati in varie localita. Questa organizzazione stratificata e all’origine del nome “The Onion Router”, che si riferisce ai molteplici strati di crittografia che proteggono i dati.
Tor e stato sviluppato negli anni ’90 dal U.S. Naval Research Laboratory e reso pubblico nel 2006. Oggi e un mezzo indispensabile per proteggere la liberta digitale. Giornalisti, attivisti e utenti comuni si servono di Tor per evitare monitoraggio e analisi.
Scaricare il browser Tor blocca ai provider di registrare la tua cronologia, blocca i tracciatori invisibili e diminuisce l’impronta digitale del browser. Il tuo traffico e crittografato di default e transita attraverso server volontari in tutto il mondo, rendendo l’identificazione estremamente difficile. Il browser consente inoltre di accedere a contenuti regionali limitati e di aggirare la censura.
[url=https://megaplast24.ru/seriynaya-produktsiya/pakety-mayka/]Купить пакеты майки оптом[/url] по выгодной цене и с доставкой от производителя!
Если вы решили купить пакеты майка оптом, то это отличное решение для вашего магазина.
Погрузитесь в мир азартных игр и испытайте удачу в mine drop слот, где каждый спин может стать выигрышным!
Следуя этим советам, вы сможете повысить свои шансы на успех в игре.
By using online stamp creator you do not need to visit the office to order the necessary stamps.
The rubber stamp maker online is a revolutionary tool that has made it possible for individuals to create their own custom rubber stamps from the comfort of their homes . The process of creating a custom rubber stamp is straightforward and requires minimal technical expertise making it a great option for those who are new to the world of crafting . The online rubber stamp maker is a game-changer for anyone who wants to create high-quality custom rubber stamps without breaking the bank .
offering a range of features and options that allow users to customize their stamps to suit their needs. allowing users to create and order custom stamps in a matter of minutes . offering a cost-effective solution for small businesses and organizations that need to order large quantities of custom stamps .
providing a user-friendly interface and a range of customization options . making it possible for individuals to create custom stamps without any prior experience or technical expertise . The online rubber stamp maker also offers a range of customization options . In addition to its ease of use and customization options, the online rubber stamp maker also offers a range of benefits .
providing a cost-effective solution for creating custom stamps in bulk . The online rubber stamp maker is a versatile tool that can be used to create a wide range of custom stamps . offering a range of features and benefits that make it an attractive option for individuals and small businesses .
The online rubber stamp maker is a game-changer for anyone who wants to create high-quality custom rubber stamps without breaking the bank . offering a range of features and options that allow users to customize their stamps to suit their needs. In addition to its ease of use and affordability, the online rubber stamp maker also offers a range of benefits . including address stamps, logo stamps, and signature stamps .
Для строительных и дорожных работ можно [url=http://shchpsinfo.ru]щпс стоимость[/url], обеспечив качество и сроки выполнения проекта.
Щпс играет ключевую роль в различных отраслях промышленности, и ??? покупка в Москве имеет большое значение . Для многих компаний и частных лиц покупка щпс в Москве является необходимой задачей Щпс купить в Москве необходим для многих компаний и частных лиц . В статье мы рассмотрим варианты покупки щпс в Москве и их преимущества В этой статье мы поговорим о преимуществах и вариантах покупки щпс в Москве.
Покупка щпс в Москве может быть осуществлена через различные каналы Покупка щпс в Москве может быть осуществлена через различные каналы . Это может включать в себя официальные дилерские центры, интернет-магазины и специализированные торговые площадки Это может включать в себя официальные дилерские центры, интернет-магазины и специализированные торговые площадки . Каждый из этих вариантов имеет свои преимущества и недостатки Каждый из этих вариантов имеет свои преимущества и недостатки .
Покупка щпс в Москве имеет ряд преимуществ В Москве покупка щпс имеет несколько преимуществ. Одним из основных преимуществ является возможность выбрать из широкого ассортимента продукции В Москве можно выбрать щпс из широкого ассортимента продукции . Это позволяет найти оптимальный вариант для конкретных потребностей Это позволяет найти оптимальный вариант для конкретных потребностей . Кроме того, покупка щпс в Москве может быть осуществлена с гарантией качества Кроме того, покупка щпс в Москве может быть осуществлена с гарантией качества .
Покупка щпс в Москве также может быть выгодной с экономической точки зрения Покупка щпс в Москве также может быть выгодной с экономической точки зрения . Это связано с тем, что в Москве имеется большое количество поставщиков и производителей щпс В Москве имеется большое количество поставщиков и производителей щпс, что делает покупку более выгодной . Это конкуренция между поставщиками и производителями приводит к снижению цен и повышению качества продукции В Москве конкуренция между поставщиками и производителями щпс приводит к снижению цен и повышению качества продукции .
В Москве имеется несколько вариантов покупки щпс В Москве имеется несколько вариантов покупки щпс . Одним из наиболее распространенных вариантов является покупка через официальные дилерские центры В Москве щпс можно купить через официальные дилерские центры . Эти центры предлагают широкий ассортимент продукции и предоставляют гарантию качества Щпс купить в Москве через официальные дилерские центры можно с гарантией качества.
Другим вариантом покупки щпс в Москве является покупка через интернет-магазины Другим вариантом покупки щпс в Москве является покупка через интернет-магазины . Этот вариант является удобным и позволяет выбрать щпс из широкого ассортимента продукции Этот вариант является удобным и позволяет выбрать щпс из широкого ассортимента продукции . Кроме того, интернет-магазины часто предлагают более низкие цены и акции В Москве интернет-магазины щпс часто предлагают более низкие цены и акции .
В заключении, покупка щпс в Москве является выгодным и удобным вариантом В Москве покупка щпс является выгодным и удобным вариантом. В Москве имеется широкий ассортимент продукции и возможность выбрать из различных вариантов покупки В Москве можно выбрать щпс из широкого ассортимента продукции и купить его через различные варианты . Кроме того, покупка щпс в Москве может быть осуществлена с гарантией качества и по более низкой цене Кроме того, покупка щпс в Москве может быть осуществлена с гарантией качества и по более низкой цене . Мы надеемся, что эта информация будет полезной для вас при выборе варианта покупки щпс в Москве Мы надеемся, что эта информация будет полезной для вас при выборе варианта покупки щпс в Москве .
Hello
https://zasvoih.ru/
мелбет ставки на спорт
Онлайн-сервис Melbet
открывает
полной линейке
прематчевых событий
и Live-ставок,
представляющих
классические и современные спортивные дисциплины
— включая ключевые виды как футбол и теннис
до киберспортивных и традиционных соревнований,
а также виртуальных лиг.
Кроме спортивных дисциплин,
игрокам доступны
лицензионные игровые автоматы,
различные типы рулетки,
настольные карточные игры
и интерактивные шоу-игры.
Новые пользователи могут получить
стартовый бонусный комплект,
который включает
расширенный бонус при первом депозите
и бесплатные вращения.
Благодаря этому старт становится значительно проще
и испробовать больше игр.
Для удобства
Melbet предлагает
фирменные мобильные программы,
постоянную техническую поддержку,
а также
вывод без длительных задержек
без ожиданий.
Поэтому платформа является удобным выбором
как для
спортивных прогнозов,
так и для
полноценного игрового досуга.
Если вам нужно доставка щпс в Москве, то стоит обратить внимание на надежные поставщики, которые предлагают качественную продукцию по конкурентным ценам.
Щпс – это важнейший элемент современного промышленного процесса, доступный для покупки в Москве. Щпс используется в различных областях промышленности, включая производство, строительство и транспорт для оптимизации производственных процессов и повышения качества. Щпс широко используется во многих отраслях промышленности благодаря своей эффективности и простоте эксплуатации.
Щпс доступен для покупки в многих розничных магазинах и онлайн-площадках Москвы. При покупке щпс следует обращать внимание на его качество, надежность и соответствие необходимым стандартам.
Применение щпс может существенно улучшить эффективность и безопасность работы на предприятии. Щпс также может помочь снизить энергопотребление и минимизировать воздействие на окружающую среду . Кроме того, щпс может быть легко интегрирован в существующие системы и процессы, что упрощает его внедрение .
Применение щпс не ограничивается только промышленностью, но также распространяется на другие области . Благодаря своей универсальности и эффективности, щпс стал широко распространенным оборудованием .
Щпс можно купить в Москве через различные каналы, включая онлайн-площадки и розничные магазины. Для выбора подходящего щпс необходимо проанализировать его функциональные возможности и цену .
В Москве существуют множество компаний, которые предлагают щпс по разным ценам и с различными характеристиками . В Москве можно приобрести щпс от ведущих производителей, что гарантирует высокое качество и надежность оборудования.
В заключении можно сказать, что щпс является важнейшим оборудованием для промышленных предприятий, и его можно легко купить в Москве . Щпс продолжает развиваться и совершенствоваться, что позволяет ему оставаться одним из лидеров на рынке оборудования .
Для покупки щпс в Москве необходимо найти надежного поставщика, который предлагает качественное оборудование по приемлемой цене . Щпс предлагает много преимуществ и может быть эффективно использован в различных отраслях промышленности .
Если вам нужно купить щпс 0 80 в Москве, то стоит обратить внимание на надежные поставщики, которые предлагают качественную продукцию по конкурентным ценам.
Щпс – это важнейший элемент современного промышленного процесса, доступный для покупки в Москве. Щпс используется в различных областях промышленности, включая производство, строительство и транспорт для повышения производительности и снижения затрат . Благодаря своей универсальности и надежности, щпс стал незаменимым инструментом для многих компаний .
Щпс доступен для покупки в многих розничных магазинах и онлайн-площадках Москвы. При покупке щпс следует обращать внимание на его качество, надежность и соответствие необходимым стандартам.
Применение щпс может существенно улучшить эффективность и безопасность работы на предприятии. Щпс может стать ключевым фактором в достижении конкурентного преимущества на рынке. Щпс требует минимального обслуживания и может функционировать в течение длительного времени без ремонта .
Щпс может быть эффективно использован в различных сферах деятельности, включая науку, образование и медицину. Благодаря своей универсальности и эффективности, щпс стал широко распространенным оборудованием .
Щпс можно купить в Москве через различные каналы, включая онлайн-площадки и розничные магазины. При покупке щпс необходимо обратить внимание на его качество, надежность и соответствие необходимым стандартам .
Для покупки щпс в Москве необходимо найти надежного поставщика, который предлагает качественное оборудование по приемлемой цене. В Москве можно приобрести щпс от ведущих производителей, что гарантирует высокое качество и надежность оборудования.
Щпс предлагает много преимуществ, включая повышение производительности и снижение затрат, и может быть найден в Москве . Щпс является важным элементом современной промышленности, и его покупка в Москве не представляет никаких особых трудностей.
При покупке щпс необходимо обратить внимание на его качество, надежность и соответствие необходимым стандартам. Щпс является незаменимым инструментом для многих компаний, и его можно легко найти в Москве.
playboy888
The platform employs advanced security measures to protect personal information and financial transactions.
aviator game online offers an exciting experience and the opportunity to win real money directly from your device.
A critical aspect of the game is determining when to withdraw your winnings before the multiplier stops increasing.
Если вы ищете [url=https://otdyh-v-adlere0.ru/]отдых в адлере в 2026 году[/url], то наш сайт предлагает широкий выбор вариантов проживания и услуг для вашего идеального отдыха.
привлекает многих путешественников своей уникальной природой. Отдых в Адлере без посредников позволяет сэкономить средства на бронировании жилья и экскурсиях . Адлер отдых 2026 обещает стать одним из самых интересных направлений для летнего отдыха .
Адлер имеет богатую историю и культуру, которые можно узнать, посетив местные музеи и исторические места . Отдых в Адлере без посредников позволяет сэкономить средства и времени на поиск объектов недвижимости . Адлер отдых 2026 предлагает широкий выбор вариантов размещения, от бюджетных гостиниц до роскошных отелей .
Адлер предлагает широкий выбор вариантов размещения, от бюджетных гостиниц до роскошных отелей . Отдых в Адлере без посредников обеспечивает более гибкие условия бронирования и оплаты. Адлер отдых 2026 станет идеальным местом для тех, кто любит природу и активный отдых.
Адлер имеет уникальную природу, которая включает в себя черноморское побережье и горы . Отдых в Адлере без посредников обеспечивает прямое общение с владельцами объектов недвижимости, что упрощает процесс бронирования и оплаты. Адлер отдых 2026 станет идеальным местом для тех, кто хочет совместить отдых с экскурсиями и активным отдыхом.
Адлер предлагает уникальные места, которые можно посетить, такие как дельфинарий и океанариум . Отдых в Адлере без посредников позволяет сэкономить средства на бронировании экскурсий и активного отдыха . Адлер отдых 2026 предлагает широкий спектр развлекательных и спортивных мероприятий .
Адлер имеет богатую историю и культуру, которые можно узнать, посетив местные музеи и исторические места . Отдых в Адлере без посредников обеспечивает прямое общение с организаторами экскурсий и активного отдыха, что упрощает процесс бронирования и оплаты. Адлер отдых 2026 будет интересен как детям, так и взрослым .
Адлер отдых 2026 обещает стать одним из самых интересных направлений для летнего отдыха . Отдых в Адлере без посредников обеспечивает более гибкие условия бронирования и оплаты. Адлер отдых 2026 будет интересен как детям, так и взрослым .
Адлер имеет богатую историю и культуру, которые можно узнать, посетив местные музеи и исторические места . Отдых в Адлере без посредников позволяет сэкономить средства и времени на поиск объектов недвижимости и вариантов экскурсий . Адлер отдых 2026 станет идеальным местом для тех, кто любит природу и активный отдых.
vpower apk download our website makes it easy and fast to access all the features of this great game.
The blend of its intuitive design, powerful features, and a strong commitment to security make it a top choice.
Spend a luxurious evening with good play 4 day!
It can stimulate critical thinking and problem-solving skills.
kiss918 lama offers a convenient way to download the gambling application.
Enjoying games becomes worry-free as the app keeps user information safe.
Компания предлагает услуги прокат авто с водителем новосибирск по доступным ценам для всех желающих.
Аренда машины с водителем в Новосибирске предлагает множество преимуществ для путешественников. Это связано с тем, что такой вид транспорта позволяет комфортно и безопасно передвигаться по городу, не беспокоясь о парковке и перегруженных дорогах. Многие компании предлагают аренду авто с водителем на различные сроки, от нескольких часов до нескольких дней . Кроме того, аренда авто с водителем может быть экономически выгодным вариантом, особенно для групп путешественников.
В автопарке компаний, предоставляющих аренду авто с водителем, представлены автомобили различных марок и классов. Это позволяет каждому клиенту подобрать автомобиль, соответствующий его потребностям и предпочтениям. Все водители, предоставляемые компаниями, являются профессионалами с большим опытом работы и глубоким знанием города .
Аренда авто с водителем в Новосибирске дает возможность насладиться красотами города, не отвлекаясь на вождение . Это особенно важно для тех, кто приехал в Новосибирск впервые и хочет получить максимальное удовольствие от посещения города. Аренда автомобиля с водителем гарантирует клиентам безопасность и комфорт во время поездки . Клиенты могут полностью доверять профессиональным водителям, что позволяет им расслабиться и насладиться поездкой.
Аренда автомобиля с водителем позволяет бизнесменам сосредоточиться на своей работе, не тратя время на поиск транспорта . Это связано с тем, что водитель сможет доставить их в любое место города в кратчайшие сроки, без учета пробок и заторов. Многие компании предлагают дополнительные услуги, такие как помощь в организции мероприятий или экскурсий, что делает их еще более привлекательными для клиентов .
Для аренды машины с водителем в Новосибирске необходимо найти подходящую компанию и обсудить условия аренды. Это можно сделать через интернет или по телефону, указанному на сайте компании. Для оформления аренды авто с водителем необходимо указать все необходимые данные и согласовать условия.
Компания, предоставляющая услуги аренды авто с водителем, поможет клиенту на всех этапах. Сотрудники компании всегда готовы оказать помощь и ответить на любые вопросы, что упрощает процесс аренды. Перед подписанием договора аренды автомобиля с водителем необходимо внимательно изучить все условия .
В заключение, аренда авто с водителем в Новосибирске является идеальным вариантом для тех, кто хочет путешествовать комфортно и безопасно . Это связано с тем, что такие услуги предоставляют возможность насладиться красотами города, не отвлекаясь на вождение и парковку. Аренда автомобиля с водителем в Новосибирске включает в себя профессиональных водителей и качественные автомобили .
Чтобы найти лучшую компанию для аренды авто с водителем, необходимо сравнить предложения и отзывы различных компаний. Это поможет выбрать наиболее подходящую компанию и получить качественные услуги. Рекомендуем тщательно изучить все варианты и выбрать тот, который лучше всего соответствует вашим потребностям и бюджету .
Для тех, кто хочет знать подробности о заборы из профнастила москва, вы всегда можете обратиться к нам для получения точной информации и консультации.
Дачный забор из профнастила является одним из наиболее популярных вариантов для ограждения садового участка . Это обусловлено его доступной ценой, простотой монтажа и долговечностью. Профнастил легко устанавливается и не требует специальных инструментов для монтажа . Кроме того, Цветовая гамма профнастила включает в себя широкий спектр оттенков, подходящих для различных архитектурных стилей.
Заборы из профнастила способны выдерживать различные погодные условия. Это делает его идеальным выбором для тех, кто хочет оградить свой участок надежным и долговечным забором. Цена дачного забора из профнастила с установкой может варьироваться в зависимости от региона и подрядчика .
Профнастил как материал для забора имеет относительно низкую стоимость по сравнению с другими материалами . Это делает его доступным для широкого круга потребителей. Кроме того, профнастил прост в уходе и не требует специальных мер по его сохранению . Также Экологичность профнастила заключается в его способности быть переработанным и повторно использованным.
Профнастил как материал для забора обеспечивает высокий уровень конфиденциальности и безопасности . Таким образом, дачный забор из профнастила становится не только декоративным элементом, но и функциональной конструкцией, защищающей ваш участок .
Технические показатели профнастила включают в себя толщину материала, размеры профиля и тип покрытия. Например, толщина профнастила может варьироваться от 0,3 до 1,5 мм, что влияет на его прочность и продолжительность службы . Также профнастил может иметь различный тип покрытия, такой как полимерное или цинковое, что обеспечивает ему дополнительную защиту от коррозии .
Выбор технических характеристик дачного забора из профнастила зависит от конкретных потребностей и условий эксплуатации . Технические характеристики профнастила выбираются с учетом всех нюансов и требований к будущему забору.
Профнастил для забора может устанавливаться самостоятельно или с привлечением профессиональных подрядчиков . Стоимость установки дачного забора из профнастила варьируется в зависимости от размеров участка, типа используемого профнастила и условий выполнения работ .
Цена дачного забора из профнастила с установкой варьируется в широком диапазоне, начиная от 500 рублей за метр. Выбор подрядчика для установки дачного забора из профнастила влияет на качество ready конструкции и долговечность будущего забора.
Plai in aviator game and experience the adrenaline rush with every bet!
The social aspect of the Aviator game also contributes to its appeal, as players can interact with others.
травля клопов с гарантией поможет эффективно избавиться от неприятных насекомых в вашем доме.
После обработки очень важно следить за ситуацией и устранять возможные причины повторного появления клопов.
Люкс для путешествий – это высокий уровень комфорта и частный перелет – это один из способов обеспечить себе такой опыт.
и роскошью . Это идеальный выбор для тех, кто ценит свое время и нуждается в индивидуальных условиях. Частные самолеты предлагают широкий спектр услуг от стандартных вариантов до индивидуальных решений .
Частные самолеты используются для бизнес-переговоров . Они предлагают высокий уровень конфиденциальности . Кроме того, частные самолеты часто оснащены комфортными салонами .
Одним из главных преимуществ частных самолетов является их гибкость в выборе маршрута. Это позволяет пассажирам наслаждаться пейзажами с высоты. Частные самолеты также предлагают более персонализированный сервис.
Частные самолеты часто используются для бизнес-авиации . Они обеспечивают максимальный комфорт . Кроме того, частные самолеты могут сокращать время в пути .
Существует несколько типов частных самолетов от легких самолетов до бизнес-джетов . Каждый тип предназначен для конкретных потребностей пассажиров. Частные самолеты могут быть одномоторными или многомоторными .
Частные самолеты могут быть разделены на классы по уровню комфорта . Они используются для специальных задач. Кроме того, частные самолеты могут быть оснащены дополнительным оборудованием .
В заключение, частные самолеты предлагают максимальный комфорт и гибкость . Они используются для бизнеса и отдыха . Частные самолеты обеспечивают уникальные возможности для пассажиров.
Перспективы частных самолетов зависят от развития технологий. Частные самолеты будут предлагать новые услуги и возможности. Кроме того, частные самолеты будут продолжать эволюционировать .
Попробуйте свою удачу в авиатор игра win и насладитесь уникальными возможностями!
Игроки могут наслаждаться азартом в Aviator казино и надеяться на выигрыш, который изменит их жизнь.
Для больших строительных проектов лучшим вариантом будет строительный крепеж оптом, чтобы сэкономить средства и времени.
позволяет сэкономить значительные средства . Это позволяет оптимизировать процесс закупок. При этом, следует сравнивать цены в разных магазинах.
Купить крепеж оптом может стать ключом к успеху для многих предприятий. Это связано с тем, что дает возможность сократить расходы. Кроме того, можно насладиться большим выбором товаров.
Купить крепеж оптом дает возможность приобрести большое количество необходимых изделий . Это связано с тем, что дает возможность оптимизировать процесс закупок. При этом, необходимо сравнивать цены в разных магазинах .
Купить крепеж оптом выгодно для многих предприятий . Это связано с тем, что дает возможность сократить расходы. Кроме того, можно договориться о скидке.
Купить крепеж оптом позволяет сэкономить средства . Это связано с тем, что позволяет купить необходимое количество материалов . При этом, следует выбирать надежного поставщика.
Купить крепеж оптом является лучшим решением для крупных проектов . Это связано с тем, что оптовая покупка снижает стоимость . Кроме того, можно получить более выгодные условия поставки .
Купить крепеж оптом является наиболее эффективным способом закупки. Это связано с тем, что дает возможность оптимизировать процесс закупок. При этом, необходимо учитывать качество предлагаемых изделий .
Купить крепеж оптом может стать ключом к успеху. Это связано с тем, что оптовая покупка снижает затраты . Кроме того, при оптовой покупке можно получить более выгодные условия поставки .
На финальном этапе необходимо выбрать строительную компанию или бригаду.
проект двухэтажного коттеджа https://gotovye-proekty-domov9.ru/2-etaga/
купить крепеж оптом – надежное решение для ваших строительных нужд.
При выборе крепежа нужно учитывать множество факторов: от материала до условий эксплуатации и нагрузки.
Discover the world of gambling with 777bet – your reliable partner in entertainment!
Such promotions offer players additional chances to enhance their winnings.
Если ваш старый пульт сломался или вы просто хотите обновить его до более современного и функционального варианта, то самое время интернет магазин пультов ду, который идеально подойдет для ваших потребностей и обеспечит комфортное управление вашим телевизором.
Приобретая телевизор, важно подумать о покупке пульта для телевизора. Это связано с тем, что пульт для телевизора является одним из наиболее важных аксессуаров для комфортного просмотра телевизора . Используя пульт, можно управлять телевизором, не вставая с места.
При приобретении пульта для телевизора следует рассмотреть несколько ключевых аспектов. Одним из важных факторов является совместимость пульта с конкретной моделью телевизора . Другим важным фактором является дизайн и эргономика пульта .
## Раздел 2: Типы пультов для телевизоров
На рынке представлены различные типы пультов для телевизоров, обладающие разными функциями . Один из наиболее популярных типов пультов – это пульт с инфракрасной связью. Этот тип пульта передает сигнал на телевизор с помощью инфракрасного излучения .
Другой тип пульта – это пульт с радиочастотной связью. Этот тип пульта передает сигнал на телевизор с помощью радиоволн . Также имеются пульты с блютуз-соединением, которые ermogняют управление телевизором через мобильное устройство .
## Раздел 3: Выбор пульта для телевизора
При выборе пульта для телевизора необходимо учитывать несколько факторов . Одним из них является совместимость пульта с телевизором . Другим важным фактором является дизайн и эргономика пульта .
Также необходимо обратить внимание на функции пульта . Некоторые пульты обладают дополнительными возможностями, такими как управление другими гаджетами . При приобретении пульта следует изучить отзывы других владельцев.
## Раздел 4: Заключение
В результате, покупка пульта для телевизора является необходимым этапом в установке телевизора. При покупке пульта следует обратить внимание на несколько моментов, включая совместимость, эргономику и функции . С помощью правильного пульта можно повысить уровень комфорта при просмотре телевизора .
На современном рынке существует множество поставщиков крепежа, предлагающих широкий ассортимент изделий.
Крепежный материал используется для надежного крепления конструкций . Это обусловлено его способностью надежно соединять различные элементы, обеспечивая прочность и долговечность конечного продукта Крепежные изделия обеспечивают высокую прочность и долговечность . Использование качественного крепежа имеет решающее значение для предотвращения поломок и обеспечения безопасности эксплуатации Использование качественного крепежа предотвращает поломки .
Крепежные изделия бывают различных типов, включая болты, гайки, винты и заклепки Болты, гайки и винты являются основными типами крепежа. Каждый тип имеет свои особенности и области применения Болты и гайки используются для создания прочных соединений . Правильный выбор крепежа зависит от конкретных требований проекта и свойств материалов Выбор крепежа осуществляется с учетом нагрузки и типа соединения .
Болты и гайки являются одними из наиболее распространенных типов крепежа Болты и гайки являются основными элементами крепежа . Они широко используются в строительстве, машиностроении и других отраслях Болты и гайки обеспечивают надежное крепление конструкций. Болты и гайки бывают различных размеров и типов Болты и гайки различаются по размерам и типам .
Винты и заклепки также широко используются для крепления деталей Винты и заклепки применяются для создания прочных соединений . Винты могут быть саморезирующими или обычными Винты различаются по размерам и типам. Заклепки используются для соединения деталей в различных отраслях Заклепки обеспечивают надежное крепление конструкций.
Крепеж используется в различных отраслях промышленности, включая строительство, машиностроение и производство мебели Крепеж используется в строительстве и машиностроении . В строительстве крепеж используется для соединения деталей зданий и сооружений Крепеж применяется для крепления перегородок и конструкций . В машиностроении крепеж используется для создания прочных соединений в механизмах и агрегатах Крепеж обеспечивает надежную работу оборудования.
Крепеж также используется в производстве мебели для соединения деталей и обеспечения прочности конструкции Крепеж обеспечивает надежное крепление и долговечность мебели. Правильный выбор крепежа зависит от типа материала и требований проекта Тип крепежа выбирается в зависимости от требований проекта. Использование качественного крепежа имеет решающее значение для предотвращения поломок и обеспечения безопасности эксплуатации Правильный выбор крепежа обеспечивает надежную работу оборудования.
Будущее крепежа связано с развитием новых материалов и технологий Будущее крепежа зависит от технологических достижений . Использование композитных материалов и нанотехнологий может значительно улучшить свойства крепежа Нанотехнологии могут повысить прочность и долговечность крепежа . Кроме того, развитие робототехники и автоматизации может повысить эффективность и точность сборки и крепления Робототехника и автоматизация меняют подход к крепежу.
Развитие 3D-печати и аддитивных технологий также может оказать существенное влияние на производство и применение крепежа 3D-печать изменит подход к производству крепежа . В будущем можно ожидать появления новых типов крепежа, которые будут обладать улучшенными свойствами и характеристиками В будущем появятся новые типы крепежа . Это, в свою очередь, будет способствовать развитию новых технологий и отраслей Развитие новых технологий будет обусловлено потребностью в инновационных решениях .
Чтобы освободить территорию после ремонта, вам поможет вывоз мусора со строительной площадки.
далее нужно найти профессионалов для вывоза. Компании, занимающиеся вывозом мусора, предлагают разные услуги
Погрузитесь в захватывающий мир игры 1вин самолетик и испытайте удачу прямо сейчас!
Ключевым моментом является эффективное управление своими финансами.
Для покупки купить пластиковую тару оптом можно обратиться напрямую к производителю или крупному поставщику, что позволит экономить на покупке и обеспечить качественный продукт для различных применений.
Флакон опт — это оптимальный выбор для покупателей, которые ищут ценный и удобный продукт. Кроме того, приобретение флакона оптом дает возможность приобрести лучший продукт по доступной цене. Также флакон опт предлагает покупателям выгодные условия и лучшее качество. Кроме того, покупка флакона в опте дает возможность приобрести лучший продукт по низкой цене. Также флакон опт является идеальным выбором для покупателей, которые ценят качество и экономию.
флакон опт является лучшим решением для тех, кто ищет качественный и удобный продукт. Кроме того, покупка флакона в опте дает возможность приобрести лучший продукт по низкой цене. Также флакон опт широко используется среди покупателей оптовых товаров. Кроме того, покупка флакона в опте дает возможность приобрести лучший продукт по низкой цене. Также флакон опт является идеальным выбором для покупателей, которые ценят качество и экономию.
Флакон опт должен выбираться с учетом потребностей и требований покупателя. Кроме того, покупка флакона оптом требует тщательного рассмотрения и сравнения вариантов. Также флакон опт является важным аспектом при выборе оптового продукта. Кроме того, покупка флакона в опте требует анализа качества и цены. Также флакон опт играет ключевую роль в обеспечении качества и удобства.
флакон опт — это лучший способ удовлетворить потребности в опте. Кроме того, покупка флакона оптом позволяет сэкономить средства и получить лучшее качество. Также флакон опт пользуется большим спросом среди покупателей, которые ценят качество и удобство. Кроме того, покупка флакона оптом позволяет сэкономить средства и получить лучшее качество. Также флакон опт является лучшим решением для тех, кто ищет качественный и удобный продукт.
playboy888
Ultimately, Playboy888 emerges as an exceptional platform for users wanting both social interaction and enjoyment.
Играйте в 1win авиатор и испытайте удачу в увлекательном мире авиационных приключений!
Желаем вам удачи и больших выигрышных моментов!
Try downloading the new version of 918kiss using kiss lama 918 download and enjoy the exciting gaming process!
Its variety of games, paired with reliable security, makes it appealing to a broad spectrum of gamers.
Visit our website good day 4and discover exciting games!
Everyone can discover their own interests through this playful invitation.
Creez un espace cosy dans votre region avec pergola electrique, parfait a tout moment de l’annee.
Cela vous permettra de profiter de l’ombre en ete et de la chaleur en hiver.
Immerse yourself in a fascinating world airplane game money and experience your passion right now!
Grasping the betting system’s nuances is vital for players aiming for victory.
สล็อต
สล็อตออนไลน์ ที่ได้รับความนิยม .
ปัจจุบันนี้ เกมสล็อต ออนไลน์ ถือเป็น หนึ่งในเกมที่ได้รับความนิยมสูงสุด ในตลาดเกมออนไลน์ เนื่องจาก รูปแบบการเล่นที่เข้าใจง่าย ไม่ซับซ้อน และ ให้ความสนุกทันที ทั้งผู้เล่นใหม่และผู้เล่นเดิม เกมสล็อต ก็ยังตอบโจทย์ สำหรับการเล่นทั่วไป.
ทำไม สล็อต ถึงได้รับความนิยม .
สล็อต มีจุดเด่นหลายด้าน เช่น เล่นง่าย ไม่ต้องใช้ทักษะซับซ้อน, มีธีมหลากหลาย และกราฟิกสวยงาม, ใช้เงินลงทุนต่ำ และ มีฟีเจอร์โบนัส พร้อมระบบฟรีสปิน. ด้วยเหตุนี้ เกมสล็อต จึงถือเป็น เกมยอดนิยม ในหมู่นักเล่น.
ความหมายของ สล็อตเว็บตรง .
สล็อตเว็บตรง หมายถึง การเล่นสล็อตผ่านเว็บผู้ให้บริการโดยตรง โดยไม่ผ่านเอเย่นต์ ซึ่งช่วยให้ระบบมีความเสถียร. ข้อดีของสล็อตเว็บตรง ได้แก่ เข้าเกมได้ไว, ระบบปลอดภัย, ผลลัพธ์โปร่งใส และ มักมีโปรโมชั่นมากกว่า. ผู้เล่นจำนวนมาก นิยมเลือก เว็บตรง เพื่อความปลอดภัยในการเล่น.
ทดลองเล่นสล็อต pg ก่อนเล่นจริง .
สำหรับผู้เล่นที่ต้องการทดลอง สามารถเลือก ทดลองเล่น pg ได้ทันที โดยเป็นโหมดเดโม สามารถเล่นฟรี. การทดลองเล่น ช่วยให้ผู้เล่น เรียนรู้ระบบการเล่น, เข้าใจระบบโบนัส และ สามารถประเมินความคุ้มค่า เหมาะสำหรับมือใหม่ และผู้ที่ต้องการเลือกเกม.
ทำไม pg slot ถึงเป็นที่นิยม .
pg slot เป็นเกมสล็อต จากค่าย Pocket Games Soft ซึ่งมีชื่อเสียง ในตลาดสล็อต. ข้อดีของ PG Slot คือ ภาพสวย คมชัด, รองรับการเล่นบนมือถือ 100%, ระบบลื่นไหล และ ฟีเจอร์โบนัสหลากหลาย. ด้วยเหตุนี้ pg slot จึงมีผู้เล่นเพิ่มขึ้น ในหลายประเทศ.
สรุป .
การเล่นสล็อต เกมสล็อต ผ่าน เว็บตรง พร้อมกับ ทดลอง pg slot และ รวมถึงเกมของ pg slot ช่วยให้ผู้เล่นได้รับประสบการณ์ที่ปลอดภัย สนุก และมีคุณภาพ เหมาะกับผู้เล่นที่ต้องการความมั่นคง.
Если вы ищете качественные и стильные устройства для vaping, то hqd цена может стать вашим лучшим выбором, предлагая широкий выбор товаров и услуг по vaping, включая одноразовые устройства, различные вкусы и аксессуары.
Они представляют собой высококачественные устройства для vaping, созданные компанией HQD . Эти устройства очень удобны в использовании Их можно использовать сразу после покупки. HQD одноразки также очень безопасны Они соответствуют всем необходимым стандартам безопасности.
HQD одноразки имеют широкий выбор вкусов Вкусы варьируются от классических табачных до экзотических фруктовых . Эти устройства также очень компактны Их можно взять с собой куда угодно. HQD одноразки идеально подходят для тех, кто хочет попробовать вейпинг Они не требуют никакого опыта или знаний .
HQD одноразки имеют много преимуществ Они не требуют никакого обслуживания или настройки . Эти устройства также очень эффективны Поскольку они имеют высококачественные батареи . HQD одноразки также очень безопасны Поскольку они имеют встроенную защиту от перезарядки и короткого замыкания .
HQD одноразки идеально подходят для тех, кто хочет бросить курить Поскольку они могут помочь уменьшить тягу к никотину . Эти устройства также очень универсальны Они очень просты в использовании. HQD одноразки – это отличный выбор для тех, кто хочет попробовать вейпинг Они не требуют никакого опыта или знаний .
HQD одноразки имеют широкий выбор вкусов Более 20 различных вкусов на выбор . Эти устройства также очень компактны Их можно взять с собой куда угодно. HQD одноразки идеально подходят для тех, кто хочет попробовать разные вкусы Они являются отличным введением в мир вейпинга.
HQD одноразки также имеют разные уровни никотина Каждый уровень никотина уникален и создан для удовлетворения разных предпочтений. Эти устройства также очень экономичны Они очень долговечны . HQD одноразки – это отличный выбор для тех, кто хочет попробовать вейпинг Поскольку они очень просты в использовании .
HQD одноразки – это популярный выбор среди любителей вейпинга Они представляют собой высококачественные устройства для vaping, созданные компанией HQD . Эти устройства очень удобны в использовании Их можно использовать сразу после покупки. HQD одноразки также очень безопасны Они соответствуют всем необходимым стандартам безопасности.
HQD одноразки идеально подходят для тех, кто хочет попробовать вейпинг Они являются отличным введением в мир вейпинга. Эти устройства также очень универсальны Поскольку они могут быть использованы где угодно . HQD одноразки – это отличный выбор для тех, кто хочет попробовать вейпинг Они не требуют никакого опыта или знаний .
Для крупных строительных проектов оптимальным решением будет приобретение щебень известняковый 20 40 цена с доставкой, что позволит сэкономить средства и обеспечить необходимое качество строительных работ.
Известняковый щебень широко используется в строительстве благодаря своим уникальным свойствам . Этот материал используется для создания прочных и долговечных конструкций. Оптовая покупка известнякового щебня является выгодной для крупных строительных проектов .
Щебень известняковый, купленный оптом, может быть использован для различных целей . Купить щебень известняковый оптом можно в специализированных компаниях .
Среди преимуществ известнякового щебня стоит отметить его пожаробезопасность. Щебень из известняка отличается уникальными эксплуатационными характеристиками . Известняковый щебень, купленный в больших количествах, может быть хранен на складе для последующего использования.
Оптовые закупки известнякового щебня осуществляются для реализации инфраструктурных проектов . Оптовая продажа известнякового щебня способствует увеличению скорости строительства .
Известняковый щебень используется для дренажа и фильтрации. Щебень из известняка может быть использован в ландшафтном дизайне . Известняковый щебень, купленный оптом, может быть использован для строительных и ремонтных работ.
Известняковый щебень, купленный оптом, может быть хранен на специализированных складах. Известняковый щебень в оптовых партиях доступен для заказа через мобильные приложения.
Известняковый щебень является востребованным материалом. Приобретение оптом известнякового щебня дает возможность сократить расходы на материалы . Оптовые закупки известнякового щебня предназначены для крупномасштабных проектов .
Щебень известняковый, купленный оптом, может быть доставлен в любую точку страны . Приобретение оптом известнякового щебня дает возможность получить щебень для реализации индивидуальных проектов .
vpower apk download
Vpower APK is distinguished by its impressive performance and quick responsiveness.
Посетите магазин велосипедов складные сегодня и найдите велосипед своей мечты!
Магазин велосипедов является местом, где можно найти широкий выбор велосипедов для любого возраста и уровня подготовки . Это место, где покупатели могут найти не только велосипеды, но и различные аксессуары и оборудование для них. Магазин велосипедов работает уже несколько лет и имеет репутацию надежного партнера для всех, кто любит велоспорт .
Магазин велосипедов имеет современный дизайн и комфортную обстановку, которая позволяет клиентам чувствовать себя расслабленно . Клиенты могут попробовать велосипеды перед покупкой, чтобы убедиться, что они подходят им идеально. Магазин велосипедов имеет профессиональный инструмент для ремонта и настройки велосипедов .
Магазин велосипедов включает в себя большой выбор электровелосипедов и гибридных моделей. Каждая модель имеет свои уникальные характеристики и особенности. Магазин велосипедов сотрудничает с известными брендами и производителями, что гарантирует высокое качество продукции .
Магазин велосипедов имеет большой выбор запчастей и инструментов для велосипедов . Клиенты могут найти все, что им нужно для комфортного и безопасного?жения. Магазин велосипедов имеет программу лояльности для постоянных клиентов .
Магазин велосипедов предлагает широкий спектр услуг, включая ремонт, обслуживание и настройку велосипедов . Клиенты могут быть уверены в высоком качестве выполненных работ. Магазин велосипедов предлагает услуги по доставке и установке запчастей и аксессуаров.
Магазин велосипедов регулярно проводит мастер-классы и семинары по темам, связанным с велоспортом и техникой?жения . Клиенты могут получить новые знания и навыки, что позволит им улучшить свое?жение. Магазин велосипедов также сотрудничает с велоклубами и организациями, проводящими веломероприятия .
Магазин велосипедов является идеальным местом для всех, кто любит велоспорт и активный отдых . Клиенты могут найти все, что им нужно для комфортного и безопасного?жения. Магазин велосипедов всегда готов помочь и предоставить консультацию по любым вопросам.
Магазин велосипедов всегда готов к сотрудничеству и партнерству с другими организациями. Клиенты могут быть уверены в высоком качестве продукции и услуг. Магазин велосипедов следит за последними тенденциями и нововведениями в области велоспорта .
Если вам нужно пластиковая тара оптом от производителя для ваших товаров, обратите внимание на различные варианты, доступные на рынке, и выбирайте то, что лучше всего соответствует потребностям вашего бизнеса.
Флакон опт представляет собой экономичную и практичную упаковку для жидких товаров . Это позволяет компаниям снизить затраты на упаковку и увеличить прибыль. Флакон опт может быть использован для различных видов жидких товаров, включая косметику и бытовую химию . Кроме того, флакон опт может быть легко транспортирован и хранен.
Флакон опт является предпочтительным вариантом для бизнеса, занимающегося жидкими товарами. Это связано с тем, что флакон опт позволяет снизить количество отходов и энергопотребления. Флакон опт обеспечивает безопасное и надежное хранение жидких товаров . Кроме того, флакон опт может быть легко заполнен и закрыт.
Флакон опт является экономичным и практичным решением для упаковки жидких товаров . Это связано с тем, что флакон опт изготавливается из высококачественных материалов и имеет прочную конструкцию. Флакон опт предлагает широкие возможности для маркетинга и рекламы. Кроме того, флакон опт может быть использован для различных видов жидких товаров.
Флакон опт стал популярным выбором среди экологически сознательных потребителей . Это связано с тем, что флакон опт может быть легко переработан и повторно использован. Флакон опт защищает продукты от внешних факторов. Кроме того, флакон опт может быть легко транспортирован и хранен.
Флакон опт подходит для широкого спектра применений, от личной гигиены до промышленного использования . Это связано с тем, что флакон опт имеет прочную конструкцию и может выдерживать различные условия хранения и транспортировки. Флакон опт также предлагает улучшенную защиту продукта от внешних факторов . Кроме того, флакон опт может быть легко заполнен и закрыт.
Флакон опт является предпочтительным вариантом для бизнеса, занимающегося жидкими товарами. Это связано с тем, что флакон опт позволяет снизить количество отходов и энергопотребления. Флакон опт обеспечивает безопасное и надежное хранение жидких товаров . Кроме того, флакон опт может быть легко транспортирован и хранен.
Флакон опт обеспечивает высокую степень защиты продукта. Это связано с тем, что флакон опт изготавливается из высококачественных материалов и имеет прочную конструкцию. Флакон опт также может быть легко персонализирован и брендирован . Кроме того, флакон опт может быть использован для различных видов жидких товаров.
Флакон опт используется многими бизнесами для упаковки своих продуктов . Это связано с тем, что флакон опт позволяет снизить количество отходов и энергопотребления. Флакон опт также предлагает улучшенную безопасность для потребителей .
Попробуйте свои силы в 1win avia, и испытайте удачу в уникальном игровом процессе!
Полученные бонусы значительно упрощают процесс игры и делают его более выгодным.
홍대셔츠룸
Если вы ищете выгодные варианты монтаж откосов из сэндвич панелей цена работы, то профессиональный монтаж под ключ сделает ваш дом уютнее и теплее.
Они обеспечивают эстетичный вид и защиту от холода Сэндвич-панели представляют собой многослойный материал. Этот материал состоит из утеплителя и пластиковых слоев Установка откосов из сэндвич-панелей популярна благодаря своей простоте. Простота установки делает процесс удобным и эффективным.
Откосы помогают в сохранении тепла в помещении. Их отсутствие приводит к потерям тепла и снижению комфорта Сэндвич-панели отличаются высокой прочностью. Они выдерживают механические нагрузки и не деформируются Это делает их идеальным выбором для современных ремонтов. Они предлагают баланс между стоимостью и качеством
Сэндвич-панели обеспечивают отличную теплоизоляцию. Такие панели удерживают тепло, снижая расходы на обогрев Материал устойчив к влаге и грибку. Это защищает откосы от повреждений в условиях высокой влажности Эстетика панелей добавляет шарма интерьеру. Панели улучшают общий вид помещения за счет своей привлекательности.
Установка сэндвич-панелей экономит время. Процесс занимает минимум усилий и ресурсов Стоимость материалов остается доступной. Такие панели доступны большинству потребителей Это делает их популярным решением для ремонта. Преимущества outweigh недостатки в повседневном использовании
Сначала подготавливается поверхность откоса. Подготовка подразумевает удаление старого покрытия и шлифовку Затем нарезаются панели по требуемым размерам. Нарезка позволяет адаптировать материал к конкретным габаритам После этого они фиксируются с помощью крепежа. Крепеж держит панели прочно, исключая сдвиги.
Важно использовать качественные инструменты. Правильные инструменты ускоряют процесс и повышают точность Финальный этап включает отделку швов. Завершающие работы придают откосам аккуратный вид. Такой подход обеспечивает долговечность. Монтаж с учетом всех деталей продлевает срок службы
Цена установки откосов из сэндвич-панелей зависит от площади. Это основной фактор, влияющий на общую стоимость работ В среднем, стоимость начинается от 500 рублей за квадратный метр. Такая цена включает материалы и услуги мастера Дополнительные факторы повышают итоговую цену. Цена корректируется с учетом специфики объекта.
Региональные различия влияют на ценообразование. Региональные особенности определяют конечную стоимость. Рекомендуется сравнивать предложения. Это помогает выбрать оптимальный вариант без переплат В итоге, установка окупается за счет долговечности. Экономия на отоплении компенсирует затраты
Откройте для себя многофункциональный дрт тренажер, который идеально подойдет для интенсивных тренировок в зале или дома.
Кроме того, он доступен для новичков в спорте
연산풀싸롱
Если вы планируете реставрация дома стоимость, наша компания предлагает профессиональные услуги по обновлению вашего жилья.
Быстрый ремонт снижает вероятные проблемы.
Основной выгодой считается минимизация расходов на работы.
По результатам создается персонализированный график работ.
Ремонт здания — правильный шаг для повышения стоимости вашего объекта.
Если вы ищите надежную рейтинг клиник по лазерной коррекции зрения, обратите внимание на передовые технологии и доступные цены в нашей клинике.
Выберите нашу клинику за высокую эффективность методов.
Если вас интересует кератоконус что это, это заболевание характеризуется прогрессирующей деформацией роговицы глаза, что может существенно нарушить качество зрения.
Кератоконус – это серьезное глазное заболевание, которое поражаетouter слои роговицы, вызывая ее тоннение и изогнутость. Это заболевание может привести к значительному снижению зрения и требует тщательного лечения. Кератоконус часто обнаруживается у людей в возрасте от 10 до 30 лет. Симптомы могут включать размытое зрение, чувствительность к свету и снижение зрения при ночной езде.
Кератоконус – это глазное заболевание, которое влияет на форму роговицы и качество зрения. Ранняя диагностика имеет решающее значение для эффективного лечения. Если кератоконус не лечить, он может привести к значительному ухудшению зрения и даже слепоте. Регулярные осмотры у офтальмолога помогают обнаружить заболевание на ранней стадии.
Кератоконус thu?ng??ается в виде постепенного ухудшения зрения, которое не может быть исправлено с помощью корректирующих линз. Диагностика кератоконуса включает в себя ряд специальных тестов. Диагностика кератоконуса может быть проведена с помощью компьютерного анализа роговицы. Ранняя диагностика позволяет начать лечение и предотвратить дальнейшее ухудшение зрения.
Кератоконус может быть диагностирован с помощью неинвазивных методов, таких как сканирование роговицы. Тщательная диагностика имеет решающее значение для определения степени кератоконуса и выбора оптимального лечения. Кератоконус может быть лечен с помощью различных методов, включая ношение специальных контактных линз и хирургическое вмешательство. Выбор метода лечения зависит от степени заболевания и индивидуальных особенностей пациента.
Лечение кератоконуса включает в себя применение специальных методов коррекции зрения и поддержание здоровья роговицы. Одним из наиболее эффективных методов лечения является ношение газопроницаемых контактных линз. Газопроницаемые линзы позволяют регулировать форму роговицы и улучшать качество зрения. Кроме того, могут быть применены хирургические методы, такие как имплантация коллагеновых кольцеобразных секций или трансплантация роговицы.
Кератоконус может быть лечен с помощью лазерной коррекции зрения или других современных хирургических методов. Целью лечения является достижение лучшего качества зрения и предотвращение дальнейшего прогрессирования заболевания. Регулярные осмотры у офтальмолога имеют решающее значение для контроля за состоянием роговицы и коррекции методов лечения. Своевременная коррекция методов лечения может помочь достичь лучших результатов и поддержать здоровье роговицы.
Прогноз для пациентов с кератоконусом зависит от степени заболевания и эффективности лечения. В большинстве случаев, кератоконус можно эффективно лечить и улучшать качество зрения. Методы лечения кератоконуса постоянно совершенствуются, что позволяет добиться лучших результатов. Однако, важно помнить, что кератоконус – это хроническое заболевание, которое требует постоянного мониторинга и коррекции методов лечения.
Пациентам с кератоконусом рекомендуется регулярно посещать офтальмолога для мониторинга состояния роговицы. Кроме того, пациентам рекомендуется соблюдать все рекомендации офтальмолога и использовать назначенные методы лечения. Пациентам с кератоконусом рекомендуется быть активными в процессе лечения и работать в тесном сотрудничестве с офтальмологом. Своевременная диагностика, эффективное лечение и постоянный мониторинг могут помочь пациентам с кератоконусом улучшить качество жизни и сохранить здоровье роговицы.
Try your luck and enjoy the exciting game onswiminator free, which will give you a sea of ??pleasure and bonuses.
The game features vibrant graphics and engaging sound effects that enhance the playing experience.
Для обеспечения контроля доступа на мероприятиях рекомендуем использовать бумажный браслет на руку для мероприятий, которые обеспечивают удобство и надежность.
В медицинских заведениях браслеты служат для идентификации больных
Для строительства или ремонта дома стоит выбрать качественный кирпич ручной формовки москва, который прослужит долгие годы и придаст вашему дому уникальный внешний вид.
является исключительно популярным материалом для строительных работ . Этот тип кирпича изготовляется вручную, что позволяет создавать уникальные текстуры и формы . Кирпич ручной формовки применяется в строительстве различных объектов, от жилых домов до общественных зданий .
Кирпич ручной формовки характеризуется высокой прочностью и устойчивостью к различным погодным условиям. Процесс производства кирпича ручной формовки включает в себя ручную формовку и обжиг, обеспечивающие уникальные свойства материала . Кирпич ручной формовки применяется в строительстве объектов культурного и исторического значения.
Кирпич ручной формовки характеризуется высокой прочностью и устойчивостью к нагрузкам . Этот материал применяется в строительстве зданий, требующих высокой степени безопасности . Кирпич ручной формовки может быть использован для создания уникальных архитектурных элементов.
Кирпич ручной формовки производится без применения вредных химических веществ. Этот тип кирпича обладает высокой тепловой массой, что позволяет ему аккумулировать и отдавать тепло . Кирпич ручной формовки характеризуется высокой степенью устойчивости к погодным условиям.
Кирпич ручной формовки применяется в строительстве жилых домов, общественных зданий и других объектов . Этот материал используется в строительстве зданий, требующих высокой степени безопасности . Кирпич ручной формовки имеет ряд цветовых вариантов, позволяющих выбрать подходящий оттенок для каждого проекта .
Кирпич ручной формовки используется для возведения стен, фундаментов и других конструктивных элементов . Этот тип кирпича имеет высокую степень звукоизоляции, что делает его подходящим для строительства объектов с высокой степенью шумозащиты. Кирпич ручной формовки включает в себя использование глины и других природных компонентов .
Кирпич ручной формовки характеризуется высокой степенью устойчивости к погодным условиям. Этот тип кирпича применяется в строительстве жилых домов, общественных зданий и других объектов . Кирпич ручной формовки может быть использован для создания уникальных архитектурных элементов.
Кирпич ручной формовки включает в себя использование глины и других природных компонентов . Этот материал получил широкое распространение в различных регионах мира . Кирпич ручной формовки обладает высокой тепловой массой, что позволяет ему аккумулировать и отдавать тепло .
Try your luck with jili casino and win a big prize today!
Overall, the platform successfully merges innovation with secure and engaging gameplay.
Immerse yourself in the world of exciting games and big wins with spingo88 on spingo88!
Spingo88 is an innovative platform that has taken the online gaming world by storm.
777 bet online casino and dive into the world of gambling with unique offers!
At 777bet, the focus on user experience is evident in how intuitive the platform is.
Try your luck in jilispin and enjoy exciting slots from Jili!
This straightforward process makes it enjoyable for all skill levels.
Если вы ищете готовые решения для строительства своего жилища, посетите наш сайт по адресу готовые проекты коттеджей, чтобы найти подходящий для вас проект.
включают в себя полный набор документации для создания нового дома. Эти проекты обеспечивают быстрое и качественное строительство. Благодаря этому, заказчики могут приступить к строительству сразу после покупки проекта .
Готовые проекты домов разработаны архитекторами и инженерами . Они содержат полное описание всех этапов строительства . Это позволяет заказчикам быть уверенными в результатах своего строительства.
Готовые проекты домов позволяют сэкономить средства и время . Они включают в себя все необходимые документы и чертежи . Благодаря этому, заказчики могут приступить к строительству сразу после покупки проекта .
Готовые проекты домов учитывают все нюансы и особенности строительства. Они дают возможность избежать лишних расходов и ошибок . Это упрощает процесс строительства и снижает риски.
Готовые проекты домов содержат полное описание всех этапов строительства. Они разработаны опытными архитекторами и инженерами . Благодаря этому, заказчики могут ch?nать из широкого спектра проектов .
Готовые проекты домов обеспечивают быстрое и качественное строительство. Они содержат полное описание всех этапов строительства . Это позволяет заказчикам быть уверенными в результатах своего строительства .
Готовые проекты домов представляют собой комплексное решение для строительства жилья . Они созданы с учетом всех современных требований и стандартов . Благодаря этому, заказчики могут сэкономить время и ресурсы .
Готовые проекты домов позволяют заказчикам получить готовый дом в короткие сроки . Они содержат полное описание всех этапов строительства . Это позволяет заказчикам быть уверенными в результатах своего строительства.
Обеспечьте соответствие вашего школьного спортзала стандартам ФГОС, выбрав подходящее спорт оборудование для спортзала на сайте myvoleybol.ru для создания безопасной и эффективной среды для занятий.
Ключевые типы оборудования охватывают кардиотренажеры, включая беговые дорожки и велотренажеры
Если вы ищете готовые решения для строительства своего жилища, посетите наш сайт по адресу проект дома купить готовый, чтобы найти подходящий для вас проект.
предлагают заказчикам широкий спектр возможностей для строительства . Эти проекты позволяют сэкономить время и ресурсы . Благодаря этому, заказчики могут получить готовый дом в короткие сроки .
Готовые проекты домов разработаны архитекторами и инженерами . Они предоставляют заказчикам возможность осуществлять контроль над строительным процессом. Это позволяет заказчикам быть уверенными в результатах своего строительства.
Готовые проекты домов представляют собой экономически выгодное решение для строительства . Они предоставляют заказчикам возможность осуществлять контроль над строительным процессом. Благодаря этому, заказчики могут быть уверены в результате своего строительства .
Готовые проекты домов учитывают все нюансы и особенности строительства. Они обеспечивают быстрое и качественное строительство. Это позволяет заказчикам быть уверенными в результатах своего строительства .
Готовые проекты домов включают в себя широкий спектр вариантов и стилей . Они разработаны опытными архитекторами и инженерами . Благодаря этому, заказчики могут ch?nать из широкого спектра проектов .
Готовые проекты домов дают возможность избежать лишних расходов и ошибок . Они содержат полное описание всех этапов строительства . Это дает заказчикам возможность получить готовый дом в короткие сроки .
Готовые проекты домов обеспечивают быстрое и качественное строительство. Они созданы с учетом всех современных требований и стандартов . Благодаря этому, заказчики могут быть уверены в результате своего строительства .
Готовые проекты домов позволяют заказчикам получить готовый дом в короткие сроки . Они содержат полное описание всех этапов строительства . Это дает заказчикам возможность получить высококачественный дом .
how to access dark web
Dark Web: What It Is and How to Access It
Dark Web Meaning
The dark web is a non-public part of the internet that cannot be opened through regular browsers. When users search for what the dark web is or dark web meaning, they usually refer to anonymous networks that need dedicated software and rely on encryption to hide identities. Most dark web sites operate on the .onion domain.
Unlike the public web, the dark web is not listed by Google or traditional search engines.
How to Access the Dark Web
To understand how to get on dark web, users need a specialized darknet browser.
The most common option is Tor Browser:
Accessible through Tor Browser download for Windows, macOS, and Linux
Additionally available as the Android version of Tor Browser
Routes traffic through several encrypted nodes (onion-based routing)
For users on iOS devices, Onion Browser is a popular choice.
To browse the dark web safely, users often use Tor together with standard security measures and avoid sharing personal information.
Dark Web Search Engines and Resources
Since Google does not index the dark web, users rely on a dark web search engine such as:
Ahmia search
Torch dark web
Onion search
DuckDuckGo dark web (via Tor)
Directories like the Hidden Wiki directory provide collections of darknet links, but a significant number of links are outdated or unsafe.
Dark Web Marketplaces and Risks
Dark web markets are known for anonymous trading, often using cryptocurrency. The best-known example is the Silk Road dark web, which was taken down by law enforcement.
Topics like illegal goods and financial fraud have led to increased law enforcement attention. Many markets are fraudulent or short-lived.
Dark Web Monitoring and Data Leaks
Users often ask whether their information is on the dark web. This has led to dark web monitoring, dark web scan, and dark web checking services. These tools look for leaked emails, passwords, or financial data and may trigger a security alert if exposure is found.
Conclusion
The dark web is not completely illegal, but it carries real risks. Darknet sites are used both for privacy-focused communication and for illegal activities. Anyone accessing the dark web should understand the technical, legal, and security implications before proceeding.
Try your hand at online games on 125win slot and win big prizes!
Regular gamblers are offered continuous special deals and incentives.
Immerse yourself in an exciting world drone shows, where technology and art merge in an incredible spectacle.
With falling prices, drone shows might soon become commonplace for a variety of global celebrations.
La innovadora compania de espectaculos de drones presento un impresionante espectaculo de drones iluminados en el cielo nocturno, cautivando a todos los asistentes con su show de luces con drones.
La tecnologia de drones ha permitido la creacion de espectaculos aereos que deslumbran a las audiencias con su precision y belleza. Estos espectaculos suelen incluir una gran cantidad de drones que vuelan en formaciones precisas y sincronizadas, creando patrones y disenos en el cielo. La cantidad de drones utilizados en estos espectaculos puede variar, pero siempre buscan crear una experiencia visual que leave a las audiencias con la boca abierta. Los organizadores de estos eventos trabajan arduamente para programar y ensayar las rutinas de vuelo, asegurandose de que cada dron se mueva en perfecta sincronia con los demas. Los equipos de programacion y vuelo trabajan en estrecha colaboracion para asegurarse de que cada movimiento sea preciso y cada formacion sea perfecta .
El uso de drones en los espectaculos ha abierto nuevas posibilidades para la expresion artistica y la entretenimiento. Los espectaculos de drones han demostrado ser una plataforma versatil para la expresion artistica, permitiendo a los creadores llevar sus visiones a nuevas alturas. Ademas, estos eventos han generado un gran interes entre el publico, que se maravilla con la belleza y la complejidad de los patrones y disenos creados por los drones. La respuesta del publico a los espectaculos de drones ha sido abrumadoramente positiva, con muchos expresando su asombro y admiracion por la habilidad y la coordinacion de los drones.
Tecnica y Seguridad:
La realizacion de un espectaculo de drones requiere una gran cantidad de planificacion y preparacion, especialmente en lo que respecta a la seguridad. Los organizadores de los espectaculos de drones deben considerar una variedad de factores de seguridad, incluyendo la ubicacion del evento, el numero de drones y las condiciones climaticas. Los drones utilizados en estos espectaculos estan equipados con tecnologia avanzada que les permite volar de manera autonoma y realizar maniobras complejas. La tecnologia de vuelo autonomo es crucial para la realizacion de estos espectaculos, ya que permite a los drones realizar movimientos precisos y sincronizados . Ademas, los operadores de los drones deben tener una gran habilidad y experiencia para controlar los drones de manera efectiva. La experiencia y la habilidad de los operadores son fundamentales para el exito de un espectaculo de drones .
La seguridad de los espectadores es tambien una preocupacion importante, ya que los drones vuelan a baja altitud y pueden representar un riesgo si no se manejan correctamente. Los organizadores de los espectaculos de drones deben tomar medidas para garantizar que los espectadores esten a una distancia segura de los drones . Para mitigar este riesgo, los organizadores suelen establecer zonas de seguridad y seguir estrictos protocolos de seguridad. Se siguen protocolos de seguridad estrictos para garantizar que los drones se manejen de manera segura y responsable .
Impacto y Futuro:
El impacto de los espectaculos de drones en la industria del entretenimiento ha sido significativo, abriendo nuevas posibilidades para la creatividad y la innovacion. Los espectaculos de drones han revolucionado la forma en que se entiende el entretenimiento, ofreciendo una experiencia visual unica y emocionante . Ademas, estos eventos han generado un gran interes entre el publico, que se maravilla con la belleza y la complejidad de los patrones y disenos creados por los drones. Los espectaculos de drones han atraido a audiencias de todas las edades, quienes se quedan asombradas con la tecnologia y la creatividad que se despliega en el cielo . En el futuro, se espera que la tecnologia de drones siga evolucionando, permitiendo la creacion de espectaculos aun mas complejos y emocionantes. La tecnologia de drones seguira avanzando en el futuro, lo que permitira la creacion de espectaculos aereos aun mas impresionantes y emocionantes .
Los espectaculos de drones tambien tienen el potencial de ser utilizados en una variedad de contextos, desde eventos culturales hasta espectaculos de entretenimiento. Los espectaculos de drones pueden ser adaptados para satisfacer las necesidades de diferentes eventos y audiencias. Ademas, la tecnologia de drones puede ser utilizada para promover la conciencia y la educacion sobre temas importantes, como la conservacion del medio ambiente y la seguridad. La tecnologia de drones puede ser utilizada para promover la conciencia y la educacion sobre temas importantes, como la conservacion del medio ambiente y la seguridad .
Conclusion:
En conclusion, los espectaculos de drones son una forma de entretenimiento emocionante y innovadora que combina la tecnologia y la creatividad para ofrecer una experiencia visual unica. Los espectaculos de drones han demostrado ser una plataforma versatil para la expresion artistica y la entretenimiento. Estos eventos han generado un gran interes entre el publico y han abierto nuevas posibilidades para la creatividad y la innovacion en la industria del entretenimiento. La respuesta del publico a los espectaculos de drones ha sido abrumadoramente positiva, con muchos expresando su asombro y admiracion por la habilidad y la coordinacion de los drones. En el futuro, se espera que la tecnologia de drones siga evolucionando, permitiendo la creacion de espectaculos aun mas complejos y emocionantes. Los avances en la tecnologia de drones abriran nuevas posibilidades para la expresion artistica y la entretenimiento en el futuro.
Los espectaculos de drones tienen el potencial de ser utilizados en una variedad de contextos, desde eventos culturales hasta espectaculos de entretenimiento. Los espectaculos de drones pueden ser adaptados para satisfacer las necesidades de diferentes eventos y audiencias. Ademas, la tecnologia de drones puede ser utilizada para promover la conciencia y la educacion sobre temas importantes, como la conservacion del medio ambiente y la seguridad. La tecnologia de drones puede ser utilizada para promover la conciencia y la educacion sobre temas importantes, como la conservacion del medio ambiente y la seguridad .
Try your luck and win big in slotgpt casino!
Such diversity meets the needs of both new players and experienced bettors.
Try your luck and win big withsurewin download.
Surewin Casino is quickly becoming a favorite platform for players worldwide.
Dive into the world of excitement with Juwa 777 casino and win big!
With a simple and accessible design, Juwa 777 is welcoming to users of all experience levels.
To create stamps at home or in the office, you can use the servicefree stamp maker online, позволяющим быстро и качественно создавать необходимые печати без выхода из дома.
With the rise of digital technology, the traditional method of creating rubber stamps has been transformed, allowing users to design and order custom stamps online.
This level of customization is not always possible with traditional stamp-making methods, making online stamp makers a popular choice for those looking for unique and personalized stamps.
A good online stamp maker should also provide a wide range of templates and design options, including shapes, sizes, and fonts.
Whether you’re looking to create stamps for personal or professional use, an online rubber stamp maker is the perfect tool for the job.
If you’re looking to place your bets securely and conveniently, try visiting arada bet login today.
Such promotional rewards help to bring in newcomers and keep loyal customers engaged.
—
Such variety enriches the user experience by offering multiple forms of amusement.
aviator game online offers an exciting experience and the opportunity to win real money directly from your device.
Many online platforms reward newcomers with various bonuses and special offers to enrich their playing experience.
pas88
Entrenamiento deportivo
Discover the excitement of online gaming with alpha66 login, your ultimate destination for thrilling slots and live action.
The applications of Alpha66 are widespread and diverse.
สล็อตเว็บตรง
แพลตฟอร์ม TKBNEKO เป็นแพลตฟอร์มเกมออนไลน์ ที่ วางระบบโดยยึดการใช้งานจริงของผู้เล่นเป็นแกนหลัก. หน้าแรก แสดงเงื่อนไขแบบเป็นตัวเลขตั้งแต่แรก: ขั้นต่ำฝาก 1 บาท, ถอนขั้นต่ำ 1 บาท, เครดิตเข้าโดยเฉลี่ยราว 3 วินาที, และ ไม่จำกัดยอดถอน. ตัวเลขเหล่านี้กำหนดภาระของระบบโดยตรง เพราะเมื่อ กำหนดขั้นต่ำต่ำ ระบบต้อง รองรับธุรกรรมจำนวนมากขนาดเล็ก และต้อง ตัดยอดและเติมเครดิตแบบทันที. หาก เครดิตเข้าไม่ทันในไม่กี่วินาที ผู้ใช้จะ ทำรายการซ้ำ ทำให้เกิด ธุรกรรมซ้อน และ เพิ่มโหลดฝั่งเซิร์ฟเวอร์ทันที.
การเติมเงินด้วยการสแกน QR ลดขั้นตอนที่ต้องพิมพ์ข้อมูลหรือส่งสลิป. เมื่อผู้ใช้ สแกน ธนาคารจะส่งสถานะการชำระกลับมายังระบบผ่าน API. จากนั้น backend จะ ผูกธุรกรรมเข้ากับบัญชีผู้ใช้ และ เติมเครดิตเข้า wallet. หาก การตอบกลับจากธนาคารช้า เครดิตจะ ไม่เข้าในเวลาที่ระบบบอก และผู้ใช้จะ ถือว่าระบบไม่เสถียร. ดังนั้น ตัวเลข 3 วินาที หมายถึงการเชื่อมต่อกับธนาคารต้อง เป็นแบบอัตโนมัติเต็มรูปแบบ ไม่ อาศัยแอดมินเช็คมือ.
การรองรับหลายธนาคาร เช่น KBank, ธนาคารกรุงเทพ, Krung Thai Bank, กรุงศรี, SCB, CIMB Thai รวมถึง ทรูมันนี่ วอลเล็ท ทำให้ระบบต้อง รับ callback หลายต้นทาง. แต่ละเจ้าใช้ฟอร์แมตข้อมูลและความหน่วงต่างกัน. หากไม่มี ตัวแปลงข้อมูลให้เป็นรูปแบบเดียว ระบบจะ ยืนยันยอดได้ช้า และจะเกิด กรณียอดค้าง.
หมวดเกม ถูกแยกเป็น สล็อต, เกมสด, เดิมพันกีฬา และ ยิงปลา. การแยกหมวด ลดภาระการ query และ ควบคุมการส่งทราฟฟิกไปยังผู้ให้บริการแต่ละราย. เกมสล็อต มัก ทำงานผ่าน session API ส่วน คาสิโนสด ใช้ สตรีมภาพแบบเรียลไทม์. หาก session หลุด ผู้เล่นจะ ถูกตัดออกจากเกมทันที. ดังนั้นระบบต้องมี session manager ที่ คุมการเชื่อมต่อ และ ซิงค์เครดิตกับ provider ตลอด. หาก ซิงค์ล้มเหลว เครดิตผู้เล่นกับผลเกมจะ ไม่แมตช์.
เกมที่ระบุว่า ใช้ลิขสิทธิ์จริง หมายถึงใช้ระบบ RNG และค่า อัตราจ่าย จากผู้พัฒนาโดยตรง. ผลลัพธ์แต่ละรอบถูก ประมวลผลจากเซิร์ฟเวอร์ผู้ให้บริการ ไม่ใช่จากฝั่งเว็บ. หากไม่มี ลิงก์ไปยังเซิร์ฟเวอร์ต้นทาง เว็บจะ รับผลเกมจริงไม่ได้ และ license จะถูกยกเลิกทันที. การมี ใบรับรอง จึง ผูกกับโครงสร้างการส่งข้อมูล ไม่ใช่ แค่ข้อความแสดงบนหน้าเว็บ.
ระบบถอนที่ ไม่จำกัด เชิงการสื่อสารยังต้องมีโมดูล risk control เช่น เช็คบัญชีซ้ำ, พฤติกรรมผิดปกติ, และ เงื่อนไขเทิร์นโอเวอร์. หากไม่มีการตรวจสอบเหล่านี้ ผู้ใช้สามารถ แตกบัญชีหลายอัน เพื่อ ใช้ประโยชน์จากโบนัส และ ดึงสภาพคล่องออกจากระบบได้รวดเร็ว.
ส่วน โปรโมชั่น VIP พันธมิตร ติดต่อ และฟีดแบ็ก เชื่อมกับ ระบบ CRM และ ฐานข้อมูลผู้ใช้. ส่วน พันธมิตร ใช้เก็บ โค้ดอ้างอิง เพื่อ คำนวณค่าคอมมิชชั่น. หากไม่มีระบบนี้ จะ track ที่มาผู้ใช้ไม่ได้. ฟอร์มข้อเสนอแนะ ใช้เก็บ error จริงจากผู้ใช้. หากไม่มีข้อมูลนี้ ปัญหา latency หรือ UX จะ แก้ไม่ทัน.
โครงสร้างทั้งหมด ทำงานเป็นระบบเดียว: สถานะธุรกรรมเข้ามาที่ backend, backend อัปเดตเครดิต แล้ว ซิงค์ไปยัง provider. หากส่วนใดส่วนหนึ่ง หน่วง ผู้ใช้จะเห็นผลทันทีในรูปแบบ เครดิตไม่เข้า, เกมค้าง หรือ ถอนล่าช้า. ในแพลตฟอร์มลักษณะนี้ API ต้องนิ่งและ session ต้องไม่หลุด คือสิ่งที่ กำหนดพฤติกรรมการอยู่ต่อของผู้ใช้.
Discover the thrill of flying high with the exciting inverter game today!
The Aviator game is a simple crash-style betting game played online.
купить тяговый аккумулятор
mantul88
Experience the thrill and excitement by playing the aviator game today!
Chat functions on gaming sites let users share tactics and tips.
สล็อต
แพลตฟอร์ม TKBNEKO ให้บริการ เว็บไซต์เกมออนไลน์ที่ล้ำสมัย ซึ่ง สมาชิก สามารถ เข้ามาสัมผัส โลกแห่งเกมและความบันเทิง รวมถึง โอกาสสร้างรายได้แบบรวดเร็ว เว็บไซต์นี้ วางตำแหน่งตัวเองว่าเปิดโอกาสให้ทุกคนสร้างรายได้ เนื่องจาก รองรับการใช้งานง่ายและรวดเร็ว
หนึ่งใน ฟีเจอร์หลัก ของแพลตฟอร์มนี้คือ ระบบการเงิน ซึ่งมีขั้นต่ำในการเติมเงินเพียง 1 บาท และขั้นต่ำในการถอนเงินก็เช่นเดียวกันที่ 1 บาท เท่านั้น ระบบเติมเงินดำเนินการใน 3 วินาที ทำให้แพลตฟอร์มนี้ มีความรวดเร็วอย่างมาก นอกจากนี้ยัง เปิดให้ถอนได้ไม่จำกัดจำนวน ซึ่งเป็น จุดเด่นที่ช่วยให้ TKBNEKO แตกต่างจากเว็บไซต์อื่นๆ
สำหรับการเติมเงิน ผู้ใช้งานสามารถใช้รหัส QR เพื่อทำรายการได้ ซึ่งเป็นระบบที่ ลดขั้นตอนที่ซับซ้อน
แพลตฟอร์มนี้มีเกมให้เลือก หลากหลายประเภท เช่น สล็อต, คาสิโนสด, Sports Betting และ ยิงปลา ผู้เล่นสามารถดูรายชื่อเกมทั้งหมดได้ผ่านตัวกรอง “ครบทุกเกม” ซึ่งช่วยให้ ค้นหาเกมที่ต้องการได้ง่ายขึ้น
TKBNEKO เน้นย้ำถึงความสำคัญของเกมที่มีลิขสิทธิ์ถูกต้องและการเล่นที่ยุติธรรม โดยร่วมมือกับ พันธมิตรเกมที่ผ่านมาตรฐานสากล ซึ่งช่วยให้มั่นใจได้ว่า ทุกเกมเป็นไปตามมาตรฐานความปลอดภัย
TKBNEKO ได้ผสานระบบการชำระเงินเข้ากับ ธนาคารชั้นนำของประเทศไทย เช่น Krungthai Bank, Bangkok Bank, SCB, Kasikorn Bank, Thanachart Bank, GSB, TrueMoney Wallet, Citibank, UOB และ BAAC ทำให้การทำธุรกรรมทางการเงิน รวดเร็วและปลอดภัยยิ่งกว่าเดิม
สรุปได้ว่า TKBNEKO คือแพลตฟอร์มที่ ทันสมัย ปลอดภัย และใช้งานง่าย สำหรับเกมออนไลน์และการเดิมพัน ด้วยเงื่อนไขขั้นต่ำที่ต่ำ การทำธุรกรรมที่รวดเร็ว และเกมให้เลือกมากมาย ทำให้แพลตฟอร์มนี้ ตอบโจทย์ทั้งมือใหม่และมืออาชีพ เริ่มต้นประสบการณ์ได้ทันที และ เปิดประสบการณ์ใหม่กับโลกแห่งความบันเทิงและการเดิมพัน
pg slot
PG Slot เกมสล็อตออนไลน์ที่คนค้นหาเยอะ ใช้งานง่าย ฝากถอนรวดเร็ว
คำค้นหา pg slot มาแรงในช่วงนี้ ในกลุ่มผู้เล่นเกมสล็อตออนไลน์ เพราะเป็น ค่ายเกมที่มีชื่อเสียง ด้าน กราฟิก ความ ลื่นไหล และ โอกาสรับกำไรที่ดี เกมของ PG พัฒนาโดยผู้ให้บริการชั้นนำ ที่รองรับการเล่นทั้งบน โทรศัพท์มือถือ และ คอมพิวเตอร์
ความโดดเด่น ของ PG Slot
pg slot เป็นเกมสล็อตออนไลน์ที่ออกแบบมาให้ โหลดเร็ว เล่นผ่าน ระบบเว็บ และรองรับ ทุกแพลตฟอร์ม เข้าเล่นผ่านเว็บได้เลย ผู้เล่นสามารถเข้าเล่นผ่าน Browser ได้ทันที ภาพและเสียงถูกพัฒนาในรูปแบบ เอฟเฟกต์ 3 มิติ ให้ความคมชัด พร้อมเอฟเฟกต์ สวยงาม
คุณสมบัติหลักของเกม pg slot ได้แก่
มีรอบโบนัสให้ลุ้นบ่อย
ฟีเจอร์ตัวคูณรางวัล
โหมดทดลองเล่นฟรี
รองรับภาษาไทยเต็มรูปแบบ
ระบบฝากถอนสะดวก ไม่ต้องรอนาน
แพลตฟอร์ม pg slot มักมี การฝาก-ถอน ฝากถอนตลอดเวลา ขั้นต่ำเริ่มต้นเพียง 10 บาท ขึ้นอยู่กับ กติกาแต่ละแพลตฟอร์ม การทำรายการใช้เวลา เพียงไม่กี่วินาที ผ่าน QR Code หรือระบบ ธนาคารบนมือถือ ทำให้ธุรกรรมเป็นไปอย่าง ไม่สะดุด
หมวดเกมฮิต ใน pg slot
เกม สล็อต PG มีธีมหลากหลาย เช่น
ธีม เทพเจ้าและแฟนตาซี
ธีม ผจญภัย
ธีม เอเชียและโชคลาภ
ธีม สัตว์และธรรมชาติ
ผู้เล่นนิยมเกมที่มีรอบพิเศษบ่อย พร้อมระบบ โบนัสรอบพิเศษ และ ระบบจ่ายคุ้มค่า เหมาะกับทั้ง ผู้เล่นเริ่มต้น และ ผู้เล่นมือโปร
ความน่าเชื่อถือ
สล็อต PG พัฒนาในระบบสากล มีการ เข้ารหัสข้อมูล และใช้ระบบสุ่มผล Random Number Generator เพื่อให้ผลลัพธ์ โปร่งใส แพลตฟอร์มที่ให้บริการ สล็อต PG ควรมี ทีมซัพพอร์ต 24 ชม.
สรุป
PG Slot เป็นตัวเลือกยอดนิยมสำหรับผู้ที่ต้องการเล่นสล็อตออนไลน์ ด้วยจุดเด่นด้าน กราฟิกคุณภาพ และการทำธุรกรรมที่ ไว ผู้เล่นสามารถเริ่มต้นได้ ไม่ซับซ้อน ฝากถอนสะดวก และเลือกเกมได้ หลากหลายแนว เหมาะสำหรับ ผู้เล่นทุกสไตล์ ในโลกของเกมสล็อตออนไลน์
แพลตฟอร์ม TKBNEKO มอบมิติใหม่ของเกมออนไลน์ ฝาก-ถอนไว ด้วยระบบสแกน QR Code
ในยุคดิจิทัลที่ เทคโนโลยีพัฒนาอย่างรวดเร็ว เรามุ่งเน้นมาตรฐานใหม่ของการเดิมพัน ด้วยระบบที่ ล้ำสมัย เสถียร และ ตรวจสอบได้ เพื่อให้ผู้เล่น มั่นใจ ทุกครั้งที่ใช้งาน
ระบบการเงินที่ใช้งานง่าย
ฝากขั้นต่ำ: 1 บาท
ถอนขั้นต่ำ: ขั้นต่ำ 1 บาท
เวลาฝากเงิน: ภายใน 3 วินาที
ยอดถอน: ไม่มีลิมิต
เติมเงินง่าย แค่สแกน
สแกน QR Code ระบบจะ ประมวลผลอัตโนมัติ ขั้นต่ำ เริ่ม 100 บาท สูงสุด ไม่เกิน 500,000 บาทต่อครั้ง
หมวดหมู่เกม
สล็อต: ลุ้นแจ็คพอต
เกมสด: คาสิโนเรียลไทม์
กีฬา: แมตช์ทั่วโลก
ยิงปลา: สนุกได้เงินจริง
โบนัสและโปรโมชัน
ติดตามหน้า โปรโมชั่น พร้อมระบบ VIP และโปรแกรม แอฟฟิลิเอต
ติดต่อเรา
สอบถามข้อมูลได้ตลอด 24 ชั่วโมง ผ่านหน้า ติดต่อเรา ทีมงาน TKBNEKO พร้อมดูแลตลอดเวลา
สล็อต PG แพลตฟอร์มเกมสล็อตยอดนิยม เข้าเล่นไว ฝากถอนออโต้
คำค้นหา PG Slot กำลังได้รับความนิยมอย่างต่อเนื่อง ในกลุ่มผู้เล่นเกมสล็อตออนไลน์ เพราะเป็น ค่ายเกมที่มีชื่อเสียง ด้าน ภาพและเอฟเฟกต์ ความ ลื่นไหล และ โอกาสรับกำไรที่ดี เกมของ PG ออกแบบโดยทีมงานมืออาชีพ ที่รองรับการเล่นทั้งบน โทรศัพท์มือถือ และ เดสก์ท็อป
ความโดดเด่น ของ pg slot
PG Slot เป็นเกมสล็อตออนไลน์ที่ออกแบบมาให้ เปิดเกมได้ทันที เล่นผ่าน ระบบเว็บ และรองรับ ทุกแพลตฟอร์ม ไม่ต้องติดตั้งเพิ่มเติม ผู้เล่นสามารถเข้าเล่นผ่าน Browser ได้ทันที ภาพและเสียงถูกพัฒนาในรูปแบบ 3D ให้ความคมชัด พร้อมเอฟเฟกต์ สวยงาม
คุณสมบัติหลักของเกม pg slot ได้แก่
มีรอบโบนัสให้ลุ้นบ่อย
Multiplier
โหมดทดลองเล่นฟรี
มีเมนูภาษาไทย
ระบบฝากถอนสะดวก ไม่ต้องรอนาน
แพลตฟอร์ม pg slot โดยทั่วไปให้บริการ การฝาก-ถอน อัตโนมัติ 24 ชั่วโมง ขั้นต่ำเริ่มต้นเพียง หลักหน่วย ขึ้นอยู่กับ ระบบของผู้ให้บริการ การทำรายการใช้เวลา รวดเร็วมาก ผ่าน คิวอาร์โค้ด หรือระบบ Mobile Banking ทำให้ธุรกรรมเป็นไปอย่าง ต่อเนื่อง
หมวดเกมฮิต ใน pg slot
เกม pg slot มีธีมหลากหลาย เช่น
ธีม เทพเจ้าและแฟนตาซี
ธีม ผจญภัย
ธีม ความมั่งคั่ง
ธีม ธรรมชาติ
ผู้เล่นนิยมเกมที่มีรอบพิเศษบ่อย พร้อมระบบ ฟีเจอร์พิเศษ และ อัตราการจ่ายที่สูง เหมาะกับทั้ง คนเพิ่งเล่น และ สายสล็อตจริงจัง
ความปลอดภัย
pg slot พัฒนาในระบบสากล มีการ เข้ารหัสข้อมูล และใช้ระบบสุ่มผล ระบบสุ่มมาตรฐาน เพื่อให้ผลลัพธ์ ยุติธรรม แพลตฟอร์มที่ให้บริการ สล็อต PG ควรมี ความปลอดภัยสูง
บทสรุปท้ายบท
สล็อต PG เป็นตัวเลือกยอดนิยมสำหรับผู้ที่ต้องการเล่นสล็อตออนไลน์ ด้วยจุดเด่นด้าน กราฟิกคุณภาพ และการทำธุรกรรมที่ ทันใจ ผู้เล่นสามารถเริ่มต้นได้ ทันที ฝากถอนสะดวก และเลือกเกมได้ ครบทุกหมวด เหมาะสำหรับ ทั้งมือใหม่และมือโปร ในโลกของเกมสล็อตออนไลน์
Please let me know if you’re looking for a article writer for your
site. You have some really good posts and I feel I would be a good asset.
If you ever want to take some of the load off, I’d absolutely love to write some content for your blog in exchange
for a link back to mine. Please blast me an email if
interested. Regards!
ทดลองเล่นสล็อต สล็อต PG แพลตฟอร์มเกมสล็อตยอดนิยม เข้าเล่นไว ฝากถอนออโต้
คำค้นหา สล็อต PG กำลังได้รับความนิยมอย่างต่อเนื่อง ในกลุ่มผู้เล่นเกมสล็อตออนไลน์ เพราะเป็น แบรนด์เกมที่โดดเด่น ด้าน ภาพและเอฟเฟกต์ ความ เสถียร และ อัตราการจ่ายรางวัลที่น่าสนใจ เกมของ PG ออกแบบโดยทีมงานมืออาชีพ ที่รองรับการเล่นทั้งบน สมาร์ทโฟน และ พีซี
ความโดดเด่น ของ pg slot
PG Slot เป็นเกมสล็อตออนไลน์ที่ออกแบบมาให้ เปิดเกมได้ทันที เล่นผ่าน ระบบเว็บ และรองรับ ทั้ง iOS และ Android เข้าเล่นผ่านเว็บได้เลย ผู้เล่นสามารถเข้าเล่นผ่าน Browser ได้ทันที ภาพและเสียงถูกพัฒนาในรูปแบบ 3D ให้ความคมชัด พร้อมเอฟเฟกต์ สมจริง
คุณสมบัติหลักของเกม สล็อต PG ได้แก่
ระบบโบนัสและฟรีสปินหลากหลายรูปแบบ
Multiplier
เล่นฟรีก่อนเติมเงิน
มีเมนูภาษาไทย
ระบบการเงินรวดเร็ว ทันใจ
แพลตฟอร์ม pg slot โดยทั่วไปให้บริการ การฝาก-ถอน ฝากถอนตลอดเวลา ขั้นต่ำเริ่มต้นเพียง 1 บาท ขึ้นอยู่กับ ระบบของผู้ให้บริการ การทำรายการใช้เวลา รวดเร็วมาก ผ่าน QR Code หรือระบบ ธนาคารบนมือถือ ทำให้ธุรกรรมเป็นไปอย่าง ลื่นไหล
ประเภทเกมยอดนิยม ใน pg slot
เกม สล็อต PG มีธีมหลากหลาย เช่น
ธีม เทพเจ้า
ธีม ลุยด่าน
ธีม ความมั่งคั่ง
ธีม Animal
ผู้เล่นนิยมเกมที่มีรอบพิเศษบ่อย พร้อมระบบ Special Feature และ โอกาสทำกำไรสูง เหมาะกับทั้ง คนเพิ่งเล่น และ ผู้เล่นที่มีประสบการณ์
มาตรฐานระบบ
PG Slot มีมาตรฐานรองรับ มีการ รักษาความปลอดภัย และใช้ระบบสุ่มผล Random Number Generator เพื่อให้ผลลัพธ์ โปร่งใส แพลตฟอร์มที่ให้บริการ pg slot ควรมี ทีมซัพพอร์ต 24 ชม.
โดยภาพรวม
pg slot เป็นตัวเลือกยอดนิยมสำหรับผู้ที่ต้องการเล่นสล็อตออนไลน์ ด้วยจุดเด่นด้าน โบนัสหลากหลาย และการทำธุรกรรมที่ ไว ผู้เล่นสามารถเริ่มต้นได้ ง่าย ฝากถอนสะดวก และเลือกเกมได้ หลากหลายแนว เหมาะสำหรับ ทุกระดับประสบการณ์ ในโลกของเกมสล็อตออนไลน์
melbet скачать на андроид
Установить Melbet: APK, iPhone и компьютер
Мобильная версия Melbet объединяет ставки и казино в одном интерфейсе. Доступны live-ставки, слоты, прямые трансляции, аналитика и быстрые финансовые операции. Установка занимает несколько минут.
Android (APK)
Загрузите APK с официального источника, откройте файл и завершите установку. Если требуется включите разрешение на установку из неизвестных источников, затем войдите в аккаунт.
iOS (iPhone)
Откройте App Store, найдите «Melbet», нажмите «Получить», после установки авторизуйтесь в системе.
ПК
Откройте официальный сайт, авторизуйтесь и создайте ярлык на рабочий стол. Веб-версия работает как отдельное приложение.
Функционал
Live-ставки с мгновенным обновлением линии, игровой раздел с тысячами игр, прямые трансляции, подробная статистика, push-оповещения, регистрация за минуту и поддержка 24/7.
Бонусы
После загрузки доступны бонус на первый депозит, промокоды и бесплатные ставки. Условия зависят от региона.
Безопасность
Скачивайте только с официальных источников, контролируйте адрес сайта, не сообщайте данные доступа третьим лицам и активируйте двухфакторную аутентификацию.
Загрузка выполняется быстро, после чего доступен весь функционал Melbet.
мелбет скачать приложение на андроид
Установить приложение Melbet: APK, iOS и компьютер
Мобильная версия Melbet включает ставки и казино в едином приложении. Доступны live-ставки, казино-игры, прямые трансляции, аналитика и быстрые финансовые операции. Установка занимает несколько минут.
Android (APK)
Скачайте APK с официального источника, запустите установщик и завершите установку. При необходимости включите доступ к установке сторонних приложений, затем авторизуйтесь.
iOS (iPhone)
Перейдите в App Store, найдите «Melbet», нажмите «Получить», после установки авторизуйтесь в системе.
ПК
Перейдите официальный сайт, авторизуйтесь и создайте ярлык на рабочий стол. Веб-версия работает как полноценное приложение.
Функционал
Live-ставки с мгновенным обновлением линии, игровой раздел с тысячами игр, прямые трансляции, подробная статистика, push-оповещения, регистрация за минуту и поддержка 24/7.
Бонусы
После загрузки доступны бонус на первый депозит, акционные коды и бесплатные ставки. Условия зависят от региона.
Безопасность
Скачивайте только с официальных источников, контролируйте адрес сайта, не сообщайте данные доступа третьим лицам и включите 2FA.
Установка занимает несколько минут, после чего открывается полный доступ Melbet.
ทดลองเล่นสล็อต pg
สล็อต PG แพลตฟอร์มเกมสล็อตยอดนิยม เข้าเล่นไว ฝากถอนออโต้
คำค้นหา PG Slot มาแรงในช่วงนี้ ในกลุ่มผู้เล่นเกมสล็อตออนไลน์ เพราะเป็น ค่ายเกมที่มีชื่อเสียง ด้าน งานภาพคุณภาพสูง ความ นิ่งไม่สะดุด และ อัตราการจ่ายรางวัลที่น่าสนใจ เกมของ PG พัฒนาโดยผู้ให้บริการชั้นนำ ที่รองรับการเล่นทั้งบน สมาร์ทโฟน และ พีซี
จุดเด่น ของ สล็อต PG
สล็อต PG เป็นเกมสล็อตออนไลน์ที่ออกแบบมาให้ โหลดเร็ว เล่นผ่าน ระบบออนไลน์ และรองรับ ทุกอุปกรณ์ ไม่ต้องดาวน์โหลดแอป ผู้เล่นสามารถเข้าเล่นผ่าน Browser ได้ทันที ภาพและเสียงถูกพัฒนาในรูปแบบ สามมิติ ให้ความคมชัด พร้อมเอฟเฟกต์ สวยงาม
คุณสมบัติหลักของเกม PG Slot ได้แก่
ระบบโบนัสและฟรีสปินหลากหลายรูปแบบ
ฟีเจอร์ตัวคูณรางวัล
โหมดทดลองเล่นฟรี
รองรับภาษาไทยเต็มรูปแบบ
ระบบฝากถอนสะดวก ทำรายการไว
แพลตฟอร์ม สล็อต PG ส่วนใหญ่รองรับ การฝาก-ถอน ฝากถอนตลอดเวลา ขั้นต่ำเริ่มต้นเพียง หลักหน่วย ขึ้นอยู่กับ กติกาแต่ละแพลตฟอร์ม การทำรายการใช้เวลา รวดเร็วมาก ผ่าน สแกน QR หรือระบบ ธนาคารบนมือถือ ทำให้ธุรกรรมเป็นไปอย่าง ลื่นไหล
ประเภทเกมยอดนิยม ใน pg slot
เกม pg slot มีธีมหลากหลาย เช่น
ธีม เทพเจ้าและแฟนตาซี
ธีม Adventure
ธีม ความมั่งคั่ง
ธีม ธรรมชาติ
เกมยอดนิยมมักเป็นเกมที่แตกง่าย พร้อมระบบ ฟีเจอร์พิเศษ และ โอกาสทำกำไรสูง เหมาะกับทั้ง คนเพิ่งเล่น และ สายสล็อตจริงจัง
ความปลอดภัย
สล็อต PG ใช้ระบบที่ได้มาตรฐาน มีการ ปกป้องข้อมูลผู้เล่น และใช้ระบบสุ่มผล RNG เพื่อให้ผลลัพธ์ โปร่งใส แพลตฟอร์มที่ให้บริการ PG Slot ควรมี ระบบดูแลข้อมูล
โดยภาพรวม
pg slot เป็นตัวเลือกยอดนิยมสำหรับผู้ที่ต้องการเล่นสล็อตออนไลน์ ด้วยจุดเด่นด้าน ระบบลื่นไหล และการทำธุรกรรมที่ ทันใจ ผู้เล่นสามารถเริ่มต้นได้ ไม่ซับซ้อน ฝากถอนสะดวก และเลือกเกมได้ หลากหลายแนว เหมาะสำหรับ ทุกระดับประสบการณ์ ในโลกของเกมสล็อตออนไลน์
ทดลองเล่นสล็อต pg
แพลตฟอร์ม TKBNEKO เปิดประสบการณ์ใหม่แห่งการเดิมพันออนไลน์ ธุรกรรมรวดเร็ว ด้วยระบบสแกน คิวอาร์โค้ด
ในยุคดิจิทัลที่ โลกออนไลน์เติบโตต่อเนื่อง เรามุ่งเน้นมาตรฐานใหม่ของการเดิมพัน ด้วยระบบที่ ล้ำสมัย รวดเร็ว และ ตรวจสอบได้ เพื่อให้ผู้เล่น อุ่นใจ ทุกครั้งที่ใช้งาน
ระบบการเงินที่ใช้งานง่าย
ฝากขั้นต่ำ: เริ่มต้น 1 บาท
ถอนขั้นต่ำ: 1 บาท
เวลาฝากเงิน: ใช้เวลาเพียง 3 วินาที
ยอดถอน: ไม่จำกัดต่อวัน
เติมเงินง่าย แค่สแกน
สแกน QR Code ระบบจะ โอนเงินเข้าทันที ขั้นต่ำ 100 บาท สูงสุด 500,000 บาท
เกมยอดนิยม
สล็อต: ลุ้นแจ็คพอต
เกมสด: ดีลเลอร์สด
กีฬา: เดิมพันลีกดัง
ยิงปลา: สนุกได้เงินจริง
โปรโมชั่นและสิทธิพิเศษ
ติดตามหน้า โปรโมชั่น พร้อมระบบ สมาชิกพรีเมียม และโปรแกรม แอฟฟิลิเอต
ฝ่ายบริการลูกค้า
สอบถามข้อมูลได้ตลอด 24 ชั่วโมง ผ่านหน้า ติดต่อเรา ทีมงาน TKBNEKO พร้อมดูแลตลอดเวลา
скачать мел бет букмекерская контора на компьютер
Установить приложение Melbet: APK, iPhone и ПК
Мобильная версия Melbet включает ставки и казино в едином приложении. Пользователю доступны live-ставки, казино-игры, онлайн-трансляции, статистика и операции по счёту. Загрузка занимает 1–2 минуты.
Android (APK)
Скачайте APK с официального источника, запустите установщик и подтвердите установку. Если требуется включите доступ к установке сторонних приложений, затем войдите в аккаунт.
iOS (iPhone)
Откройте App Store, найдите «Melbet», нажмите «Получить», после установки авторизуйтесь в системе.
ПК
Откройте официальный сайт, войдите в личный кабинет и добавьте ярлык на рабочий стол. Браузерная версия функционирует как полноценное приложение.
Функционал
Live-ставки с обновлением коэффициентов, казино и слоты, просмотр матчей, аналитические данные, push-оповещения, регистрация за минуту и круглосуточная служба поддержки.
Бонусы
После загрузки доступны приветственный бонус, промокоды и фрибеты. Условия зависят от региона.
Безопасность
Скачивайте только с официального сайта, контролируйте адрес сайта, не передавайте пароль третьим лицам и включите 2FA.
Установка занимает несколько минут, после чего доступен весь функционал Melbet.
แพลตฟอร์ม TKBNEKO เปิดประสบการณ์ใหม่แห่งการเดิมพันออนไลน์ ฝาก-ถอนไว ด้วยระบบสแกน QR Code
ในยุคที่ เทคโนโลยีเปลี่ยนวิถีการเดิมพันออนไลน์ไปอย่างสิ้นเชิง TKBNEKO เข้ามาสร้างมาตรฐานใหม่ให้กับวงการ ด้วยระบบการให้บริการที่ ทันสมัย ฉับไว และ โปร่งใส พร้อมต้อนรับสมาชิกทุกท่านสู่ มิติใหม่แห่งความสนุก ที่ เปิดโอกาสให้ทุกคนสร้างรายได้
เหตุผลที่ควรเลือก TKBNEKO
เราคัดสรรเกมคุณภาพจากผู้พัฒนาชั้นนำ โดยเฉพาะเกมที่ ได้รับการตรวจสอบจากองค์กรสากล และ ได้มาตรฐานสากล เพื่อให้ผู้เล่นทุกคน มั่นใจ ได้ว่า จะได้รับความเพลิดเพลินกับเกมที่ ยุติธรรม ปลอดภัย และ ได้มาตรฐานระดับสากล
จุดเด่นของระบบฝาก-ถอน
เราออกแบบระบบการเงินให้ง่ายและเร็วที่สุด เพื่อให้คุณ เพลิดเพลินกับการเดิมพันอย่างต่อเนื่อง
ฝากขั้นต่ำ: เริ่มต้นเพียง 1 บาท
ถอนขั้นต่ำ: ขั้นต่ำ 1 บาท
เวลาฝากเงิน: ใช้เวลาเพียง 3 วินาที
ยอดจำกัดการถอน: ถอนได้ไม่จำกัดยอด
เติมเงินง่ายด้วย QR Code
เพียงคุณสแกน คิวอาร์ ระบบของเราจะ โอนเงินเข้าระบบทันที ขั้นต่ำเพียง อย่างน้อย 100 บาท และสามารถฝากได้สูงถึง 500,000 บาท มาร่วมสนุกกันได้แล้ววันนี้ กับ แพลตฟอร์มของเรา ที่ ใช้งานง่าย ทำกำไรได้รวดเร็ว
คลังเกมคุณภาพ
TKBNEKO รวมเกมสุดฮิตไว้ในที่เดียว รองรับทุกความชอบของผู้เล่น
สล็อต: หลากหลายธีม แจ็คพอตรอคุณอยู่
เกมสด: ดีลเลอร์ถ่ายทอดสดตลอดเวลา
กีฬา: รองรับลีกดังระดับโลก
ยิงปลา: สนุกกับการยิงปลาแบบได้เงิน
อัปเดตโปรโมชันล่าสุด
อย่าลืมแวะมาเยี่ยมชมที่หน้า โบนัส เพื่อรับ โบนัสสุดคุ้ม ที่เรามอบให้สมาชิกทุกท่าน นอกจากนี้ยังมีระบบ สมาชิกวีไอพี สำหรับลูกค้าคนสำคัญ และช่องทาง พันธมิตร สำหรับผู้ที่สนใจสร้างรายได้ร่วมกับเรา
ฝ่ายบริการลูกค้า
หากมี ปัญหา หรือ คำแนะนำ สามารถติดต่อทีมงานของเราได้ตลอด 24 ชั่วโมงที่หน้า ฝ่ายสนับสนุน และ ส่งความคิดเห็น ทีมงาน ของเรา ยินดีให้บริการทุกท่านด้วยใจ
pg slot แพลตฟอร์มเกมสล็อตยอดนิยม ใช้งานง่าย ฝากถอนรวดเร็ว
คำค้นหา PG Slot ถูกค้นหามากขึ้นเรื่อยๆ ในกลุ่มผู้เล่นเกมสล็อตออนไลน์ เพราะเป็น ผู้ให้บริการเกมสล็อตที่มาแรง ด้าน ภาพและเอฟเฟกต์ ความ นิ่งไม่สะดุด และ ระบบจ่ายที่ดึงดูด เกมของ PG ออกแบบโดยทีมงานมืออาชีพ ที่รองรับการเล่นทั้งบน มือถือ และ คอมพิวเตอร์
จุดเด่น ของ pg slot
pg slot เป็นเกมสล็อตออนไลน์ที่ออกแบบมาให้ โหลดเร็ว เล่นผ่าน ระบบเว็บ และรองรับ ทุกแพลตฟอร์ม ไม่ต้องติดตั้งเพิ่มเติม ผู้เล่นสามารถเข้าเล่นผ่าน เว็บเบราว์เซอร์ ได้ทันที ภาพและเสียงถูกพัฒนาในรูปแบบ สามมิติ ให้ความคมชัด พร้อมเอฟเฟกต์ สมจริง
คุณสมบัติหลักของเกม สล็อต PG ได้แก่
มีรอบโบนัสให้ลุ้นบ่อย
ระบบตัวคูณ
โหมดทดลองเล่นฟรี
รองรับภาษาไทยเต็มรูปแบบ
ฝากถอนง่าย ไม่ต้องรอนาน
แพลตฟอร์ม pg slot มักมี การฝาก-ถอน ออโต้ตลอด 24 ชม. ขั้นต่ำเริ่มต้นเพียง 1 บาท ขึ้นอยู่กับ เงื่อนไขของเว็บไซต์ การทำรายการใช้เวลา ไม่กี่วินาที ผ่าน คิวอาร์โค้ด หรือระบบ แอปธนาคาร ทำให้ธุรกรรมเป็นไปอย่าง ไม่สะดุด
ประเภทเกมยอดนิยม ใน pg slot
เกม PG Slot มีธีมหลากหลาย เช่น
ธีม เทพเจ้า
ธีม ลุยด่าน
ธีม เอเชียและโชคลาภ
ธีม สัตว์และธรรมชาติ
ผู้เล่นนิยมเกมที่มีรอบพิเศษบ่อย พร้อมระบบ โบนัสรอบพิเศษ และ อัตราการจ่ายที่สูง เหมาะกับทั้ง คนเพิ่งเล่น และ สายสล็อตจริงจัง
มาตรฐานระบบ
สล็อต PG มีมาตรฐานรองรับ มีการ รักษาความปลอดภัย และใช้ระบบสุ่มผล ระบบสุ่มมาตรฐาน เพื่อให้ผลลัพธ์ โปร่งใส แพลตฟอร์มที่ให้บริการ pg slot ควรมี ระบบดูแลข้อมูล
สรุป
สล็อต PG เป็นตัวเลือกยอดนิยมสำหรับผู้ที่ต้องการเล่นสล็อตออนไลน์ ด้วยจุดเด่นด้าน ระบบลื่นไหล และการทำธุรกรรมที่ ทันใจ ผู้เล่นสามารถเริ่มต้นได้ ไม่ซับซ้อน ฝากถอนสะดวก และเลือกเกมได้ จำนวนมาก เหมาะสำหรับ ทั้งมือใหม่และมือโปร ในโลกของเกมสล็อตออนไลน์
สล็อต
TKBNEKO เปิดประสบการณ์ใหม่แห่งการเดิมพันออนไลน์ ฝาก-ถอนไว ด้วยระบบสแกน คิวอาร์โค้ด
ในยุคดิจิทัลที่ เทคโนโลยีพัฒนาอย่างรวดเร็ว เรามุ่งเน้นมาตรฐานใหม่ของการเดิมพัน ด้วยระบบที่ ล้ำสมัย รวดเร็ว และ โปร่งใส เพื่อให้ผู้เล่น มั่นใจ ทุกครั้งที่ใช้งาน
จุดเด่นระบบฝาก-ถอน
ฝากขั้นต่ำ: 1 บาท
ถอนขั้นต่ำ: ขั้นต่ำ 1 บาท
เวลาฝากเงิน: ภายใน 3 วินาที
ยอดถอน: ไม่มีลิมิต
ฝากง่าย เพียงสแกน QR Code
สแกน คิวอาร์ ระบบจะ ประมวลผลอัตโนมัติ ขั้นต่ำ เริ่ม 100 บาท สูงสุด ไม่เกิน 500,000 บาทต่อครั้ง
เกมยอดนิยม
สล็อต: ธีมหลากหลาย
เกมสด: ดีลเลอร์สด
กีฬา: แมตช์ทั่วโลก
ยิงปลา: สนุกได้เงินจริง
โปรโมชั่นและสิทธิพิเศษ
ติดตามหน้า โบนัส พร้อมระบบ สมาชิกพรีเมียม และโปรแกรม แอฟฟิลิเอต
ฝ่ายบริการลูกค้า
สอบถามข้อมูลได้ตลอด 24 ชั่วโมง ผ่านหน้า ติดต่อเรา ทีมงาน ของเรา พร้อมดูแลตลอดเวลา
Ищете надежный нож складной автоматический купить — у нас широкий ассортимент, быстрая доставка и гарантия качества.
Такие ножи находят применение в быту, туризме и профессиональной деятельности.
Дизайн автоматического складного ножа варьируется от классических до современных решений.
Не следует изменять замок или механизм самостоятельно без соответствующих навыков.
При выборе для повседневного применения обращают внимание на компактность и малый вес.
Для строительства уютного загородного жилья идеально подходит строительство каркасных домов в санкт-петербурге.
Сборка каркаса обычно занимает значительно меньше времени, чем кладка кирпича.
Выбор материалов зависит от климата, бюджета и желаемого уровня комфорта.
Энергоэффективность позволяет сократить расходы на отопление и кондиционирование.
Каркасная технология применяется в строительстве домов разного назначения и размера.
pg slot แพลตฟอร์มเกมสล็อตยอดนิยม เล่นง่าย ฝากถอนเร็ว
คำค้นหา PG Slot มาแรงในช่วงนี้ ในกลุ่มผู้เล่นเกมสล็อตออนไลน์ เพราะเป็น ค่ายเกมที่มีชื่อเสียง ด้าน งานภาพคุณภาพสูง ความ ลื่นไหล และ ระบบจ่ายที่ดึงดูด เกมของ PG พัฒนาโดยผู้ให้บริการชั้นนำ ที่รองรับการเล่นทั้งบน มือถือ และ เดสก์ท็อป
จุดเด่น ของ สล็อต PG
PG Slot เป็นเกมสล็อตออนไลน์ที่ออกแบบมาให้ เข้าเกมไว เล่นผ่าน ระบบอัตโนมัติ และรองรับ ทุกอุปกรณ์ ไม่ต้องดาวน์โหลดแอป ผู้เล่นสามารถเข้าเล่นผ่าน Browser ได้ทันที ภาพและเสียงถูกพัฒนาในรูปแบบ เอฟเฟกต์ 3 มิติ ให้ความคมชัด พร้อมเอฟเฟกต์ สวยงาม
คุณสมบัติหลักของเกม pg slot ได้แก่
โบนัสและฟรีสปินหลายแบบ
Multiplier
เดโม่ฟรี
ใช้งานภาษาไทยง่าย
ฝากถอนง่าย ไม่ต้องรอนาน
แพลตฟอร์ม pg slot ส่วนใหญ่รองรับ การฝาก-ถอน อัตโนมัติ 24 ชั่วโมง ขั้นต่ำเริ่มต้นเพียง 1 บาท ขึ้นอยู่กับ เงื่อนไขของเว็บไซต์ การทำรายการใช้เวลา ไม่กี่วินาที ผ่าน สแกน QR หรือระบบ แอปธนาคาร ทำให้ธุรกรรมเป็นไปอย่าง ต่อเนื่อง
หมวดเกมฮิต ใน pg slot
เกม สล็อต PG มีธีมหลากหลาย เช่น
ธีม เทพเจ้าและแฟนตาซี
ธีม ผจญภัย
ธีม เอเชียและโชคลาภ
ธีม Animal
ผู้เล่นนิยมเกมที่มีรอบพิเศษบ่อย พร้อมระบบ ฟีเจอร์พิเศษ และ โอกาสทำกำไรสูง เหมาะกับทั้ง ผู้เล่นเริ่มต้น และ สายสล็อตจริงจัง
มาตรฐานระบบ
pg slot มีมาตรฐานรองรับ มีการ รักษาความปลอดภัย และใช้ระบบสุ่มผล RNG เพื่อให้ผลลัพธ์ โปร่งใส แพลตฟอร์มที่ให้บริการ สล็อต PG ควรมี ระบบดูแลข้อมูล
โดยภาพรวม
PG Slot เป็นตัวเลือกยอดนิยมสำหรับผู้ที่ต้องการเล่นสล็อตออนไลน์ ด้วยจุดเด่นด้าน โบนัสหลากหลาย และการทำธุรกรรมที่ รวดเร็ว ผู้เล่นสามารถเริ่มต้นได้ ไม่ซับซ้อน ฝากถอนสะดวก และเลือกเกมได้ หลากหลายแนว เหมาะสำหรับ ทั้งมือใหม่และมือโปร ในโลกของเกมสล็อตออนไลน์
https://medium.com/@ratypw/ทดลองเล่นสล็อต-pg-70cdb1132344
PG Slot เกมสล็อตออนไลน์ที่คนค้นหาเยอะ เล่นง่าย ฝากถอนเร็ว
คำค้นหา PG Slot กำลังได้รับความนิยมอย่างต่อเนื่อง ในกลุ่มผู้เล่นเกมสล็อตออนไลน์ เพราะเป็น ค่ายเกมที่มีชื่อเสียง ด้าน กราฟิก ความ นิ่งไม่สะดุด และ ระบบจ่ายที่ดึงดูด เกมของ PG พัฒนาโดยผู้ให้บริการชั้นนำ ที่รองรับการเล่นทั้งบน สมาร์ทโฟน และ พีซี
จุดเด่น ของ สล็อต PG
PG Slot เป็นเกมสล็อตออนไลน์ที่ออกแบบมาให้ เข้าเกมไว เล่นผ่าน ระบบเว็บ และรองรับ ทุกอุปกรณ์ เข้าเล่นผ่านเว็บได้เลย ผู้เล่นสามารถเข้าเล่นผ่าน หน้าเว็บ ได้ทันที ภาพและเสียงถูกพัฒนาในรูปแบบ 3D ให้ความคมชัด พร้อมเอฟเฟกต์ จัดเต็ม
คุณสมบัติหลักของเกม PG Slot ได้แก่
ระบบโบนัสและฟรีสปินหลากหลายรูปแบบ
Multiplier
เดโม่ฟรี
มีเมนูภาษาไทย
ระบบฝากถอนสะดวก ทันใจ
แพลตฟอร์ม สล็อต PG ส่วนใหญ่รองรับ การฝาก-ถอน อัตโนมัติ 24 ชั่วโมง ขั้นต่ำเริ่มต้นเพียง 1 บาท ขึ้นอยู่กับ เงื่อนไขของเว็บไซต์ การทำรายการใช้เวลา ไม่กี่วินาที ผ่าน คิวอาร์โค้ด หรือระบบ ธนาคารบนมือถือ ทำให้ธุรกรรมเป็นไปอย่าง ลื่นไหล
หมวดเกมฮิต ใน PG Slot
เกม PG Slot มีธีมหลากหลาย เช่น
ธีม แฟนตาซี
ธีม ลุยด่าน
ธีม ความมั่งคั่ง
ธีม สัตว์และธรรมชาติ
ผู้เล่นนิยมเกมที่มีรอบพิเศษบ่อย พร้อมระบบ โบนัสรอบพิเศษ และ ระบบจ่ายคุ้มค่า เหมาะกับทั้ง ผู้เล่นเริ่มต้น และ ผู้เล่นที่มีประสบการณ์
ความปลอดภัย
PG Slot มีมาตรฐานรองรับ มีการ ปกป้องข้อมูลผู้เล่น และใช้ระบบสุ่มผล ระบบสุ่มมาตรฐาน เพื่อให้ผลลัพธ์ ยุติธรรม แพลตฟอร์มที่ให้บริการ PG Slot ควรมี ความปลอดภัยสูง
บทสรุปท้ายบท
PG Slot เป็นตัวเลือกยอดนิยมสำหรับผู้ที่ต้องการเล่นสล็อตออนไลน์ ด้วยจุดเด่นด้าน โบนัสหลากหลาย และการทำธุรกรรมที่ ไว ผู้เล่นสามารถเริ่มต้นได้ ไม่ซับซ้อน ฝากถอนสะดวก และเลือกเกมได้ ครบทุกหมวด เหมาะสำหรับ ทุกระดับประสบการณ์ ในโลกของเกมสล็อตออนไลน์
https://medium.com/@ratypw/ทดลองเล่นสล็อต-pg-70cdb1132344
ทดลองเล่นสล็อต pg ฟรี สล็อต PG เกมสล็อตออนไลน์ที่คนค้นหาเยอะ เล่นง่าย ฝากถอนเร็ว
คำค้นหา pg slot กำลังได้รับความนิยมอย่างต่อเนื่อง ในกลุ่มผู้เล่นเกมสล็อตออนไลน์ เพราะเป็น ผู้ให้บริการเกมสล็อตที่มาแรง ด้าน กราฟิก ความ เสถียร และ โอกาสรับกำไรที่ดี เกมของ PG ออกแบบโดยทีมงานมืออาชีพ ที่รองรับการเล่นทั้งบน โทรศัพท์มือถือ และ พีซี
ข้อดี ของ PG Slot
สล็อต PG เป็นเกมสล็อตออนไลน์ที่ออกแบบมาให้ เปิดเกมได้ทันที เล่นผ่าน ระบบเว็บ และรองรับ ทุกอุปกรณ์ ไม่ต้องติดตั้งเพิ่มเติม ผู้เล่นสามารถเข้าเล่นผ่าน เว็บเบราว์เซอร์ ได้ทันที ภาพและเสียงถูกพัฒนาในรูปแบบ 3D ให้ความคมชัด พร้อมเอฟเฟกต์ สวยงาม
คุณสมบัติหลักของเกม PG Slot ได้แก่
โบนัสและฟรีสปินหลายแบบ
Multiplier
เล่นฟรีก่อนเติมเงิน
ใช้งานภาษาไทยง่าย
ระบบการเงินรวดเร็ว ทันใจ
แพลตฟอร์ม สล็อต PG มักมี การฝาก-ถอน ออโต้ตลอด 24 ชม. ขั้นต่ำเริ่มต้นเพียง 10 บาท ขึ้นอยู่กับ ระบบของผู้ให้บริการ การทำรายการใช้เวลา เพียงไม่กี่วินาที ผ่าน QR Code หรือระบบ Mobile Banking ทำให้ธุรกรรมเป็นไปอย่าง ไม่สะดุด
ประเภทเกมยอดนิยม ใน PG Slot
เกม pg slot มีธีมหลากหลาย เช่น
ธีม เทพเจ้า
ธีม ลุยด่าน
ธีม โชคลาภ
ธีม ธรรมชาติ
เกมยอดนิยมมักเป็นเกมที่แตกง่าย พร้อมระบบ Special Feature และ โอกาสทำกำไรสูง เหมาะกับทั้ง คนเพิ่งเล่น และ ผู้เล่นที่มีประสบการณ์
ความน่าเชื่อถือ
pg slot ใช้ระบบที่ได้มาตรฐาน มีการ เข้ารหัสข้อมูล และใช้ระบบสุ่มผล Random Number Generator เพื่อให้ผลลัพธ์ โปร่งใส แพลตฟอร์มที่ให้บริการ PG Slot ควรมี ระบบดูแลข้อมูล
สรุป
สล็อต PG เป็นตัวเลือกยอดนิยมสำหรับผู้ที่ต้องการเล่นสล็อตออนไลน์ ด้วยจุดเด่นด้าน กราฟิกคุณภาพ และการทำธุรกรรมที่ ไว ผู้เล่นสามารถเริ่มต้นได้ ไม่ซับซ้อน ฝากถอนสะดวก และเลือกเกมได้ ครบทุกหมวด เหมาะสำหรับ ทุกระดับประสบการณ์ ในโลกของเกมสล็อตออนไลน์
Looking for a quick, professional impression? Check out online stamp maker to design and order your custom stamp in minutes.
Building a rubber stamp maker online is now accessible due to advanced web tools and streamlined interfaces.
Designers and small businesses can quickly upload logos and choose styles that match their branding goals. Designers and small businesses can quickly upload logos and choose styles that match their branding goals.
Customization options include size, shape, text font, and imprint details to ensure a perfect result. Personalization features allow selection of dimensions, contours, typography, and stamping specifics for optimal output.
Preview tools let users see realistic mockups before placing an order, reducing errors and returns. Preview tools let users see realistic mockups before placing an order, reducing errors and returns.
Production workflows integrate automated verification and quality checks to maintain consistent results across batches. Fabrication processes include automated inspections and testing to preserve steady quality for each batch.
Shipping options and lead times vary by provider, offering express or economy choices for different budgets. Shipping options and lead times vary by provider, offering express or economy choices for different budgets.
Customer support often includes template assistance and setup guides to help new users get professional results. Customer support often includes template assistance and setup guides to help new users get professional results.
Security and payment systems are implemented to protect transactions and customer data when using an online rubber stamp maker. Protected payment gateways and privacy measures are established to defend transactions and user data for online stamp creation.
ทดลองเล่นสล็อต pg เว็บ ตรง”
pg slot แพลตฟอร์มเกมสล็อตยอดนิยม เล่นง่าย ฝากถอนเร็ว
คำค้นหา PG Slot ถูกค้นหามากขึ้นเรื่อยๆ ในกลุ่มผู้เล่นเกมสล็อตออนไลน์ เพราะเป็น ค่ายเกมที่มีชื่อเสียง ด้าน กราฟิก ความ ลื่นไหล และ โอกาสรับกำไรที่ดี เกมของ PG ผลิตโดยค่ายมาตรฐาน ที่รองรับการเล่นทั้งบน โทรศัพท์มือถือ และ คอมพิวเตอร์
ข้อดี ของ สล็อต PG
pg slot เป็นเกมสล็อตออนไลน์ที่ออกแบบมาให้ โหลดเร็ว เล่นผ่าน ระบบออนไลน์ และรองรับ ทุกอุปกรณ์ ไม่ต้องดาวน์โหลดแอป ผู้เล่นสามารถเข้าเล่นผ่าน หน้าเว็บ ได้ทันที ภาพและเสียงถูกพัฒนาในรูปแบบ สามมิติ ให้ความคมชัด พร้อมเอฟเฟกต์ สวยงาม
คุณสมบัติหลักของเกม pg slot ได้แก่
มีรอบโบนัสให้ลุ้นบ่อย
ฟีเจอร์ตัวคูณรางวัล
โหมดทดลองเล่นฟรี
ใช้งานภาษาไทยง่าย
ฝากถอนง่าย ทันใจ
แพลตฟอร์ม สล็อต PG โดยทั่วไปให้บริการ การฝาก-ถอน ออโต้ตลอด 24 ชม. ขั้นต่ำเริ่มต้นเพียง 1 บาท ขึ้นอยู่กับ เงื่อนไขของเว็บไซต์ การทำรายการใช้เวลา เพียงไม่กี่วินาที ผ่าน QR Code หรือระบบ ธนาคารบนมือถือ ทำให้ธุรกรรมเป็นไปอย่าง ลื่นไหล
หมวดเกมฮิต ใน pg slot
เกม สล็อต PG มีธีมหลากหลาย เช่น
ธีม แฟนตาซี
ธีม Adventure
ธีม เอเชียและโชคลาภ
ธีม สัตว์และธรรมชาติ
หลายคนชอบเกมที่โบนัสเข้าไว พร้อมระบบ โบนัสรอบพิเศษ และ ระบบจ่ายคุ้มค่า เหมาะกับทั้ง คนเพิ่งเล่น และ ผู้เล่นที่มีประสบการณ์
ความปลอดภัย
PG Slot ใช้ระบบที่ได้มาตรฐาน มีการ เข้ารหัสข้อมูล และใช้ระบบสุ่มผล ระบบสุ่มมาตรฐาน เพื่อให้ผลลัพธ์ ตรวจสอบได้ แพลตฟอร์มที่ให้บริการ pg slot ควรมี ระบบดูแลข้อมูล
บทสรุปท้ายบท
pg slot เป็นตัวเลือกยอดนิยมสำหรับผู้ที่ต้องการเล่นสล็อตออนไลน์ ด้วยจุดเด่นด้าน กราฟิกคุณภาพ และการทำธุรกรรมที่ ทันใจ ผู้เล่นสามารถเริ่มต้นได้ ไม่ซับซ้อน ฝากถอนสะดวก และเลือกเกมได้ ครบทุกหมวด เหมาะสำหรับ ทุกระดับประสบการณ์ ในโลกของเกมสล็อตออนไลน์
แพลตฟอร์ม TKBNEKO มอบมิติใหม่ของการเดิมพันออนไลน์ ฝาก-ถอนไว ด้วยระบบสแกน QR Code
ในยุคที่ โลกออนไลน์พัฒนาอย่างรวดเร็ว TKBNEKO พร้อมยกระดับมาตรฐานการเดิมพัน ด้วยระบบการให้บริการที่ อัปเดตตลอดเวลา รวดเร็ว และ โปร่งใส พร้อมต้อนรับสมาชิกทุกท่านสู่ ประสบการณ์ความบันเทิงรูปแบบใหม่ ที่ ใครๆ ก็เป็นเถ้าแก่ได้
เหตุผลที่ควรเลือก TKBNEKO
TKBNEKO มุ่งมั่นที่จะมอบประสบการณ์จากเกมลิขสิทธิ์แท้ โดยเฉพาะเกมที่ ผ่านการรับรองจากสถาบันที่น่าเชื่อถือ และ ได้รับการยอมรับมากที่สุดในอุตสาหกรรม เพื่อให้ผู้เล่นทุกคน มั่นใจ ได้ว่า จะได้รับความเพลิดเพลินกับเกมที่ โปร่งใส ปลอดภัย และ มีคุณภาพสูง
จุดเด่นของระบบฝาก-ถอน
เรามุ่งเน้นความสะดวกของผู้เล่น เพื่อให้คุณ เพลิดเพลินกับการเดิมพันอย่างต่อเนื่อง
ฝากขั้นต่ำ: เพียง 1 บาท
ถอนขั้นต่ำ: ขั้นต่ำ 1 บาท
เวลาฝากเงิน: ใช้เวลาเพียง 3 วินาที
ยอดจำกัดการถอน: ไม่มียอดจำกัดต่อวัน
ฝากง่าย เพียงสแกน QR Code
เพียงคุณสแกน QR Code ระบบของเราจะ ดำเนินการฝากเงินให้อัตโนมัติ ขั้นต่ำเพียง เริ่มต้น 100 บาท และสามารถฝากได้สูงถึง 500,000 บาท เริ่มต้นได้ทันที กับ TKBNEKO ที่ ตอบโจทย์การเดิมพันยุคใหม่
เกมยอดนิยมรวมไว้ในที่เดียว
แพลตฟอร์มของเราครอบคลุมทุกแนวเกม รองรับทุกความชอบของผู้เล่น
สล็อต: แจ็คพอตแตกง่าย ลุ้นได้ทุกวัน
เกมสด: สัมผัสประสบการณ์คาสิโนแบบเรียลไทม์
กีฬา: วางเดิมพันกีฬาหลากหลายรายการ
ยิงปลา: เกมยิงปลาสุดมันส์ ได้เงินจริง
ติดตามโปรโมชั่นและสิทธิพิเศษ
อย่าลืมแวะมาเยี่ยมชมที่หน้า โปรโมชั่น เพื่อรับ สิทธิพิเศษมากมาย ที่เรามอบให้สมาชิกทุกท่าน นอกจากนี้ยังมีระบบ VIP สำหรับลูกค้าคนสำคัญ และช่องทาง พันธมิตร สำหรับผู้ที่สนใจสร้างรายได้ร่วมกับเรา
ติดต่อเรา
หากมี คำถาม หรือ ข้อเสนอแนะ สามารถติดต่อทีมงานของเราได้ตลอด 24 ชั่วโมงที่หน้า ศูนย์ช่วยเหลือ และ ส่งความคิดเห็น ทีมงาน ของเรา ยินดีให้บริการทุกท่านด้วยใจ
мгновенный вывод из запоя Алматы
В Алматы помощь при выводе из запоя доступна круглосуточно.
Далее составляется персонализированная схема детоксикации и назначается поддерживающее лечение для нормализации показателей.
После вывода из запоя предлагаются программы реабилитации и сопровождения для снижения риска рецидива.
Выбор клиники или службы следует делать на основании лицензий, отзывов и опыта специалистов.
каркасные дома под ключ в спб цены — отличный выбор для комфортного и экономичного загородного жилья.
Эти дома востребованы как для постоянного проживания, так и для сезонного использования.
Конструкция каркасного дома состоит из стоек, ригелей, обвязок и горбылей.
Грамотная теплоизоляция делает каркасные дома энергоэффективными и комфортными для проживания.
Соблюдение технологических требований и регулярный уход продлевают срок службы каркасного дома.
Основу каркасного дома составляют вертикальные и горизонтальные элементы, соединённые между собой в прочную систему.
Строительство надежного каркасный дом под ключ в спб — выгодное решение для загородного жилья.
Такая технология позволяет экономить бюджет и ускорять ввод жилья в эксплуатацию без потери комфорта.
Именно из-за вариативности планировки такие дома популярны у тех, кто меняет образ жизни.
Комбинация утепления и защиты от влаги обеспечивает стабильную температуру и хорошую воздухопроницаемость.
Современные материалы повышают энергоэффективность каркасных домов.
Небольшой вес конструкции позволяет использовать простые и недорогие типы фундаментов.
Заказчику проще контролировать соответствие работ проекту и стандартам.
Для надежности требуется инвестировать в качественные материалы и профессиональный монтаж.
В итоге каркасный дом — практичное и экономичное решение для частного жилья при соблюдении технологий.
Посетите детейлинг салона, чтобы вернуть вашему автомобилю безупречный вид и защитить его покрытие на долгие годы.
Мы объясняем клиентам, какие работы необходимы именно их автомобилю, и даём рекомендации по дальнейшему обслуживанию.
В ходе детейлинга проводится дотошная химчистка салона с уходом за текстилем и кожей.
С помощью полировки убирают следы контактов и возвращают глубину цвета лакокрасочному покрытию.
Такие процедуры дополняют общий уход и могут положительно сказаться на рыночной цене транспортного средства.
Монтаж плёнок выполняют с точным подгонкой по контурам кузова для незаметного результата.
Результатом становится уменьшение посторонних шумов и комфортная атмосфера внутри автомобиля.
Кроме того, центры часто предлагают абонементы и программы лояльности для постоянных клиентов.
Хороший детейлинг центр гарантирует экономию времени владельца и долговечность полученного эффекта.
Программы обслуживания делают регулярный детейлинг более доступным и удобным для владельцев.
Ищете идеальный вариант для строительства — ознакомьтесь с готовые проекты домов купить и выберите подходящий проект.
Необходимо принимать во внимание архитектурные ограничения и местные строительные нормы.
Ищете надежный ножи складные автоматический для каждодневного использования — у нас широкий выбор моделей с прочной стали и удобной рукоятью.
Выбор материалов и тщательность сборки определяют срок службы инструмента и уровень его надежности.
Несоблюдение рекомендаций по хранению и эксплуатации повышает вероятность случайного раскрытия и ускоренного износа механизмов.
Нержавеющая сталь лезвия гарантирует устойчивость к ржавчине и облегчает уход за инструментом.
Применение подходящих смазочных материалов продлевает срок службы пружин и осевых частей, предотвращая коррозию и износ.
Нужна срочная помощь? Закажите вскрыть авто — профессионалы прибудут быстро и вскроют замок без повреждений.
Часто мастера оглашают базовый прайс, но итоговая сумма может увеличиться при сложных работах.
По окончании процедуры стоит убедиться, что замки функционируют и двери закрываются плотно.
Ищете, где макетная плата купить? Посетите беспаечная макетная плата для выгодных предложений.
Покупка макетной платы — важный этап в подготовке электронного проекта.
Для учебных проектов и экспериментов такие платы идеальны.
Количество рядов и колонок на безпайковой плате задает возможности для больших схем.
Маркетплейсы часто имеют выгодные предложения и быструю доставку.
Они позволяют многократно менять соединения без пайки.
3d забор изготовление установлен быстро и аккуратно, обеспечивая надежную защиту участка и эстетичный вид.
Технологии производства и используемые материалы справляются с воздействием погодных условий.
Установка 3D заборов проводится оперативно, что уменьшает сроки строительства.
Варианты дизайна 3D заборов разнообразны по форме и цветовой гамме.
В то же время такие заборы не теряют своих защитных свойств и прочности.
Прочное покрытие и материал уменьшают расходы на эксплуатацию и ремонт.
Профилактика и мелкий ремонт продлевают работоспособность ограждения.
Такие ограждения эффективно сдерживают доступ посторонних, сохраняя проницаемость взгляда.
Таким образом, 3D заборы являются оптимальным выбором для баланса красоты и защиты участка.
สล็อต
แพลตฟอร์ม TKBNEKO เปิดประสบการณ์ใหม่แห่งการเดิมพันออนไลน์ ธุรกรรมรวดเร็ว ด้วยระบบสแกน QR Code
ในยุคดิจิทัลที่ โลกออนไลน์เติบโตต่อเนื่อง TKBNEKO พร้อมยกระดับการให้บริการ ด้วยระบบที่ ล้ำสมัย รวดเร็ว และ โปร่งใส เพื่อให้ผู้เล่น อุ่นใจ ทุกครั้งที่ใช้งาน
ระบบการเงินที่ใช้งานง่าย
ฝากขั้นต่ำ: เริ่มต้น 1 บาท
ถอนขั้นต่ำ: 1 บาท
เวลาฝากเงิน: ใช้เวลาเพียง 3 วินาที
ยอดถอน: ไม่จำกัดต่อวัน
ฝากง่าย เพียงสแกน QR Code
สแกน คิวอาร์ ระบบจะ โอนเงินเข้าทันที ขั้นต่ำ 100 บาท สูงสุด ไม่เกิน 500,000 บาทต่อครั้ง
หมวดหมู่เกม
สล็อต: ลุ้นแจ็คพอต
เกมสด: คาสิโนเรียลไทม์
กีฬา: เดิมพันลีกดัง
ยิงปลา: ลุ้นกำไรทันที
โบนัสและโปรโมชัน
ติดตามหน้า โบนัส พร้อมระบบ VIP และโปรแกรม พันธมิตร
ฝ่ายบริการลูกค้า
สอบถามข้อมูลได้ตลอด 24 ชั่วโมง ผ่านหน้า ติดต่อเรา ทีมงาน ของเรา พร้อมดูแลตลอดเวลา
ทดลองเล่นสล็อต pg ไม่ เด้ง
pg slot แพลตฟอร์มเกมสล็อตยอดนิยม เล่นง่าย ฝากถอนเร็ว
คำค้นหา PG Slot มาแรงในช่วงนี้ ในกลุ่มผู้เล่นเกมสล็อตออนไลน์ เพราะเป็น แบรนด์เกมที่โดดเด่น ด้าน ภาพและเอฟเฟกต์ ความ เสถียร และ ระบบจ่ายที่ดึงดูด เกมของ PG พัฒนาโดยผู้ให้บริการชั้นนำ ที่รองรับการเล่นทั้งบน สมาร์ทโฟน และ เดสก์ท็อป
จุดเด่น ของ pg slot
สล็อต PG เป็นเกมสล็อตออนไลน์ที่ออกแบบมาให้ โหลดเร็ว เล่นผ่าน ระบบเว็บ และรองรับ ทุกแพลตฟอร์ม ไม่ต้องติดตั้งเพิ่มเติม ผู้เล่นสามารถเข้าเล่นผ่าน หน้าเว็บ ได้ทันที ภาพและเสียงถูกพัฒนาในรูปแบบ 3D ให้ความคมชัด พร้อมเอฟเฟกต์ จัดเต็ม
คุณสมบัติหลักของเกม pg slot ได้แก่
โบนัสและฟรีสปินหลายแบบ
Multiplier
เล่นฟรีก่อนเติมเงิน
รองรับภาษาไทยเต็มรูปแบบ
ระบบฝากถอนสะดวก ทันใจ
แพลตฟอร์ม สล็อต PG โดยทั่วไปให้บริการ การฝาก-ถอน อัตโนมัติ 24 ชั่วโมง ขั้นต่ำเริ่มต้นเพียง หลักหน่วย ขึ้นอยู่กับ ระบบของผู้ให้บริการ การทำรายการใช้เวลา ไม่กี่วินาที ผ่าน สแกน QR หรือระบบ แอปธนาคาร ทำให้ธุรกรรมเป็นไปอย่าง ลื่นไหล
ประเภทเกมยอดนิยม ใน PG Slot
เกม PG Slot มีธีมหลากหลาย เช่น
ธีม แฟนตาซี
ธีม Adventure
ธีม เอเชียและโชคลาภ
ธีม สัตว์และธรรมชาติ
หลายคนชอบเกมที่โบนัสเข้าไว พร้อมระบบ โบนัสรอบพิเศษ และ อัตราการจ่ายที่สูง เหมาะกับทั้ง คนเพิ่งเล่น และ ผู้เล่นมือโปร
ความปลอดภัย
สล็อต PG ใช้ระบบที่ได้มาตรฐาน มีการ ปกป้องข้อมูลผู้เล่น และใช้ระบบสุ่มผล ระบบสุ่มมาตรฐาน เพื่อให้ผลลัพธ์ โปร่งใส แพลตฟอร์มที่ให้บริการ pg slot ควรมี ระบบดูแลข้อมูล
โดยภาพรวม
PG Slot เป็นตัวเลือกยอดนิยมสำหรับผู้ที่ต้องการเล่นสล็อตออนไลน์ ด้วยจุดเด่นด้าน โบนัสหลากหลาย และการทำธุรกรรมที่ ทันใจ ผู้เล่นสามารถเริ่มต้นได้ ง่าย ฝากถอนสะดวก และเลือกเกมได้ ครบทุกหมวด เหมาะสำหรับ ทั้งมือใหม่และมือโปร ในโลกของเกมสล็อตออนไลน์
ทดลองเล่นสล็อต pg ซื้อฟรีสปิน
Ищете надёжный рабочий инструмент — настольные пк цены, где вы найдёте лучшие варианты по соотношению цена — качество.
Первый этап покупки компьютера заключается в определении бюджета и задач, которые он должен выполнять.
Выбор между ноутбуком и стационарным компьютером зависит от мобильности и производительности. Если нужна мобильность — выбирают ноутбук, если высокая производительность — стационарный ПК.
Следующий этап — выбор ключевых компонентов: процессора, оперативной памяти и видеокарты. На следующем этапе выбирают основные компоненты: CPU, оперативную память и GPU.
Для игр и графики критична мощная видеокарта, тогда как для офисных задач достаточно интегрированной графики. Свободные разъёмы и слоты полезны для периферии и последующих модернизаций.
Не менее важны накопители и скорость хранения данных при покупке компьютера. SSD даст высокую скорость работы системы, тогда как HDD пригодится для хранения больших объёмов данных.
Учтите также резервное копирование и безопасность данных в выбранной конфигурации. Учтите также резервное копирование и безопасность данных в выбранной конфигурации.
Наконец, определитесь с местом и условиями покупки компьютера. Официальный магазин даёт гарантию и поддержку, а частные продавцы могут предложить более низкие цены.
Сравнивайте предложения и читайте отзывы перед окончательным выбором. Взвешенный подход сократит стресс и обеспечит довольство от использования техники в долгосрочной перспективе.
тройное кодирование алматы
В лечебных учреждениях сочетают медицинский контроль, психотерапию и социальную адаптацию.
Варианты лечения включают медикаментозную поддержку и психотерапию. Лекарственная терапия применяется для облегчения абстинентного синдрома и снижения риска рецидива.
Реабилитация в Алматы предлагает стационарные и амбулаторные программы с разной продолжительностью. Длительные программы рассчитаны на глубокую психологическую реабилитацию и восстановление навыков жизни без алкоголя.
Многие центры предлагают сопровождение после выписки. Дистанционные сервисы помогают своевременно получить совет и предотвратить срыв.
Критерии выбора клиники в Алматы включают лицензии, квалификацию персонала и отзывы пациентов. Наличие лицензии и аккредитации подтверждает законность и качество услуг.
План лечения должен быть индивидуальным и гибким. Программы корректируются по мере прогресса и изменений в состоянии пациента.
Профилактика рецидивов является ключевой частью реабилитации от алкоголизма. Обучение стратегиям избегания триггеров и управлению стрессом снижает риск срывов.
Заключение подчеркивает, что лечение алкоголизма в Алматы доступно и разнообразно. Комплексный подход с мультимодальными методами обеспечивает лучшие результаты при лечении.
Нужная партия напитков доставляется быстро и надежно алкоголь на дом круглосуточно.
Онлайн-сервисы демонстрируют большой ассортимент: пиво, вино, крепкие напитки и редкие позиции от независимых производителей.
инфузионная терапия с витаминами группы б астана
В Астане пациенты могут выбрать между амбулаторным и стационарным сопровождением при выводе из запоя.
После этого вводятся инфузионные медикаменты, витаминно-минеральные комплексы и препараты для детоксикации.
Вовлечение родных является ключевым элементом поддержки и контроля после процедуры.
Стоимость услуги варьируется в зависимости от применяемых методов, времени нахождения под наблюдением и исследований.
лечение тяжелой наркомании алматы — профессиональная помощь и комплексные программы для лечения наркомании в Алматы.
Профилактические меры против рецидива интегрированы в долгосрочную программу помощи.
нарколог на дом астана
Лечение алкоголизма в Астане требует комплексного подхода, сочетающего медицинскую помощь и психологическую поддержку.
Квалифицированные специалисты применяют методы с доказанной эффективностью, включая КПТ.
Медикаментозная терапия направлена на контроль тяги и восстановление физического состояния.
Выявление сопутствующих проблем здоровья в начале терапии улучшает прогноз реабилитации.
Сопровождение после завершения курса повышает вероятность длительной ремиссии.
Контакты с муниципальными и частными сервисами упрощают доступ к реабилитационным ресурсам.
Профилактические меры считаются важной составляющей долгосрочной программы по лечению алкоголизма.
Создание благоприятной домашней среды уменьшает вероятность повторного употребления алкоголя.
Планируете служить по контракту? Узнайте подробности о единовременная выплата контракта сво нижний новгород — все условия, выплаты и запись в Нижнем Новгороде.
В завершение рекомендуется согласовать все приложения и спецификации, прилагаемые к контракту.
контракт на сво волгоград условия
Важно учитывать местные особенности законодательства Волгограда при составлении такого контракта.
Четко прописанные условия помогают избежать недоразумений и судебных разбирательств.
Специалист выработает грамотные формулировки для распределения прав и обязательств и выявления рисков.
Когда все пункты проверены и согласованы, стороны подписывают контракт и начинают его исполнение.
Нужный гостям напиток можно быстро и удобно получить с помощью купить алкоголь круглосуточно.
За последние годы доставка алкоголя кардинально изменила привычный формат покупок и обслуживания.
Раздел 2.
Регулирование торговли алкоголем в интернете отличается в разных регионах.
Раздел 3.
Наличие гарантий возврата и обмена укрепляет доверие покупателей.
Раздел 4.
Услуга доставки алкоголя расширяет возможности проведения мероприятий и работы ресторанов.
Ищете надёжный рабочий инструмент — готовые пк купить, где вы найдёте лучшие варианты по соотношению цена — качество.
Первый шаг при желании купить компьютер — определить бюджет и задачи, которые он должен решать.
Выбор между ноутбуком и стационарным компьютером зависит от мобильности и производительности. Если нужна мобильность — выбирают ноутбук, если высокая производительность — стационарный ПК.
Следующий этап — выбор ключевых компонентов: процессора, оперативной памяти и видеокарты. Память оперативная влияет на способность системы удерживать множество задач одновременно.
Для игр и графики критична мощная видеокарта, тогда как для офисных задач достаточно интегрированной графики. Запас по набрeмам и разъёмам обеспечит удобство подключения периферии и апгрейда.
Не менее важны накопители и скорость хранения данных при покупке компьютера. Комбинация SSD под ОС и HDD для архивов является распространённым решением.
Учтите также резервное копирование и безопасность данных в выбранной конфигурации. Автоматическое резервирование и антивирусная защита важны для сохранности информации.
Наконец, определитесь с местом и условиями покупки компьютера. Тщательная проверка комплектации, документов и правил возврата необходима при покупке.
Сравнивайте предложения и читайте отзывы перед окончательным выбором. Сравнивайте предложения и читайте отзывы перед окончательным выбором.
เว็บไซต์ TKBNEKO มอบมิติใหม่ของการเดิมพันออนไลน์ ธุรกรรมฉับไว ด้วยระบบสแกน QR Code
ในยุคที่ เทคโนโลยีเปลี่ยนวิถีการเดิมพันออนไลน์ไปอย่างสิ้นเชิง TKBNEKO ขอเป็นส่วนหนึ่งในการปฏิวัติวงการเกม ด้วยระบบการให้บริการที่ ทันสมัย เสถียร และ ชัดเจน พร้อมต้อนรับสมาชิกทุกท่านสู่ มิติใหม่แห่งความสนุก ที่ ใครๆ ก็เป็นเถ้าแก่ได้
เพราะอะไรหลายคนจึงเลือก TKBNEKO
แพลตฟอร์มของเรารวบรวมเกมที่ได้มาตรฐาน โดยเฉพาะเกมที่ มีใบรับรองอย่างถูกต้อง และ ได้มาตรฐานสากล เพื่อให้ผู้เล่นทุกคน อุ่นใจ ได้ว่า จะได้รับความเพลิดเพลินกับเกมที่ โปร่งใส ข้อมูลไม่รั่วไหล และ มีคุณภาพสูง
ข้อดีของธุรกรรมบนแพลตฟอร์ม
เราออกแบบระบบการเงินให้ง่ายและเร็วที่สุด เพื่อให้คุณ เล่นเกมได้แบบไม่สะดุด
ฝากขั้นต่ำ: เริ่มต้นเพียง 1 บาท
ถอนขั้นต่ำ: 1 บาท
เวลาฝากเงิน: ใช้เวลาเพียง 3 วินาที
ยอดจำกัดการถอน: ไม่มีลิมิตการถอนรายวัน
เติมเงินง่ายด้วย QR Code
เพียงคุณสแกน โค้ดคิวอาร์ ระบบของเราจะ ประมวลผลอย่างรวดเร็ว ขั้นต่ำเพียง อย่างน้อย 100 บาท และสามารถฝากได้สูงถึง 500,000 บาท เริ่มต้นได้ทันที กับ แพลตฟอร์มของเรา ที่ ใช้งานง่าย ทำกำไรได้รวดเร็ว
คลังเกมคุณภาพ
แพลตฟอร์มของเราครอบคลุมทุกแนวเกม รองรับทุกความชอบของผู้เล่น
สล็อต: หลากหลายธีม แจ็คพอตรอคุณอยู่
เกมสด: ดีลเลอร์ถ่ายทอดสดตลอดเวลา
กีฬา: วางเดิมพันกีฬาหลากหลายรายการ
ยิงปลา: ลุ้นกำไรจากเกมยิงปลา
รับโบนัสและข้อเสนอสุดคุ้ม
อย่าลืมแวะมาเยี่ยมชมที่หน้า โบนัส เพื่อรับ ของรางวัลพิเศษ ที่เรามอบให้สมาชิกทุกท่าน นอกจากนี้ยังมีระบบ สมาชิกวีไอพี สำหรับลูกค้าคนสำคัญ และช่องทาง พันธมิตร สำหรับผู้ที่สนใจสร้างรายได้ร่วมกับเรา
ช่องทางติดต่อ
หากมี ปัญหา หรือ ความคิดเห็น สามารถติดต่อทีมงานของเราได้ตลอด 24 ชั่วโมงที่หน้า ติดต่อเรา และ ข้อเสนอแนะ ทีมงาน TKBNEKO ยินดีให้บริการทุกท่านด้วยใจ
pg slot สล็อตยอดฮิต ใช้งานง่าย ฝากถอนรวดเร็ว
คำค้นหา สล็อต PG ถูกค้นหามากขึ้นเรื่อยๆ ในกลุ่มผู้เล่นเกมสล็อตออนไลน์ เพราะเป็น ผู้ให้บริการเกมสล็อตที่มาแรง ด้าน งานภาพคุณภาพสูง ความ ลื่นไหล และ โอกาสรับกำไรที่ดี เกมของ PG พัฒนาโดยผู้ให้บริการชั้นนำ ที่รองรับการเล่นทั้งบน สมาร์ทโฟน และ พีซี
ข้อดี ของ pg slot
สล็อต PG เป็นเกมสล็อตออนไลน์ที่ออกแบบมาให้ เปิดเกมได้ทันที เล่นผ่าน ระบบเว็บ และรองรับ ทุกแพลตฟอร์ม ไม่ต้องดาวน์โหลดแอป ผู้เล่นสามารถเข้าเล่นผ่าน เว็บเบราว์เซอร์ ได้ทันที ภาพและเสียงถูกพัฒนาในรูปแบบ สามมิติ ให้ความคมชัด พร้อมเอฟเฟกต์ จัดเต็ม
คุณสมบัติหลักของเกม PG Slot ได้แก่
ระบบโบนัสและฟรีสปินหลากหลายรูปแบบ
ระบบตัวคูณ
โหมดทดลองเล่นฟรี
มีเมนูภาษาไทย
ระบบฝากถอนสะดวก ไม่ต้องรอนาน
แพลตฟอร์ม สล็อต PG มักมี การฝาก-ถอน อัตโนมัติ 24 ชั่วโมง ขั้นต่ำเริ่มต้นเพียง 1 บาท ขึ้นอยู่กับ ระบบของผู้ให้บริการ การทำรายการใช้เวลา เพียงไม่กี่วินาที ผ่าน QR Code หรือระบบ Mobile Banking ทำให้ธุรกรรมเป็นไปอย่าง ไม่สะดุด
แนวเกมที่คนเล่นเยอะ ใน pg slot
เกม pg slot มีธีมหลากหลาย เช่น
ธีม เทพเจ้า
ธีม ผจญภัย
ธีม โชคลาภ
ธีม สัตว์และธรรมชาติ
เกมยอดนิยมมักเป็นเกมที่แตกง่าย พร้อมระบบ ฟีเจอร์พิเศษ และ โอกาสทำกำไรสูง เหมาะกับทั้ง ผู้เล่นเริ่มต้น และ ผู้เล่นมือโปร
มาตรฐานระบบ
PG Slot มีมาตรฐานรองรับ มีการ ปกป้องข้อมูลผู้เล่น และใช้ระบบสุ่มผล ระบบสุ่มมาตรฐาน เพื่อให้ผลลัพธ์ ยุติธรรม แพลตฟอร์มที่ให้บริการ สล็อต PG ควรมี ทีมซัพพอร์ต 24 ชม.
บทสรุปท้ายบท
สล็อต PG เป็นตัวเลือกยอดนิยมสำหรับผู้ที่ต้องการเล่นสล็อตออนไลน์ ด้วยจุดเด่นด้าน กราฟิกคุณภาพ และการทำธุรกรรมที่ ทันใจ ผู้เล่นสามารถเริ่มต้นได้ ไม่ซับซ้อน ฝากถอนสะดวก และเลือกเกมได้ ครบทุกหมวด เหมาะสำหรับ ทุกระดับประสบการณ์ ในโลกของเกมสล็อตออนไลน์
https://medium.com/@ratypw/ทดลองเล่นสล็อต-pg-70cdb1132344
ทดลองเล่นสล็อต pg ฟรี PG Slot สล็อตยอดฮิต เข้าเล่นไว ฝากถอนออโต้
คำค้นหา PG Slot กำลังได้รับความนิยมอย่างต่อเนื่อง ในกลุ่มผู้เล่นเกมสล็อตออนไลน์ เพราะเป็น ค่ายเกมที่มีชื่อเสียง ด้าน กราฟิก ความ นิ่งไม่สะดุด และ โอกาสรับกำไรที่ดี เกมของ PG ผลิตโดยค่ายมาตรฐาน ที่รองรับการเล่นทั้งบน สมาร์ทโฟน และ คอมพิวเตอร์
ข้อดี ของ pg slot
สล็อต PG เป็นเกมสล็อตออนไลน์ที่ออกแบบมาให้ เข้าเกมไว เล่นผ่าน ระบบเว็บ และรองรับ ทั้ง iOS และ Android ไม่ต้องติดตั้งเพิ่มเติม ผู้เล่นสามารถเข้าเล่นผ่าน เว็บเบราว์เซอร์ ได้ทันที ภาพและเสียงถูกพัฒนาในรูปแบบ เอฟเฟกต์ 3 มิติ ให้ความคมชัด พร้อมเอฟเฟกต์ สมจริง
คุณสมบัติหลักของเกม สล็อต PG ได้แก่
ระบบโบนัสและฟรีสปินหลากหลายรูปแบบ
Multiplier
เล่นฟรีก่อนเติมเงิน
มีเมนูภาษาไทย
ระบบการเงินรวดเร็ว ทำรายการไว
แพลตฟอร์ม สล็อต PG มักมี การฝาก-ถอน ฝากถอนตลอดเวลา ขั้นต่ำเริ่มต้นเพียง 10 บาท ขึ้นอยู่กับ เงื่อนไขของเว็บไซต์ การทำรายการใช้เวลา รวดเร็วมาก ผ่าน คิวอาร์โค้ด หรือระบบ แอปธนาคาร ทำให้ธุรกรรมเป็นไปอย่าง ไม่สะดุด
หมวดเกมฮิต ใน pg slot
เกม สล็อต PG มีธีมหลากหลาย เช่น
ธีม เทพเจ้าและแฟนตาซี
ธีม ผจญภัย
ธีม เอเชียและโชคลาภ
ธีม ธรรมชาติ
หลายคนชอบเกมที่โบนัสเข้าไว พร้อมระบบ ฟีเจอร์พิเศษ และ โอกาสทำกำไรสูง เหมาะกับทั้ง คนเพิ่งเล่น และ ผู้เล่นที่มีประสบการณ์
ความน่าเชื่อถือ
PG Slot มีมาตรฐานรองรับ มีการ รักษาความปลอดภัย และใช้ระบบสุ่มผล Random Number Generator เพื่อให้ผลลัพธ์ โปร่งใส แพลตฟอร์มที่ให้บริการ PG Slot ควรมี ทีมซัพพอร์ต 24 ชม.
สรุป
pg slot เป็นตัวเลือกยอดนิยมสำหรับผู้ที่ต้องการเล่นสล็อตออนไลน์ ด้วยจุดเด่นด้าน กราฟิกคุณภาพ และการทำธุรกรรมที่ รวดเร็ว ผู้เล่นสามารถเริ่มต้นได้ ไม่ซับซ้อน ฝากถอนสะดวก และเลือกเกมได้ หลากหลายแนว เหมาะสำหรับ ทุกระดับประสบการณ์ ในโลกของเกมสล็อตออนไลน์
Автозайм
Деньги с обеспечением ПТС в городе Самара — это вариант оформить средства под машину без продажи автомобиля и без долгих банковских процедур. Главная особенность такого займа — машина остаётся у владельца, а в залог оформляется лишь ПТС. Это даёт возможность продолжать пользоваться машиной, на протяжении договор займа.
Выдача денег происходит в день обращения. Заявка проверяется примерно за 15 мин, после чего выносится решение по сумме и условиям. Размер финансирования может достигать до 5 000 000 ?, а процентная ставка стартует с уровня 2% в месяц. Срок займа как правило достигает до 60 месяцев, по этой причине заёмщик может подобрать подходящий план платежей.
Процесс подачи заявки работает через интернет. Заёмщик оставляет форму, указывает данные автомобиля и желаемую сумму займа. После проверки документов приходит начальное решение. Чаще всего деньги выдаются в день оформления, после подписания договор.
Для расчёта условий применяется калькулятор займа. Например, при сумме 300 000 ? на срок 12 месяцев платёж в месяц составит около 33 057 ?. Итоговая сумма переплаты за весь срок составит примерно 96 684 ?. Итоговые параметры могут отличаться в зависимости от оценки автомобиля и выбранного срока кредитования.
На страницах сервиса автозаймов часто отображается онлайн-лента заявок. Она демонстрирует активность сервиса и примеры одобренных заявок по разным городам. К примеру, заявки на сумму 1 840 000 ? из Тулы, 1 890 000 ? из Москвы или 1 470 000 ? город Челябинск получают метку «Одобрено». Часть заявок находятся на этапе проверки — например такие суммы, 290 000 ? город Сочи или 720 000 ? из Екатеринбурга. Подобные разделы отображают текущую активность сервиса и число заявок за день и в текущем месяце.
Займ под залог ПТС подходит тем, кому требуется оперативно получить крупную сумму без продажи машины. Базовые параметры таких займов — ставка от 2% в месяц, одобрение примерно 15 минут, сумма до 5 000 000 ? и возможность оформить заявку через интернет. После подачи заявки заёмщик может дождаться решения, написать в мессенджер или связаться с менеджером для уточнения оформления.
rufus download Rufus is a lightweight, free, open source utility built to create bootable USB drives. It helps users prepare a USB flash drive that can install an operating system, run diagnostic tools, or boot into a recovery environment. The program works without installation and can be run immediately after downloading.
The main purpose of Rufus is to create bootable USB media from ISO images with speed and stability. This allows users to install or run operating systems directly from a USB flash drive without the need for DVDs. The tool supports a wide range of operating systems and service utilities, which makes it practical for both regular users and system administrators.
Rufus works on computers with Microsoft Windows, starting from Windows 7. Both 32-bit and 64-bit versions are supported, and there is also a version available for ARM64 architecture.
The software allows users to create bootable USB drives from many different ISO images. It can be used to prepare a USB drive for installing Windows 11, Windows 10, Windows 8.1, or Windows 7, as well as various Linux distributions. Rufus also works with DOS systems and other recovery or maintenance tools commonly used for troubleshooting computers.
One of the built-in features of Rufus is the ability to download official Windows ISO images directly from Microsoft servers. This allows users to obtain original installation images for Windows 8.1, Windows 10, and Windows 11 without searching for them on third-party websites.
In addition to creating bootable drives, Rufus can format USB devices. It supports several file systems including FAT32, NTFS, exFAT, UDF, and ReFS. This flexibility allows the USB drive to be prepared for different use cases and compatibility requirements.
Rufus supports both legacy BIOS systems and modern UEFI environments. Because of this, bootable drives created with Rufus can work on older computers as well as newer systems that use UEFI and Secure Boot.
Another feature included in Rufus is Windows To Go support. This option allows users to run a full Windows environment directly from a USB drive. It can be useful for testing systems, performing maintenance, or working on multiple computers without installing Windows on the internal drive.
Rufus also provides the option to bypass certain Windows 11 installation requirements. When creating an installation USB, the program can disable checks for TPM 2.0, Secure Boot, and minimum RAM requirements. This makes it possible to install Windows 11 on computers that would otherwise not meet the official hardware requirements.
One of the reasons Rufus has become popular is its speed and simplicity. The program is extremely small, about 1.9 MB in size, and runs as a portable application without installation. It is distributed under the GPL v3 open-source license, supports more than 70 languages, and contains no advertisements, bundled software, or tracking components.
Rufus works with a large number of ISO images. These include multiple versions of Windows, Windows Server editions, FreeDOS, and various system tools such as GParted, Hiren’s Boot CD, Parted Magic, and Clonezilla. Because of this wide compatibility, the program can be used not only for installing operating systems but also for disk management, data recovery, and system maintenance tasks.
To use Rufus, a computer running Windows 7 or later and a USB flash drive are required. The program does not need to be installed. Users simply download the executable file, run it, select the ISO image they want to use, and create a bootable USB drive. Due to its simplicity, speed, and reliability, Rufus remains one of the most widely used tools for creating bootable USB drives.
Закажите доставка алкоголя на дом москва прямо сейчас — быстро, удобно и легально.
Вместо похода в супермаркет многие предпочитают оформить заказ через приложение и получить напиток у двери.
Компаниям важно соблюдать законодательство и проверять возраст покупателей, чтобы исключить продажи несовершеннолетним.
Автоматизированные системы планирования маршрутов обеспечивают быструю доставку и уменьшают вероятность задержек.
Потребители обращают внимание на устойчивые практики: минимизация отходов и использование перерабатываемой упаковки.
Найдите проверенные капперы в нашем обзоре: лучшие капперы и их прогнозы
Опытные капперы служат надежным ориентиром в мире ставок и помогают избегать обмана.
Документы с результатами содержат список событий, используемые коэффициенты и полученные итоги.
Опытные капперы, допускающие внешнюю проверку результатов, вызывают больше доверия.
Ставьте умеренные суммы от общего бюджета и не отклоняйтесь от выбранной стратегии управления.
Опытные капперы служат надежным ориентиром в мире ставок и помогают избегать обмана.
Airdrop — это бесплатная раздача токенов проектом для продвижения и мотивации пользователей, подробнее о механике и рисках можно узнать на эйрдроп что это
Airdrop — это метод распределения криптовалютных токенов среди пользователей сети безвозмездно или за выполнение простых условий.
Существуют различные типы airdrop: классические раздачи, ретро-эйрдропы и приватные раздачи для избранных.
Airdrop предоставляет возможности, но также содержит потенциальные опасности для получателей.
Необходимо тщательно анализировать проект и его юридические аспекты до участия в airdrop.
Ищете лучшие приключения в сети? Посетите gta сервера и найдите идеальный сервер для захватывающей ролевой игры в GTA 5.
На вводных серверах объясняют основные механики и правила поведения в роли.
Этикет и соблюдение правил важны для комфортной игры всех участников.
Бизнесы приносят доход, но требуют управления и защиты от конкурентов.
Кастомные автомобили, анимации и сценарии добавляют уникальности серверу.
Откройте для себя новые ощущения в магазин для взрослых интернет, где качество, конфиденциальность и большой выбор гарантированы.
Секс-шопы сегодня стали общедоступными магазинами интимных товаров, предлагая широкий ассортимент для взрослых.
Ассортимент обычно включает вибраторы, массажёры, аксессуары для пар и средства по уходу за интимной зоной.
В интернет-каталогах покупатель найдёт технические характеристики и отзывы, позволяющие сравнить варианты и выбрать подходящий товар.
Нужно изучать материалы, сертификационные данные и инструкции по уходу, чтобы продлить срок службы и обезопасить использование.
поставщики товаров из китая предлагает выгодные условия карго-доставки из Китая в Россию для оптовых и розничных клиентов.
Важно сопоставить сроки, стоимость и риски для каждого доступного способа доставки.
Недостаток — длительность доставки, которая может растянуться на несколько недель.
Важно контролировать пересечение границы и время простоя на таможне.
Системы управления позволяют следить за статусом, оптимизировать маршруты и снизить вероятность ошибок.
Нужен быстрый и надёжный алкоголь доставка, чтобы вечер прошёл идеально.
За последние годы доставка алкогольной продукции превратилась в удобную и востребованную опцию для многих людей.
За соблюдение правил продажи алкоголя отвечают и магазины, и операторы логистики.
Качественная упаковка защищает стеклянную тару и обеспечивает презентабельность при передаче.
Частые отзывы клиентов помогают улучшать ассортимент и условия доставки.
pg slot สล็อตยอดฮิต ใช้งานง่าย ฝากถอนรวดเร็ว
คำค้นหา สล็อต PG มาแรงในช่วงนี้ ในกลุ่มผู้เล่นเกมสล็อตออนไลน์ เพราะเป็น แบรนด์เกมที่โดดเด่น ด้าน กราฟิก ความ นิ่งไม่สะดุด และ อัตราการจ่ายรางวัลที่น่าสนใจ เกมของ PG ผลิตโดยค่ายมาตรฐาน ที่รองรับการเล่นทั้งบน มือถือ และ พีซี
ข้อดี ของ สล็อต PG
pg slot เป็นเกมสล็อตออนไลน์ที่ออกแบบมาให้ โหลดเร็ว เล่นผ่าน ระบบอัตโนมัติ และรองรับ ทั้ง iOS และ Android เข้าเล่นผ่านเว็บได้เลย ผู้เล่นสามารถเข้าเล่นผ่าน หน้าเว็บ ได้ทันที ภาพและเสียงถูกพัฒนาในรูปแบบ เอฟเฟกต์ 3 มิติ ให้ความคมชัด พร้อมเอฟเฟกต์ จัดเต็ม
คุณสมบัติหลักของเกม PG Slot ได้แก่
โบนัสและฟรีสปินหลายแบบ
ฟีเจอร์ตัวคูณรางวัล
เดโม่ฟรี
มีเมนูภาษาไทย
ระบบการเงินรวดเร็ว ทันใจ
แพลตฟอร์ม สล็อต PG ส่วนใหญ่รองรับ การฝาก-ถอน ฝากถอนตลอดเวลา ขั้นต่ำเริ่มต้นเพียง 10 บาท ขึ้นอยู่กับ กติกาแต่ละแพลตฟอร์ม การทำรายการใช้เวลา ไม่กี่วินาที ผ่าน QR Code หรือระบบ แอปธนาคาร ทำให้ธุรกรรมเป็นไปอย่าง ต่อเนื่อง
แนวเกมที่คนเล่นเยอะ ใน PG Slot
เกม สล็อต PG มีธีมหลากหลาย เช่น
ธีม แฟนตาซี
ธีม Adventure
ธีม ความมั่งคั่ง
ธีม ธรรมชาติ
หลายคนชอบเกมที่โบนัสเข้าไว พร้อมระบบ Special Feature และ โอกาสทำกำไรสูง เหมาะกับทั้ง มือใหม่ และ สายสล็อตจริงจัง
ความน่าเชื่อถือ
PG Slot ใช้ระบบที่ได้มาตรฐาน มีการ ปกป้องข้อมูลผู้เล่น และใช้ระบบสุ่มผล Random Number Generator เพื่อให้ผลลัพธ์ ยุติธรรม แพลตฟอร์มที่ให้บริการ สล็อต PG ควรมี ความปลอดภัยสูง
บทสรุปท้ายบท
pg slot เป็นตัวเลือกยอดนิยมสำหรับผู้ที่ต้องการเล่นสล็อตออนไลน์ ด้วยจุดเด่นด้าน กราฟิกคุณภาพ และการทำธุรกรรมที่ ทันใจ ผู้เล่นสามารถเริ่มต้นได้ ง่าย ฝากถอนสะดวก และเลือกเกมได้ ครบทุกหมวด เหมาะสำหรับ ทั้งมือใหม่และมือโปร ในโลกของเกมสล็อตออนไลน์
ทดลองเล่นสล็อต pg ไม่ เด้ง
Ищете надежный самсунг галакси, соответствующий вашему бюджету и стилю?
Линейка смартфонов Samsung остаётся одной из самых влиятельных на рынке благодаря постоянным нововведениям и удобству использования.
Корпус и сборка выполнены на уровне премиальных стандартов, что обеспечивает устойчивость к износу и комфорт при использовании.
Приложения для обработки изображений и встроенные алгоритмы помогают пользователям получать качественные кадры без сложных настроек.
Батареи и опции быстрой зарядки обеспечивают длительную автономную работу и удобство при повседневном использовании.
Ищете надежные прогнозы? Ознакомьтесь с рейтинг капперов в телеграмме — здесь собраны проверенные капперы и отзывы о них.
Важно помнить о рисках и не рассматривать капперов как гарантию выигрыша, ибо ставки всегда связаны с вероятностью и неопределенностью.
Опытные капперы часто используют глубокий анализ команд, форму игроков и погодные условия, чтобы повысить точность своих прогнозов.
монтаж натяжного потолка цена предлагает широкий выбор современных и долговечных решений по установке и обслуживанию для вашего дома или офиса в Сочи.
Широкий выбор материалов и фактур делает такие потолки универсальными для разных стилей интерьера.
Процесс установки не требует длительной подготовки помещения и обычно завершается за один день.
Эконом-варианты хорошо справляются с покрытием потолка, а дорогие решения дают эффектный декоративный результат и опции подсветки.
Стоит заранее узнать, какие сроки гарантии предлагает компания и как решаются вопросы ремонта.
Натяжные потолки в Сочи становятся все более популярны среди владельцев квартир и домов.
Компания оказание услуг по охране труда предлагает комплексные решения для обеспечения безопасности и соблюдения требований трудового законодательства на вашем предприятии.
Современные фирмы формируют и применяют стандарты и инструкции, которые позволяют минимизировать опасности и предотвратить травмы на рабочем месте.
Оформление результатов оценки в документах гарантирует прозрачность работы и подтверждает принятые решения.
Регулярные тренинги и сертификации способствуют поддержанию компетентности и оперативной готовности при чрезвычайных обстоятельствах.
Вложения в современные безопасные технологии возвращаются через уменьшение простоев и затрат на медицинскую помощь пострадавшим.
Для строительства дорожного основания мы заказали стоимость 1 м3 щебня, чтобы обеспечить прочное и ровное покрытие.
Материал применяют для подсыпок, оснований дорог и тротуаров, а также в системах дренажа на участках.
Планируете обеспечить дачу автономной канализацией? септик на дачу цена с установкой — недорого и с гарантией качества.
Перед покупкой недорогого септика для дачи важно трезво оценить потребности вашего участка.
Выбор конструкции септика зависит от бюджета и условий участка.
Монтаж допустимо провести самостоятельно при наличии опыта, но безопаснее доверить работу мастерам.
Периодическая очистка и инспекция системы помогут избежать неисправностей и экологических проблем.
Ищете натяжные потолки цена — наши специалисты обеспечат качественный монтаж и выгодные цены.
Благодаря новым технологиям натяжные потолки отличаются долговечностью и эстетикой.
Широкая палитра цветов и текстур помогает гармонично вписать потолок в интерьер.
Анализ отзывов клиентов и примеров работ помогает сделать обоснованный выбор подрядчика.
Универсальность натяжных потолков делает их подходящими для квартир, домов и офисов.
Процесс монтажа отличается скоростью и отсутствием крупного строительного мусора.
Организуйте яркое и запоминающееся событие с аренда оборудования для мероприятия спб — мы предоставим профессиональное оборудование и поддержку на всех этапах подготовки.
Профессиональная установка сокращает риск сбоев во время мероприятия.
Компания сайт продвижение помогает бизнесам в Москве уверенно занимать верхние позиции в поисковой выдаче и привлекать целевых клиентов.
Следует обращать внимание на качество контента, техническую часть сайта и правильный подбор ключевых запросов.
Периодическое обновление и разнообразие контента усиливают вовлечённость и улучшают видимость сайта.
Корректная внутренняя ссылка и наличие карты сайта упрощают индексацию и улучшают навигацию.
Исходя из аналитики, следует править контент, технические настройки и стратегию ссылочного продвижения.
ทดลองเล่นสล็อต pg ไม่ เด้ง
Ищете надежные прогнозы? Ознакомьтесь с профессиональные капперы — здесь собраны проверенные капперы и отзывы о них.
Тестирование сервиса перед покупкой подписки помогает снизить риски и понять, насколько прогнозы соответствуют вашим ожиданиям.
При выборе каппера важно обращать внимание на историю его успехов и прозрачность результатов, опубликованных за длительный период.
Планируете обеспечить дачу автономной канализацией? самый дешевый септик для дачи цена — недорого и с гарантией качества.
Обязательно примите во внимание число пользователей и интенсивность водопотребления.
Форма и устройство септика подбираются исходя из бюджета и местных условий.
Экономия при самостоятельном монтаже достигается ценой вашего времени и наличия оборудования.
При выборе дешёвого варианта не забывайте учитывать последующие затраты на обслуживание.
Компания профессиональное продвижение сайтов помогает бизнесам в Москве уверенно занимать верхние позиции в поисковой выдаче и привлекать целевых клиентов.
Для старта продвижения необходим аудит сайта и чёткие, измеримые цели.
Контент играет решающую роль для привлечения и удержания аудитории.
Правильная внутренняя перелинковка и карта сайта облегчают индексацию и навигацию.
Данные аналитики служат основанием для изменения контента, технических настроек и политики по внешним ссылкам.
стоимость монтажа натяжного потолка предлагает широкий выбор современных и долговечных решений по установке и обслуживанию для вашего дома или офиса в Сочи.
Ассортимент материалов и текстур позволяет подобрать потолок под любой дизайн и требования.
Необходимая подготовка мала, поэтому монтаж натяжного потолка обычно завершает за день.
Перед выбором стоит учесть влажность и температурные особенности региона, чтобы материал служил долго.
Гарантия и послепродажное обслуживание играют важную роль при выборе компании в Сочи.
Важно учитывать климатические условия Сочи, чтобы материал не потерял качества со временем.
Ищете надежный купить тлф самсунг, соответствующий вашему бюджету и стилю?
Владельцы гаджетов хвалят яркие дисплеи, быстрые процессоры и плотную интеграцию с другими продуктами бренда.
Используемые материалы и сборка соответствуют уровням премиум-класса, гарантируя долговечность и надёжность.
Встроенные программные решения и интеллектуальная обработка снимков делают фотосъёмку доступной и эффективной.
Поддержка сетей нового поколения и улучшенная связь делают использование интернет-сервисов быстрым и надёжным.
Организуйте яркое и запоминающееся событие с [url=https://sopromeropriyaty.ru/]техническое оснащение мероприятий[/url] — мы предоставим профессиональное оборудование и поддержку на всех этапах подготовки.
Наличие различных входов и поддержка форматов упрощают подключение оборудования.
Ищете натяжной потолок — наши специалисты обеспечат качественный монтаж и выгодные цены.
Натяжные потолки в Краснодаре становятся всё более популярным решением для обновления интерьера.
Разнообразие фактур и цветов позволяет подобрать потолок под любой дизайн помещения.
Ясное соглашение по времени выполнения и гарантиям предотвращает возможные проблемы.
Легкость ухода и отсутствие сложных процедур по обслуживанию — ещё одно преимущество натяжных потолков.
Также следует уточнить сроки работ и условия гарантии, чтобы избежать недоразумений.
Для строительства дорожного основания мы заказали машина гравия, чтобы обеспечить прочное и ровное покрытие.
Щебень ценят за прочность, стойкость к морозам и долгий срок службы, благодаря чему он часто используется в дорожном и фундаментном деле.
Компания центр охраны труда предлагает комплексные решения для обеспечения безопасности и соблюдения требований трудового законодательства на вашем предприятии.
Эффективная система охраны труда снижает финансовые потери и повышает моральный дух коллектива.
Определение источников опасностей помогает расставить приоритеты в мерах по их ликвидации и смягчению последствий.
Подготовка и проведение инструктажей для работников являются базовыми составляющими охраны труда.
Внедрение СИЗ, блокировочных механизмов и ограждений ограничивает возможность контакта работников с опасностями.
ทดลองเล่นสล็อต pg ไม่ เด้ง
мелбет зеркало скачать на айфон
Установить приложение Melbet: APK, iPhone и ПК
Мобильная версия Melbet включает букмекерскую контору и казино в едином приложении. Доступны live-ставки, слоты, онлайн-трансляции, статистика и быстрые финансовые операции. Установка занимает 1–2 минуты.
Android (APK)
Скачайте APK с официального источника, откройте файл и завершите установку. Если требуется включите разрешение на установку из неизвестных источников, затем войдите в аккаунт.
iOS (iPhone)
Перейдите в App Store, найдите «Melbet», нажмите «Получить», после установки выполните вход.
ПК
Откройте официальный сайт, авторизуйтесь и создайте ярлык на рабочий стол. Браузерная версия функционирует как полноценное приложение.
Функционал
Live-ставки с мгновенным обновлением линии, казино и слоты, прямые трансляции, аналитические данные, push-оповещения, быстрая регистрация и поддержка 24/7.
Бонусы
После загрузки доступны бонус на первый депозит, акционные коды и фрибеты. Условия зависят от региона.
Безопасность
Скачивайте только с официального сайта, проверяйте домен, не сообщайте данные доступа третьим лицам и активируйте двухфакторную аутентификацию.
Загрузка выполняется быстро, после чего открывается полный доступ Melbet.
Ищете идеальный вариант для строительства? Ознакомьтесь с проект дома готовый и выберите свой идеальный проект.
Третий аспект — индивидуализация и дальнейшее сопровождение.
Если вы ищете идеальный трековый велосипед, ознакомьтесь с предложениями сколько стоит трековый велосипед и выберите модель по вкусу.
Колёса и ступицы тоже адаптированы для трека — они лёгкие и минимально деформируются при нагрузках.
Трековый велосипед — это особый тип велосипеда, рассчитанный исключительно на гонки по овальному треку.
Начните увлекательное обучение уже сегодня с занятия онлайн для детей по английскому — весело, эффективно и по авторской методике.
Коммуникативная практика в игровой форме тренирует навыки говорения и понимания на слух.
Строим надежный каркасные дома спб под ключ, чтобы вы наслаждались комфортом и экономией энергии круглый год.
Это уменьшает общие затраты и дает гибкость в выборе участка.
Современные системы позволяют контролировать влажность и качество воздуха.
Низкие затраты на этапе строительства позволяют быстрее восстановить инвестиции и улучшить жилье.
Тщательное планирование и профессиональное исполнение приведут к комфортному и долговечному дому.
Порадуйте гостей праздничной атмосферой — заказать шары доставят цвет и радость прямо к вашему порогу.
Воздушные шары добавляют празднику особенное настроение и оживляют любую обстановку.
Материал шаров влияет на их прочность и длительность полета, поэтому стоит выбирать проверенные бренды.
С помощью шаров легко создать тематическую композицию, соответствующую цветовой гамме и стилю мероприятия.
Оформление шарами доступно как профессионалам, так и любителям, и может стать отличным решением для семейных торжеств и корпоративных событий.
Спин-шаблон:
Шары отлично сочетаются с цветами, лентами и бумажными элементами, увеличивая выразительность оформления.
Если вы мечтаете о надежном и уютном каркасные дома спб, мы готовы реализовать ваш проект быстро и качественно.
Неправильная укладка утеплителя или некачественные стыки способны привести к появлению холодных зон и повышенным теплопотерям.
Если вы хотите летние шины купить в спб цены, то у нас вы найдете выгодные предложения и широкий ассортимент качественных моделей.
При выборе сервиса обратите внимание на опыт мастеров и наличие современного оборудования.
Посетите zeekr сайт и узнайте все подробности о новых моделях, комплектациях и ценах.
Zeekr — это современная марка электромобилей, создающая акцент на передовых технологиях и удобстве для водителя.
Обновления ПО доступны по воздуху, что позволяет улучшать функционал без посещения сервиса.
Дизайн Zeekr сочетает минимализм и футуристические элементы, привлекая молодых покупателей.
Brэнд стремится к сокращению отходов и повышению эффективности использования материалов в производстве.
Будущее Zeekr связано с расширением рынков и развитием инфраструктуры для зарядки.
Строим надежный дом каркасный под ключ, чтобы вы наслаждались комфортом и экономией энергии круглый год.
Фундамент для каркасного дома может быть легким и недорогим.
Необходимо также монтаж паро- и гидроизоляции для защиты конструкции.
Хорошая отделка и уход помогут сохранить изоляционные характеристики на длительный срок.
Хорошая проектная документация и гарантия работ обеспечат защиту инвестиций.
Начните увлекательное обучение уже сегодня с занятие английским языком для детей — весело, эффективно и по авторской методике.
Обучение через повторение и ассоциации облегчает запоминание новых слов и выражений.
плитка под кирпич для наружной отделки фасада идеально подходит для создания прочной и эстетичной облицовки дома, имитируя натуральный кирпич при минимальных затратах на монтаж и уход.
Она сочетает декоративный вид с практичностью и долговечностью.
Если вы ищете идеальный трековый велосипед, ознакомьтесь с предложениями карбоновый трековый велосипед и выберите модель по вкусу.
Регулярная проверка натяжения колеса, состояния подшипников и жёсткости рамы продлевает ресурс и обеспечивает безопасность.
Трековый велосипед представляет собой специализированный вид двухколёсного транспорта, созданный для гонок на велодромах.
Если вы мечтаете о надежном и уютном строительство каркасных домов в спб, мы готовы реализовать ваш проект быстро и качественно.
Каркас из прочных стоек и балок служит скелетом здания, на который монтируют ограждающие и отделочные слои.
Порадуйте гостей праздничной атмосферой — шары гелевые доставят цвет и радость прямо к вашему порогу.
Они бывают разных форм, размеров и цветов, что позволяет подобрать шары под любую тему и стиль события.
Для оформления фотозон и залов удобнее применять латексные наборы и ленты, а гелиевые шары ставят по краям и в центре.
Шары отлично сочетаются с цветами, лентами и бумажными элементами, увеличивая выразительность оформления.
Даже небольшая композиция из шаров придаст мероприятию завершённый вид и поднимет настроение гостям.
Спин-шаблон:
Планирование расположения шаров позволяет избежать помех и сохранить гармонию пространства, особенно в небольших залах.
Ищете идеальный вариант для строительства? Ознакомьтесь с купить готовый проект дома и выберите свой идеальный проект.
Готовые проекты не лишают возможности сделать дом уникальным и удобным.
bidik88
быстрое отрезвление алматы поможет быстро и безопасно организовать качественный вывод из запоя в Алматы.
Выбирая центр, обращайте внимание на профессионализм сотрудников, наличие сертификатов и подтвержденную эффективность программ.
лечение наркомании алматы — надежный путь к анонимному и профессиональному излечению от зависимости в Алматы.
В Алматы организация помощи при наркомании включает в себя комплекс мер, направленных на восстановление физического и психического здоровья.
В программу могут входить анксиолитики и средства, снижающие желание употреблять наркотики.
Индивидуальная терапия помогает выявить и устранить личностные причины зависимости.
Продолжительное участие в поддерживающих группах увеличивает устойчивость к соблазнам.
круглосуточная наркологическая помощь астана
При выборе клиники обращайте внимание на наличие лицензий, квалификацию персонала и отзывы бывших пациентов.
экстренная наркологическая помощь при запое астана
Долгосрочная психотерапия и сопровождение специалистов снижают вероятность рецидива после вывода из запоя.
Выбор между госпитализацией и домашним сопровождением определяется тяжестью состояния и наличием противопоказаний.
Если вы хотите быстро и выгодно оформить контракт на сво нижний новгород условия 2026, наши специалисты помогут с оформлением и ответят на все вопросы.
Следует уточнить сроки исполнения обязательств, меры ответственности и процедуру приёмки результата.
Бюджет контракта на СВО в Нижнем Новгороде должен включать подробную калькуляцию и механизм расчётов.
В контракте необходимо прописать критерии качества выполнения работ и стандарты контроля.
Также стоит предусмотреть порядок расторжения договора и условия возмещения убытков.
Закажите напитки к вечеру через заказать алкоголь с доставкой и получите заказ вовремя.
Программные решения для логистики обеспечивают быструю доставку и оптимальную маршрутизацию курьеров.
Доставка алкоголя в современном городе стала неотъемлемой частью городской жизни.
заключить контракт на сво в волгограде
Особое внимание уделяется разделам о гарантиях, приемке работ и порядке расчетов.
Нужный напиток уже в пути — доставка алкоголя ночью в москве.
Доставка алкоголя становится всё более популярной услугой в современных городах.
За несоблюдение норм предусмотрены санкции, вплоть до приостановки деятельности, потому компании внимательны к правилам.
Курьерская служба заботится о сохранности и адекватной температуре при транспортировке напитков.
Потребительские предпочтения формируют ассортимент и акции на платформе доставки.
мелбет букмекерская контора скачать на айфон
Скачать приложение Melbet: APK, iPhone и ПК
Мобильная версия Melbet включает букмекерскую контору и казино в одном интерфейсе. Доступны live-ставки, слоты, прямые трансляции, статистика и быстрые финансовые операции. Установка занимает несколько минут.
Android (APK)
Скачайте APK с официального сайта, откройте файл и подтвердите установку. При необходимости включите разрешение на установку из неизвестных источников, затем авторизуйтесь.
iOS (iPhone)
Откройте App Store, введите в поиске «Melbet», выберите «Получить», после установки выполните вход.
ПК
Перейдите официальный сайт, авторизуйтесь и добавьте ярлык на рабочий стол. Веб-версия работает как отдельное приложение.
Функционал
Live-ставки с мгновенным обновлением линии, казино и слоты, просмотр матчей, аналитические данные, push-оповещения, регистрация за минуту и поддержка 24/7.
Бонусы
После установки доступны приветственный бонус, промокоды и бесплатные ставки. Правила начисления определяются регионом.
Безопасность
Скачивайте только с официального сайта, проверяйте домен, не передавайте пароль третьим лицам и активируйте двухфакторную аутентификацию.
Загрузка выполняется быстро, после чего открывается полный доступ Melbet.
купирование абстиненции алматы поможет быстро и безопасно организовать качественный вывод из запоя в Алматы.
Сначала врач должен провести осмотр и собрать анамнез, чтобы понять степень зависимости и выявить возможные осложнения.
доступные цены лечение наркомании алматы — надежный путь к анонимному и профессиональному излечению от зависимости в Алматы.
Только после полного обследования формируется индивидуальный план терапии.
Терапевтические схемы подбираются наркологом индивидуально для каждого пациента.
Участие в групповой терапии способствует социализации и поддерживает мотивацию на восстановление.
После детоксикации важно пройти реабилитацию с акцентом на возвращение к нормальной жизни.
Закажите напитки к вечеру через алкоголь доставка и получите заказ вовремя.
Корректная рекламная политика и ответственное поведение компании способствуют укреплению доверия клиентов.
Цифровые платформы внедряют механизмы подтверждения возраста посредством снимков и электронных документов.
заключение контракта на сво волгоград
Особое внимание уделяется разделам о гарантиях, приемке работ и порядке расчетов.
Если вы хотите быстро и выгодно оформить после контракта сво, наши специалисты помогут с оформлением и ответят на все вопросы.
Заключение контракта на СВО в Нижнем Новгороде предполагает тщательный анализ условий сотрудничества и юридических нюансов.
Бюджет контракта на СВО в Нижнем Новгороде должен включать подробную калькуляцию и механизм расчётов.
В контракте необходимо прописать критерии качества выполнения работ и стандарты контроля.
Также стоит предусмотреть порядок расторжения договора и условия возмещения убытков.
вывод из запоя с госпитализацией астана
Безопасность процедур достигается квалификацией специалистов и соблюдением протоколов при оказании помощи.
Реабилитация и программы поддержки включают консультации, группы взаимопомощи и индивидуальную терапию для стойкой ремиссии.
доставка алкоголя круглосуточно — быстрая, надёжная и круглосуточная услуга для тех, кто хочет заказать напитки с доставкой домой без лишних хлопот.
Несоблюдение норм влечет штрафные санкции и риски для лицензирования.
Покупатели информируются о статусе заказа и ожидаемом времени доставки.
Маркетинг в сфере алкоголя обязан не стимулировать злоупотребление.
Регулирование и диалог с обществом помогут сохранить баланс между доступностью и безопасностью.
как закодироваться от алкоголя в астане
В Астане вопросы лечения алкоголизма занимают важное место в системе здравоохранения и социальной поддержки.
лечение от марихуаны алматы
Лечение наркомании в Алматы требует комплексного подхода и профессиональной поддержки.
Когнитивно-поведенческая терапия помогает изменить деструктивные установки и поведение.
После детоксикации реабилитационные программы помогают восстановить навыки для возвращения к нормальной жизни.
Развитие сети специализированных клиник и служб поддержки в Алматы улучшает доступ к помощи.
Если вы хотите узнать подробности о условия контракта на своё, переходите по ссылке.
Особое внимание следует уделить срокам выполнения и условиям оплаты.
Четкие требования к приемке уменьшают вероятность разногласий относительно результата.
Необходимо определить санкции за нарушение обязательств о конфиденциальности.
Также важно согласовать место рассмотрения споров и применяемое законодательство.
Нужен быстрый заказ для вечеринки? Заказывайте алкоголь 24 часа прямо сейчас — быстро, удобно и с гарантией качества.
Регулирование и соблюдение законов играют ключевую роль в работе служб доставки алкоголя.
налтрексон терапия алматы
Медицинская детоксикация под наблюдением врачей обеспечивает безопасность в период отказа от веществ.
Когнитивно-поведенческие техники способствуют уменьшению рецидивного поведения и укреплению мотивации.
Поддерживающие группы и программы сопровождения снижают риск рецидива в первые месяцы после лечения.
Поддержание мотивации и вовлеченность в программы реабилитации повышают шансы на успех.
Если вы хотите узнать подробности о контракт участника сво, переходите по ссылке.
Ключевыми элементами являются сроки выполнения работ и порядок оплаты.
Такой пункт помогает урегулировать отношения при возникновении непредвиденных событий.
Это особенно важно при передаче технической документации и коммерческих данных.
Необходимо прописать механизмы изменения условий и основания для расторжения соглашения.
Нужен быстрый заказ для вечеринки? Заказывайте купить алкоголь круглосуточно прямо сейчас — быстро, удобно и с гарантией качества.
Компании активно внедряют автоматизацию и системы контроля качества при доставке напитков.
заключение контракта на сво
Обязанности часто включают соблюдение сроков, стандартов качества, мер безопасности и регулярную отчетность.
где лучше выводить из запоя в астане отзывы
Чем раньше начинается лечение, тем ниже риск осложнений и тем выше вероятность стабильной ремиссии.
Первая стадия лечения направлена на выведение токсинов и восстановление физиологических функций организма.
Психологическое обследование позволяет определить уровень зависимости и подобрать эффективные методы терапии.
Связь с клиникой и регулярные визиты увеличивают шансы на стойкую ремиссию и восстановление социальной жизни.
Ознакомьтесь с услугами по заказать алкоголь с доставкой для быстрой и удобной доставки алкоголя в Москве.
Различные платформы обеспечивают оперативную доставку товаров.
Другое преимущество — широкий ассортимент доступных товаров.
Для старта с сервисом подберите проверенную службу.
Поэтому сочетайте доставку с осознанным поведением.
Закажите заказать алкоголь ночью круглосуточно и с удобной оплатой!
Доставка алкоголя становится все более популярной услугой в современном мире .
Компании предлагают удобные платформы для заказа .
Отправка товаров происходит в рекордно быстрые сроки.
Это делает процедуру приобретения более экономичной .
Потом зафиксируйте отбор в корзине .
Подтвердите покупку для мгновенной обработки.
Ключевой аспект — использовать ее продуманно.
Приобретайте товары исключительно у верифицированных поставщиков.
снятие ломки от героина алматы
Медицинская детоксикация под наблюдением врачей обеспечивает безопасность в период отказа от веществ.
Семейная терапия возвращает доверие и восстанавливает взаимоотношения между близкими.
Продолжение участия в поддерживающих инициативах способствует сохранению трезвого образа жизни.
Развитие сети специализированных клиник и служб поддержки в Алматы улучшает доступ к помощи.
госпитализация алкоголика астана
Своевременное обращение за помощью повышает шансы на успешное восстановление здоровья.
Первый этап включает детоксикацию организма и стабилизацию состояния пациента.
После детоксикации проводится психологическая оценка и планирование реабилитации.
Постоянная поддержка специалистов и участие родственников помогают сохранить достигнутые изменения и вернуться к привычной активности.
контракт на сво на год
Контракт на СВО в Волгограде — это официальный документ, фиксирующий права и ответственность сторон при выполнении работ, связанных с поддержкой и обеспечением сил в регионе.
Ознакомьтесь с услугами по доставка алкоголя москва для быстрой и удобной доставки алкоголя в Москве.
Теперь она доступна в большинстве крупных городов.
Шанс сделать покупку существует в любой момент дня.
Завершите оформление и ждите прибытия доставщика.
Спиртные напитки способны нанести вред организму в случае чрезмерного приема.
медицинская лицензия реабилитационный центр алматы
В Алматы эффективное лечение наркомании основывается на сочетании медицинской помощи и психотерапевтической поддержки.
Индивидуальная и групповая терапия помогают пациентам осознать причины зависимости и выработать навыки преодоления.
Реабилитационные центры в Алматы предлагают программы после детоксикации для социальной адаптации.
Важно сохранять мотивацию и пользоваться доступной поддержкой сообщества и специалистов.
рейтинг капперов прогнозистов помогут вам выбрать надежных экспертов и избежать мошенников.
Они предоставляют последовательные результаты и честную отчетность по прогнозам.
Критерии выбора капперов включают опыт, прозрачность и управление рисками. Не стоит ориентироваться только на красивые обещания и быстрые победы.
Работа с проверенными капперами требует ясного договора и условий сотрудничества. Договор должен оговаривать ответственность, сроки и возврат средств при срыве обещаний.
Этика и репутация — ключевые факторы долгосрочного сотрудничества с капперами. Нужно включить методы верификации прогнозов и подтверждение финансовых операций.
стоимость гравия подойдет для устройства дорожного основания и отсыпки площадок.
Четвертый раздел содержит практические советы по хранению и транспортировке материала.
Надежные каперы телеграмм помогут вам выбирать проверенные прогнозы и избегать мошенников.
Растущий спрос на проверенных капперов объясняется желанием бетторов получать стабильный результат.
Планируйте выгодные поставки и оформляйте карго компания быстрее и надежнее.
Интеграция страхования в логистическую схему позволяет снизить финансовые риски для импортера.
Планируйте выгодные поставки и оформляйте доставка товаров из китая быстрее и надежнее.
Услуги проверенного брокера сокращают сроки оформления и уменьшают вероятность бюрократических задержек.
Надежные каперы рейтинг помогут вам выбирать проверенные прогнозы и избегать мошенников.
Капперы высокого уровня применяют системный анализ и четкие правила управления капиталом.
лучшие капперы помогут вам выбрать надежных экспертов и избежать мошенников.
Проверенные капперы прошли тщательную проверку и отбор.
Критерии выбора капперов включают опыт, прозрачность и управление рисками. При выборе капперов учитывают стаж, открытость и подход к рискам.
Работа с проверенными капперами требует ясного договора и условий сотрудничества. Сотрудничество с проверенными капперами предполагает четкие договоренности и правила.
Этика и репутация — ключевые факторы долгосрочного сотрудничества с капперами. Договор должен оговаривать ответственность, сроки и возврат средств при срыве обещаний.
купить гравий подойдет для устройства дорожного основания и отсыпки площадок.
Также следует обращать внимание на соответствие щебня нормативам по истираемости и прочности.
Ищете лучшие предложения по интим-аксессуарам? секс шоп 24 предлагает широкий выбор и быструю доставку.
В таких магазинах можно найти игрушки, белье, смазки и аксессуары, которые помогают улучшить ощущения и укрепить отношения.
Ищете стабильные ролевые сервера для игры? Посетите gta сервера — здесь собраны лучшие проекты и подробные обзоры.
Первая важная особенность ГТА 5 РП — это социальное взаимодействие, которое строится на живом общении и соблюдении роли.
Компания охрана труда стоимость обеспечивает полный комплекс мер по предотвращению производственных рисков и соблюдению нормативов безопасности.
Охрана труда является основой безопасного и продуктивного рабочего процесса.
Постоянные тренинги и инструктажи уменьшают риск ошибок и улучшают навыки безопасного поведения.
Технические средства защиты и автоматизация процессов значительно повышают уровень безопасности.
Сотрудники обязаны соблюдать правила и сообщать о нарушениях или небезопасных ситуациях.
ngl heapsofwin hits different fr fr lol the whole thing is lowkey smooth tbh, imo its way better than other stuff ive seen, no cap
Компания охрана труда под ключ обеспечивает полный комплекс мер по предотвращению производственных рисков и соблюдению нормативов безопасности.
Охрана труда — ключевой элемент безопасного и эффективного производства.
Постоянные тренинги и инструктажи уменьшают риск ошибок и улучшают навыки безопасного поведения.
Современные технические средства нуждаются в плановом техосмотре и мониторинге исправности.
Сотрудники обязаны соблюдать правила и сообщать о нарушениях или небезопасных ситуациях.
Ищете лучшие предложения по интим-аксессуарам? товары для взрослых предлагает широкий выбор и быструю доставку.
В таких магазинах можно найти игрушки, белье, смазки и аксессуары, которые помогают улучшить ощущения и укрепить отношения.
Ищете стабильные ролевые сервера для игры? Посетите samp сервера — здесь собраны лучшие проекты и подробные обзоры.
Ролевые сервисы постоянно развиваются, предлагая новые возможности для творчества и взаимодействия.
Если ищете надежные прогнозы, присоединяйтесь к самые лучшие капперы в телеграмме и получайте актуальные ставки и аналитику.
Многие бетторы обращаются к ним за стратегией и советами по управлению банкроллом.
Стоит запрашивать подробные отчеты о прошлых прогнозах и сверять их на подлинность.
Чтобы сотрудничество было успешным, важно сохранять критическое мышление и не полагаться полностью на одного специалиста.
Такие специалисты могут открывать доступ к данным и подходам, которые сами по себе сложно собрать игроку.
Новый телефон samsung цена уже в продаже и сочетает стильный дизайн с мощной камерой.
Окончательное решение о покупке следует принимать, учитывая реальные сценарии использования и требования.
технический продакшн мероприятий — это гарантия качества и технической надежности вашего мероприятия.
Обратите внимание на модульность конструкции и возможность быстрой сборки и разборки.
Эффективное продвижение сайта в Москве — комплексный подход для увеличения видимости и конверсий
Продвижение сайтов начинается с тщательного анализа целевой аудитории и ключевых слов.
Техническое состояние сайта — важный фактор, включая время загрузки, адаптивность и структуру для роботов.
Контент-маркетинг — центральный инструмент в продвижении сайтов, который повышает доверие и вовлечённость.
Гибкость и готовность к изменениям в стратегиях продвижения сайтов ускоряют достижение целей.
https://lineage888.com/home.php?mod=space&uid=16716&do=profile&from=space
натяжные потолки предлагает выгодные условия установки и широкий выбор материалов для вашего дома в Сочи.
В этой части описан процесс монтажа и ориентировочные сроки выполнения работ в Сочи.
техническое обеспечение мероприятий санкт-петербург — это гарантия качества и технической надежности вашего мероприятия.
Аренда светодиодного экрана в Санкт-Петербурге — удобный способ привлечь внимание к вашему событию.
Если ищете надежные прогнозы, присоединяйтесь к рейтинг лучших капперов и получайте актуальные ставки и аналитику.
Пользователи сервисов капперов нередко следуют их указаниям по дисциплине и управлению средствами.
Стоит запрашивать подробные отчеты о прошлых прогнозах и сверять их на подлинность.
Управление эмоциями и осознанный подход важны при реализации чужих рекомендаций.
В долгосрочном горизонте проверенные капперы способны дополнить набор эффективных инструментов опытного беттора.
Новый смартфон самсунг цена уже в продаже и сочетает стильный дизайн с мощной камерой.
Программная обработка улучшает снимки, снижая шум и повышая динамический диапазон.
Профессиональное продвижение сайтов seo обеспечит долгосрочный рост органического трафика и увеличение продаж
На этом этапе формируются стратегии контента и продвижения, которые соответствуют интересам пользователей.
Техническая оптимизация сайта включает ускорение загрузки, адаптивность и корректную индексацию в поисковиках.
Важно комбинировать информационные, коммерческие и развлекательные материалы для разных этапов воронки.
Постоянный анализ метрик позволяет понять эффективность каналов и оптимизировать бюджет.
сочи натяжные потолки предлагает выгодные условия установки и широкий выбор материалов для вашего дома в Сочи.
Третий раздел раскрывает процесс установки и сроки работ в Сочи.
шары с гелием с доставкой — идеальное решение для праздника: ярко, быстро и с доставкой прямо к двери.
Выбор вида шаров влияет на общий вид оформления и настроение события.
Если хотите купить септик для дачи недорого, мы поможем подобрать надёжное и недорогое решение с гарантией и быстрым монтажом.
Тщательно изучайте комплектацию и характеристики производителя.
Щебень гравийный — оптимальный материал для дорожных и строительных работ; подробные варианты и условия заказа смотрите на гравий с доставкой.
Заполнитель из гравия способствует снижению усадки и увеличению долговечности бетонных конструкций.
воздушные шары москва — идеальное решение для праздника: ярко, быстро и с доставкой прямо к двери.
Выбор вида шаров влияет на общий вид оформления и настроение события.
Если хотите самый дешевый септик для дачи цена, мы поможем подобрать надёжное и недорогое решение с гарантией и быстрым монтажом.
Если вы посещаете участок сезонно, целесообразен недорогой бак под выгрузку.
Щебень гравийный — оптимальный материал для дорожных и строительных работ; подробные варианты и условия заказа смотрите на стоимость щебня за 1 м3.
Транспортные расходы и стоимость дробления влияют на общую цену щебня.
вулкан вегас автоматы
Надежная и эстетичная плитка под кирпич для наружной отделки фасада подчеркнет индивидуальность вашего дома.
Этот вид облицовки дает визуальную глубину кирпичной кладки без сложных строительных работ.
Ищете, где машина zeekr, — заходите к официальному дилеру в Москве и выбирайте подходящую комплектацию.
Бренд Zeekr быстро укрепляет позиции в сегменте электромобилей, предлагая конкурентные модели и современный дизайн.
Необходимо учитывать реальные показатели запаса хода, совместимость со станциями зарядки и объем гарантийного покрытия.
Стоимость Zeekr формируется исходя из выбранной комплектации, пакетов опций и возможных региональных скидок или льгот.
Изучение мнений владельцев и профессиональных обзоров поможет получить объективную картину о преимуществах и недостатках Zeekr.
Ищете идеальный сколько стоит трековый велосипед для тренировок на велотреке и городских выездов — у нас есть модели на любой вкус и бюджет.
Поскольку тормозов нет, райдеры применяют контролируемое замедление педалями и тактические приёмы в пелотоне для регулирования скорости.
Красивый и надежный построить забор цена подчеркнет индивидуальность вашего загородного дома и обеспечит безопасность участка.
Планируя высоту и форму ограждения, учитывают как практические, так и эстетические задачи.
Занятия в занятие английским языком для детей помогут вашему ребёнку легко и с удовольствием освоить первые английские слова и фразы.
В такой обстановке ребенок легче воспринимает новую лексику и правила.
Игры и песни — ключевой инструмент в обучении малышей английскому языку. Благодаря повторениям и ритму дети тренируют произношение и расширяют словарь.
Визуальные материалы и предметы из окружения делают обучение практичным и понятным. Важно показывать предмет и говорить слово вслух несколько раз.
Регулярность занятий и позитивная обратная связь определяют успех в изучении языка. Короткие ежедневные занятия эффективнее редких долгих уроков.
Закажите изготовление ремувок на заказ с индивидуальным дизайном и быстрым изготовлением для продвижения вашего бренда.
Важную роль играют размеры, форма и цветовая гамма, которые влияют на итоговый вид ремувки.
Ищете, где авто резина лето купить — заходите к нам, лучшие цены и быстрая доставка по Санкт-Петербургу.
Выбирайте шины с учётом характеристик автомобиля и условий эксплуатации.
Открой для себя лучшие приложения и новинки в приложения для андроид, где удобно искать, скачивать и обновлять всё необходимое.
Разработчики выкладывают обновления и получают обратную связь от пользователей.
Опция автообновления позволяет не следить за выходом новых версий вручную.
Каталог приложений выгоден как для потребителей, так и для авторов программ.
Наличие поддержки и честная политика возврата — ключевые критерии при платных покупках.
Надежная и эстетичная фасадная плитка под кирпич для наружной отделки подчеркнет индивидуальность вашего дома.
Плитка удобна и при реконструкции, и при облицовке новостроек.
Ищете идеальный купить трековый велосипед в москве для тренировок на велотреке и городских выездов — у нас есть модели на любой вкус и бюджет.
От выбранной трековой дисциплины зависит конструкция велосипеда: скоростные спринты требуют минимального веса, а гонки на выносливость — устойчивости и комфорта.
Ищете, где zeekr цена, — заходите к официальному дилеру в Москве и выбирайте подходящую комплектацию.
Потенциальных покупателей интересует доступность моделей Zeekr и особенности продажи через официальную дилерскую сеть.
При покупке Zeekr рекомендуется внимательно изучить доступные конфигурации, провести тест-драйв и сравнить технические параметры.
Финальная цена Zeekr определяется уровнем оснащения, дополнительными пакетами и действующими предложениями дилеров и региональных программ.
Важно заранее узнать о развитии сервисной инфраструктуры и типичных расходах на обслуживание Zeekr в вашем регионе.
Красивый и надежный поставить забор цена подчеркнет индивидуальность вашего загородного дома и обеспечит безопасность участка.
Выбор материала — одно из главных решений при планировании ограждения.
Занятия в английский для малышей нижний новгород помогут вашему ребёнку легко и с удовольствием освоить первые английские слова и фразы.
Родителям и учителям важно поддерживать интерес ребенка и не форсировать процесс обучения.
Игры и песни — ключевой инструмент в обучении малышей английскому языку. Короткие активные занятия и смена формата удерживают внимание ребенка.
Визуальные материалы и предметы из окружения делают обучение практичным и понятным. Яркие карточки, игрушки и наглядные плакаты способствуют лучшему запоминанию слов через ассоциации.
Регулярность занятий и позитивная обратная связь определяют успех в изучении языка. Даже короткие ежедневные занятия дают лучше результат, чем редкие длительные уроки.
Закажите ремувки с логотипом на заказ с индивидуальным дизайном и быстрым изготовлением для продвижения вашего бренда.
Размеры, форма и цвета определяют визуальное восприятие и соответствие фирменному стилю.
Ищете, где купить резину лето спб — заходите к нам, лучшие цены и быстрая доставка по Санкт-Петербургу.
Если вы часто ездите по загородным трассам, выбирайте шины с повышенной износостойкостью.
Открой для себя лучшие приложения и новинки в магазин приложений для андроид, где удобно искать, скачивать и обновлять всё необходимое.
Разработчики выкладывают обновления и получают обратную связь от пользователей.
Можно включить автоматическое обновление приложений для удобства.
Авторам приложений предоставляются инструменты аналитики, способы монетизации и рекламные опции.
В итоге каталог приложений служит основой для персонализации и расширения функционала смартфона.
В нашем игрушки 18 вы найдёте всё необходимое для ярких и безопасных впечатлений.
В них можно приобрести как классические изделия, так и современные гаджеты для удовольствия.
Сертифицированные изделия минимизируют риски аллергий и повреждений и обеспечивают долгий срок службы.
Отзывы других покупателей и подробные карточки товара облегчают выбор.
Используйте рекомендованные средства для очистки и храните изделия в сухом прохладном месте.
Ищете надежные прогнозы на спорт? Посетите ставки на спорт прогнозы телеграмм — где собраны проверенные капперы и отзывы о них.
Важно выяснить условия сотрудничества и структуру оплаты услуг каппера.
Ищете надежный смартфон самсунг цена, у нас вы найдете широкий выбор моделей и выгодные цены.
Более того, производитель внедряет современные материалы и инновационные решения.
Пользователь может выбирать между несколькими камерами для разных сценариев.
Операционная система обеспечивает плавную работу и обновления безопасности.
Пропорции и вес оптимизированы для эргономичного использования и удобства держания в руке.
натяжные потолки предлагает широкий выбор качественных решений и профессиональный монтаж в Сочи.
Местные поставщики предлагают натяжные потолки из ПВХ и тканевые конструкции, отвечающие различным требованиям.
Глянцевые полотна отражают свет и создают ощущение большей высоты и простора.
Монтаж натяжных потолков в Сочи обычно выполняют специализированные компании с гарантией.
Следует избегать агрессивных чистящих средств и абразивов, способных повредить поверхность.
каперы в телеграмме помогает выбрать действительно надежных специалистов для ставок.
Лучшие капперы имеют доказанную историю успеха и отзывы реальных клиентов.
Также полезно изучить отзывы на независимых ресурсах и форумы бетторов.
Специалисты, раскрывающие аналитику и мотивацию своих ставок, представляют большую ценность, чем те, кто предоставляет лишь коэффициенты.
Стоимость услуг эксперта по ставкам должна отражать качество и степень открытости его деятельности.
Найдите топ капперов и выберите надежных экспертов для стабильных прогнозов.
Капперы, которых можно назвать проверенными, имеют чёткие правила по управлению капиталом.
карго из китая — надёжный партнёр для быстрой и безопасной доставки грузов из Китая в Россию.
Клиенты должны понимать сроки оформления и возможные дополнительные платежи.
Морская доставка остается самым экономичным вариантом для больших объемов груза.
При выборе авиации следует учитывать тарифы, ограничения по весу и особенностям груза.
Надежная упаковка защищает товар от повреждений, а корректная маркировка ускоряет обработку на терминалах.
Щебень гравийный — отличный выбор для дорожных работ и благоустройства, подробнее о вариантах и доставке узнавайте на цена гравия.
Его добывают путём дробления горной породы и последующей калибровки по фракциям.
Праздничную атмосферу любому событию придадут заказать шары.
Используйте биоразлагаемые шары и перерабатывайте материалы после праздника.
msd предлагает широкий выбор качественных решений и профессиональный монтаж в Сочи.
Установка происходит быстро, а результат получается ровным и долговечным.
Интересные решения включают многоуровневые конструкции и встроенную подсветку.
Качественная подготовка стен и коммуникаций ускоряет процесс установки.
Не рекомендуется использовать абразивные средства и сильные растворители.
Ищете надежный сотовый телефон самсунг, у нас вы найдете широкий выбор моделей и выгодные цены.
Такой подход уменьшает вероятность дефектов и продлевает рабочий ресурс гаджетов.
Пользователь может выбирать между несколькими камерами для разных сценариев.
ОС гарантирует стабильную работу и регулярные обновления безопасности.
Дополнительные аксессуары — чехлы, зарядки и наушники — расширяют возможности.
Ищете надежные прогнозы на спорт? Посетите ставки на спорт прогнозы телеграм — где собраны проверенные капперы и отзывы о них.
При выборе проверенного каппера важно учитывать его послужной список и прозрачность.
В нашем Мэнтис Маркет вы найдёте всё необходимое для ярких и безопасных впечатлений.
Предложения варьируются от простых аксессуаров до высокотехнологичных девайсов для интимной близости.
Нельзя забывать о персональных особенностях и возможных ограничениях здоровья.
Доставка обычно осуществляется в нейтральной упаковке и с возможностью выбора способа получения.
Правильный уход за изделиями продлевает срок их эксплуатации и гарантирует гигиену.
капперы которым можно доверять помогает выбрать действительно надежных специалистов для ставок.
Обязательной мерой является проверка репутации эксперта до оформления подписки.
Также полезно изучить отзывы на независимых ресурсах и форумы бетторов.
Методика анализа специалиста по прогнозам — ключевой фактор.
Когда прогнозы оправдывают ожидания, разумно наращивать взаимодействие и ставки шаг за шагом.
Найдите лучшие капперы и выберите надежных экспертов для стабильных прогнозов.
Все больше игроков обращают внимание на проверенных капперов в поисках стабильной прибыли.
доставка из китая в москву карго — надёжный партнёр для быстрой и безопасной доставки грузов из Китая в Россию.
Понимание процедур и возможных дополнительных расходов — ключ к успешной доставке.
Развитие железнодорожной сети способствует ускорению и стабилизации поставок.
Это дает возможность минимизировать финансовые риски и оперативно реагировать на непредвиденные ситуации.
При выборе оператора обращайте внимание на репутацию, отзывы клиентов и наличие сертификатов.
Щебень гравийный — отличный выбор для дорожных работ и благоустройства, подробнее о вариантах и доставке узнавайте на купить гравий.
Рациональное планирование закупок и логистики позволяет сократить расходы, не ухудшая качество.
раменбет казино
Начните учить начальный английский для детей вместе с нами — весело, эффективно и с любящими преподавателями.
Домашняя поддержка, совместные чтения и игровые занятия на английском языке укрепляют знания и стимулируют интерес.
Ищете идеальный спортивный трековый велосипед, чтобы уверенно побеждать на треке и наслаждаться скоростью?
Трековый велосипед остаётся символом чистого спортивного совершенства и технической изящности.
Хотите zeekr купить — приезжайте на тест-драйв и узнайте все преимущества этого электромобиля.
Покупка Zeekr включает оценку характеристик, дизайна и пакета опций.
Следите за спецпредложениями у официальных дилеров для выгодной покупки.
Эксплуатация Zeekr предполагает планирование зарядок и маршрутов.
Анализ отзывов помогает сформировать объективное мнение перед покупкой.
Если хотите купить септик для дачи в москве, заходите на наш сайт — выгодные предложения и профессиональная установка для вашего загородного дома.
При выборе недорогого септика для дачи важно учесть объемы стоков и условия участка.
Обратите внимание на способ монтажа, материал корпуса и гарантийные обязательства продавца.
Правильная установка и уход минимизируют дополнительные траты после покупки.
Эконом-варианты с проверенной схемой очистки часто оказываются оптимальны по цене и надежности.
Компания предлагает отсев гравийный фракция 0 5 мм цена для стройки и благоустройства с оперативной доставкой по Москве и области.
Щебень гравийный — важный строительный материал, востребованный в дорожном и цивильном строительстве.
Получение гравийного щебня осуществляется через карьеры с последующей обработкой, дроблением и классификацией фракций.
Щебень из гравия активно задействуют в дорожном строительстве, в составе бетонов и при обустройстве дренажей.
Правильная подборка материала повышает срок службы оснований и уменьшает последующие расходы на ремонт.
плитка фасадная облицовочная под кирпич цена придаст вашему дому аутентичный кирпичный вид и надежную защиту фасада.
Следует проверять данные о толщине плитки, её составе и количестве циклов замораживания-оттаивания.
\
Предлагаем стильные ремувка купить, позволяющие выгодно подчеркнуть ваш бренд и заказать печать логотипа оптом или в единичном экземпляре.
Гибкость производства позволяет учитывать сезонность и особые требования клиентов.
Хотите рестайлинг zeekr — приезжайте на тест-драйв и узнайте все преимущества этого электромобиля.
Автомобили Zeekr отличаются продуманной эргономикой и современным оснащением.
Покупатели Zeekr часто рассматривают разные варианты финансирования, включая лизинг.
Домашняя зарядка обеспечивает комфорт и снижает зависимость от общественных точек.
Опыт реальных пользователей даст представление о сильных и слабых сторонах Zeekr.
Начните учить репетитор по английскому языку для детей вместе с нами — весело, эффективно и с любящими преподавателями.
В этом разделе подчеркивается значение вовлечения родителей и регулярных домашних занятий.
Ищете идеальный карбоновый трековый велосипед купить, чтобы уверенно побеждать на треке и наслаждаться скоростью?
Выбор правильного типа трансмиссии и передаточного числа влияет на результаты на треке.
Если хотите купить септик для дачи недорого, заходите на наш сайт — выгодные предложения и профессиональная установка для вашего загородного дома.
Снижение стоимости не должно отражаться на долговечности и надежности системы.
Изучение предложений на рынке позволяет подобрать подходящую модель по цене и характеристикам.
Рекомендовано привлекать сертифицированных специалистов для установки и наладки системы.
При ограниченном бюджете рассмотрите модели с простым устройством и доступными запчастями.
Предлагаем стильные ремувка из репса, позволяющие выгодно подчеркнуть ваш бренд и заказать печать логотипа оптом или в единичном экземпляре.
Ремувки с логотипом на заказ — это сочетание практичности и рекламы, способное усилить узнаваемость бренда.
Компания предлагает щебень гравийный заказать для стройки и благоустройства с оперативной доставкой по Москве и области.
Щебень гравийный — важный строительный материал, востребованный в дорожном и цивильном строительстве.
Производство гравийного щебня включает добычу, сортировку и дробление исходного материала.
Экономическая эффективность и доступность делают его предпочтительным выбором для многих проектов.
Правильная подборка материала повышает срок службы оснований и уменьшает последующие расходы на ремонт.
плитка под кирпич для фасада придаст вашему дому аутентичный кирпичный вид и надежную защиту фасада.
Следует проверять данные о толщине плитки, её составе и количестве циклов замораживания-оттаивания.
\
Ищете, где купить летние шины в спб — заходите на наш сайт для выгодных предложений и быстрой доставки по Санкт?Петербургу.
Проверяйте давление в шинах и состояние вентилей после установки.
joycasino официальное зеркало
Ищете, где купить летнюю резину в спб дешево — заходите на наш сайт для выгодных предложений и быстрой доставки по Санкт?Петербургу.
От качества шин зависят износостойкость и безопасность на дороге.
I was skeptical about this whole thing at first honestly, thought it was gonna be another one of those sketchy sites but nope I was actually suprised at how legit it all felt, the whole experience was way better than what I expected 777bet and I’ve been using it pretty regularly now.
Для удобной и безопасной поездки закажите автомобиль с водителем новосибирск по выгодным ценам.
Услуга аренды авто с водителем в Новосибирске набирает популярность среди деловых людей и туристов.
Для комфортного и экономичного проживания за городом рассмотрите вариант каркасный дом под ключ, гарантирующий быстрое возведение и высокую энергоэффективность.
Правильный выбор утеплителя и пароизоляции влияет на энергоэффективность здания.
Для надежной защиты гаража рекомендуем установить купить ворота в гараж, которые обеспечивают теплоизоляцию и долговечность.
Правильно подобранные пружины и направляющие обеспечивают бесшумное движение и снижают риски аварийных ситуаций.
Консультация с финансовым и юридическим специалистом поможет выбрать оптимальную программу.
лизинг грузовиков https://kommercheskij-transport-v-lizing06.ru/gruzovye-avtomobili/
Для надежных грузоподъемных работ рекомендуем ознакомиться с техническими характеристиками канат грузовой гост 2688 80 купить.
Дополнительные покрытия сохраняют структуру волокон и продлевают срок службы.
Надёжно и недорого организуем вывоз строительного мусора, быстро вывозим мусор с погрузкой и вывозим по доступным ценам.
Такие меры повышают эффективность и сокращают количество пустых рейсов.
Для комфортных поездок по Новосибирску закажите аренда авто в новосибирске с водителем.
Такой сервис экономит время и снижает стресс во время поездок по делам или на отдых.
Чтобы купить светодиодные оборудование, посетите arlight интернет магазин.
Стоит обратить внимание на гарантийные условия и сервисное обслуживание от производителя.
Щебень гравийный можно купить быстро и надежно через купить гравий с доставкой.
Этот материал — крупнозернистая фракция, получаемая дроблением пород или путем промывки природного гравия.
Для удобной и безопасной поездки закажите аренда авто с водителем по выгодным ценам.
Опытные шоферы ориентируются в городских пробках и знают оптимальные маршруты.
Для комфортного и экономичного проживания за городом рассмотрите вариант каркасные дома цены, гарантирующий быстрое возведение и высокую энергоэффективность.
Среди достоинств отмечают быструю сборку и уменьшенные затраты на возведение конструкций.
Получение совета от профильных специалистов облегчит выбор выгодной и безопасной программы лизинга.
лизинг коммерческого транспорта https://kommercheskij-transport-v-lizing06.ru/
Для надежной защиты гаража рекомендуем установить роллетные ворота для гаража подъемные, которые обеспечивают теплоизоляцию и долговечность.
Подбор привода должен соответствовать массе ворот и частоте их эксплуатации.
Строительная компания предлагает быстрое возведение комфортного дома каркасные под ключ по выгодной цене в Санкт-Петербурге.
Фундамент для каркасного дома может быть лёгким и экономичным, что сокращает общие затраты.
Надёжно и недорого организуем уборка строительного мусора, быстро вывозим мусор с погрузкой и вывозим по доступным ценам.
Стоимость услуг зависит от объема, вида отходов и удаленности объекта.
Для надежных грузоподъемных работ рекомендуем ознакомиться с техническими характеристиками канат грузовой гост 2688 80 купить.
Сертификация параметров помогает выбрать оптимальный канат под поставленные задачи.
Чтобы купить светодиодные оборудование, посетите купить светодиодные оборудование.
Онлайн-площадки предоставляют разнообразие товаров и удобные фильтры для подбора.
Для комфортных поездок по Новосибирску закажите аренда авто в новосибирске с водителем.
Класс автомобиля подбирается исходя из назначения поездки и числа пассажиров.
рейтинг казино на реальные деньги
колесо фортуны онлайн
Щебень гравийный можно купить быстро и надежно через щебень гравийный купить.
Его используют в бетонных смесях для повышения механических свойств.
sup everyone, gotta share this, ipl live 2026 slaps. 10/10 would use again lol
Been using play three card rummy online for a couple weeks now and honestly its pretty fun. I like how quick the games are and the rules are easy to pick up, but the matchmaking takes a lil long sometimes which is kinda anoying when your just trying to play a quick round.
sapporo88
Ищете качественную макетную плату? контроллер ардуино купить
Новички и профессионалы часто используют макетные платы при разработке схем различной сложности.
Ряд макетных плат имеют интегрированные линии питания и дополнительные шины.
Не стоит перегружать плату множеством проводов, это усложняет отладку.\
Регулярная практика повышает навыки и снижает количество ошибок при сборке схем.\
Идеальный выбор для подготовки к соревнованиям — купить трековый велосипед в москве.
Трековый велосипед отличается конструкцией и предназначением, оптимизирован для езды по овальному треку и соревновательной подготовки.
Техника езды на трековом велосипеде требует специфических навыков, которых нет в обычной велопрогулке.
Регулярная проверка рамы и креплений седла и руля поможет предотвратить поломки и аварийные ситуации.
Учёт характеристик дорожки и корректный подбор снаряжения ускоряют развитие навыков и уменьшают вероятность получения повреждений.
Ищете, где zeekr купить — узнайте всё о моделях и ценах на zeekr.
Разные способы финансирования позволяют гибко подходить к покупке Zeekr, оптимизируя ежемесячные платежи и налоговые последствия.
Ищете надежную машина с водителем в аренду новосибирск для комфортных поездок по городу — звоните и заказывайте прямо сейчас.
Услуга аренды авто с водителем в Новосибирске привлекает клиентов удобством и надёжностью.
Можно выбрать автомобиль соответствующего класса для любого случая и бюджета.
Для популярных направлений доступны фиксированные тарифы и выгодные предложения.
Рекомендуется заранее согласовать маршрут, время подачи и дополнительные требования к поездке.
Современный дом обретает выразительный облик благодаря фасадная плитка под кирпич цена за м2, которая сочетает прочность, теплоизоляцию и эстетичность.
Выбор формата влияет на визуальное восприятие и скорость монтажа.
Ищете выгодные условия для легкий коммерческий транспорт лизинг, обратитесь к нам за персональным расчетом и поддержкой на каждом этапе оформления.
Сбалансированное применение лизинга повышает конкурентоспособность и способствует долгосрочному развитию бизнеса.
Нужен быстрый и недорогой вывоз строительного мусора в москве недорого из квартиры, чтобы быстро освободить квартиру после ремонта.
Современные технологии и оборудование облегчают процесс вывоза мусора и повышают его эффективность.
Для надежной защиты и красивого оформления участка подумайте о установить забор цена, которая подчеркнет стиль вашего дома и обеспечит безопасность на долгие годы.
Кованый забор выглядит роскошно, но предполагает более высокую цену и монтаж фундамента.
Современный дом обретает выразительный облик благодаря купить облицовочную плитку для фасадов под кирпич, которая сочетает прочность, теплоизоляцию и эстетичность.
Она сочетает в себе прочность, доступность и разнообразие текстур и оттенков.
каркасный дом в спб — отличное решение для быстрого и экономичного возведения уютного загородного жилья.
Начинают процесс с проектирования и подбора материалов.
Этот подход обеспечивает оперативную сборку стен и ускоряет выполнение работ.
Новые утеплительные решения обеспечивают эффективное сохранение тепла в помещении.
По стоимости возведения каркасный дом зачастую оказывается дешевле кирпичных и блочных строений.
Ищете надежную машина с водителем в аренду новосибирск для комфортных поездок по городу — звоните и заказывайте прямо сейчас.
Опытные шофёры знают городские маршруты и сокращают время в пути.
Фleet компаний включает автомобили разного уровня комфорта, чтобы удовлетворить разные запросы.
Стоимость формируется исходя из продолжительности заказа, типа машины и дополнительных услуг.
Рекомендуется заранее согласовать маршрут, время подачи и дополнительные требования к поездке.
Идеальный выбор для подготовки к соревнованиям — трековый велосипед.
В конструкции трекового велосипеда часто отсутствуют тормоза, а трансмиссия выполнена в виде фикс-гонки для максимально эффективной передачи мощности.
Овладение навыками трековой езды важно, так как она включает в себя особенности, непривычные для шоссейных или городских велосипедистов.
Подбор шин и правильное давление играют значительную роль в сцеплении с поверхностью и в скорости.
Трековые велосипеды применяются как в любительских велошколах, так и в программах профессиональной подготовки и на соревнованиях.
Ищете выгодные условия для лизинг коммерческого транспорта, обратитесь к нам за персональным расчетом и поддержкой на каждом этапе оформления.
Техническое обслуживание и страхование могут быть включены в пакет лизинга, что упрощает эксплуатацию автопарка.
Нужен быстрый и недорогой вывоз крупногабаритного мусора из квартиры москва, чтобы быстро освободить квартиру после ремонта.
Скоординированная работа служебного транспорта и грузоподъёмной техники повышает надёжность системы вывоза мусора.
Ищете аренда авто с водителем новосибирск — позвоните нам, и мы подберём идеальный автомобиль с профессиональным водителем для комфортных поездок по Новосибирску.
Некоторые компании предлагают фиксированные тарифы на поездки в аэропорт, что удобно для планирования бюджета.
Ищете аренда авто с водителем — позвоните нам, и мы подберём идеальный автомобиль с профессиональным водителем для комфортных поездок по Новосибирску.
С каждым годом всё больше жителей и гостей Новосибирска выбирают аренду авто с профессиональным водителем.
Для надежной защиты и красивого оформления участка подумайте о стоимость работ по установке забора, которая подчеркнет стиль вашего дома и обеспечит безопасность на долгие годы.
Регулярный уход продлевает срок службы забора: обработка дерева, покраска металла и очистка камня обязательны.
+1 to what you said, 777bet is legit worth checking out if ur into that stuff
I know this if off topic but I’m looking into starting my own weblog and was wondering what
all is required to get set up? I’m assuming having a blog like yours would cost a pretty penny?
I’m not very internet smart so I’m not 100% certain. Any recommendations or advice would
be greatly appreciated. Cheers
Hello all, here every one is sharing such familiarity,
therefore it’s pleasant to read this blog, and I used to pay a quick visit this webpage everyday.
Мы строим качественный [url=https://karkasnye-doma-pod-klyuch9.ru]каркасный дом[/url] быстро, надёжно и по выгодной цене.
Каркасные здания становятся все более популярными среди частных владельцев.
Эргономика интерьера важна для комфортного и длительного пребывания в комнате.
оснащение залов совещаний [url=https://media-garage.ru/moya-kollekciya/kak-osnastit-zal-zasedanij-ili-zal-soveshchanij]оснащение залов совещаний[/url].
Для тех, кто ищет надежное место для развития карьеры, [url=https://corona-studio.ru/]вебкам студия спб[/url] предлагает выгодные условия и поддержку профессионалов.
Одним из главных преимуществ
Hi there would you mind letting me know which hosting company you’re
utilizing? I’ve loaded your blog in 3 completely different browsers and I must
say this blog loads a lot faster then most. Can you recommend a good hosting provider
at a honest price? Many thanks, I appreciate it!
Если вы ищете надежные [url=https://proekty-domov5.ru]проект дома купить готовый[/url], то наш сайт предлагает широкий выбор и выгодные условия покупки.
Одно из главных преимуществ – это экономия времени, ведь готовые проекты уже разработаны специалистами.
Write more, thats all I have to say. Literally, it seems as though you relied on the video to make your point.
You clearly know what youre talking about, why waste your intelligence on just posting
videos to your weblog when you could be giving us something informative to read?
A fascinating discussion is definitely worth comment.
I do think that you need to publish more
on this issue, it might not be a taboo matter but usually folks don’t discuss
such subjects. To the next! Many thanks!!
Если возникли непредвиденные ситуации на дороге, просто воспользуйтесь [url=https://evakuatorsochi24.ru]эвакуатор в москве[/url] — это быстро и удобно!
Эвакуатор делает процесс ремонта и обслуживания автомобилей намного удобнее.
… [Trackback]
[…] Information on that Topic: coinchapter.com/crypto-price-prediction-shiba-inu-shib-cardano-ada-dogecoin-doge-ripple-xrp-polkadot-dot/ […]
Если вам срочно требуется [url=https://dostavkaalkogolyaboka.msk.ru/]доставка алкоголя круглосуточно[/url], наш сервис готов помочь в любое время суток.
Сделать заказ легко и быстро через удобное мобильное приложение или интернет-портал.
Для надежной канализации на вашем участке рекомендуем [url=https://kupit-septik01.ru/]автономный септик цена[/url] по выгодной цене и с гарантией качества.
Приобретение септика — необходимая часть обустройства загородного дома. Прежде чем приобрести септик, необходимо ознакомиться с ассортиментом. Выбор зависит от объема отходов и особенностей участка. Требуется учитывать параметры изготовления и расчетный объем отходов. Также стоит рассмотреть вопрос стоимости и гарантии на покупку.
Рекомендуется получить консультацию у специалистов или ознакомиться с отзывами о моделях. Это поможет избежать ошибок при выборе и сделать правильный выбор. Экономия на качестве может привести к более частым проблемам и дополнительным затратам. Обратите внимание на отзывы и рекомендации других покупателей, чтобы сделать правильный выбор. Также важно учитывать условия эксплуатации и тип почвы, чтобы выбрать наиболее подходящий тип септика.
Не менее важно, чтобы выбранный септик соответствовал техническим требованиям и позволял легко устанавливаться. Перед приобретением рекомендуется провести сравнение нескольких моделей и выбрать наиболее оптимальную. Качественный септик — залог комфортного и беспроблемного проживания. Выбирая качественный септик, вы гарантируете длительный срок службы и удобство. Узнайте заранее о вариантах доставки и монтажа, чтобы все прошло гладко.
Hi, its fastidious article concerning media print, we all be aware of media is a enormous source of facts.
We stumbled over here coming from a different web address and thought I may as
well check things out. I like what I see so now
i’m following you. Look forward to finding out about
your web page again.
Cryptify Hub 是领先的加密教育平台,专注为香港及亚洲用户提供免费的区块链入门课程、比特币原理、DeFi 安全指南及投资实战策略。我们相信,知识是抵御市场风险的最佳资产。
Currently it sounds like Movable Type is the top blogging platform out there right now. (from what I’ve read) Is that what you’re using on your blog?