

LUCKNOW (CoinChapter.com) — Cryptocurrency price across the board enjoyed a relief rally on Friday as Bitcoin (BTC) prices inched above $19,500.
In addition, Ethereum (ETH) prices also moved above $1,300 on a day that saw most cryptocurrencies register gains. However, the markets need to continue their uptrend over the weekend to increase investor confidence in the market’s price action.
1. SUSHI/USD
SushiSwap prices jumped more than 33% in under two days, with SUSHI prices reaching an intraday high of $1.45 from Oct 13’s low of $1.09. The uptrend helped SUSHI prices recover some of the losses it incurred in the week starting Oct 10.
If the uptrend continues, SUSHI prices would first target resistance near $1.47. After that, moving and consolidating above immediate resistance would help the defi token’s prices reach $1.61 before corrections pare gains.

Meanwhile, the relative strength index for the token is currently neutral, with a value of 62.14 on the daily charts. But, the RSI trendline is moving steadily upward, which might mean an overbought RSI soon.
Traders often consider an overbought RSI an indicator of a trend reversal for an asset. Hence, if a sell-off begins, SUSHI prices might fall to support near $1.3.
Furthermore, a marketwide sell-off could see SUSHI prices test support from their 20-day EMA (red wave) and 50-day EMA (purple wave) near $1.21 before recovering.
2. ENS/USD
ENS, the native token of the Ethereum Name Service, has been charting higher lows for some time now. The token has support from a multi-month ascending trendline since Jul this year. ENS prices closed Oct 13 after gaining 13% intraday.
Also Read: Cryptocurrency Price Today: Kusama (KSM), Algorand (ALGO), Harmony (ONE), BitTorrent (BTT), Internet Computer (ICP)ENS prices continued the uptrend on Friday, reaching a high of $20.37 intraday. However, bears have started selling to book profits, as the long upper wick on Oct 14’s candle suggests.
Meanwhile, ENS’s 20-day EMA (red wave) looks poised to cross above the token’s 200-day EMA (green wave) to form a bullish pattern called the golden cross. Traders often consider the pattern an indicator of positive market sentiment.
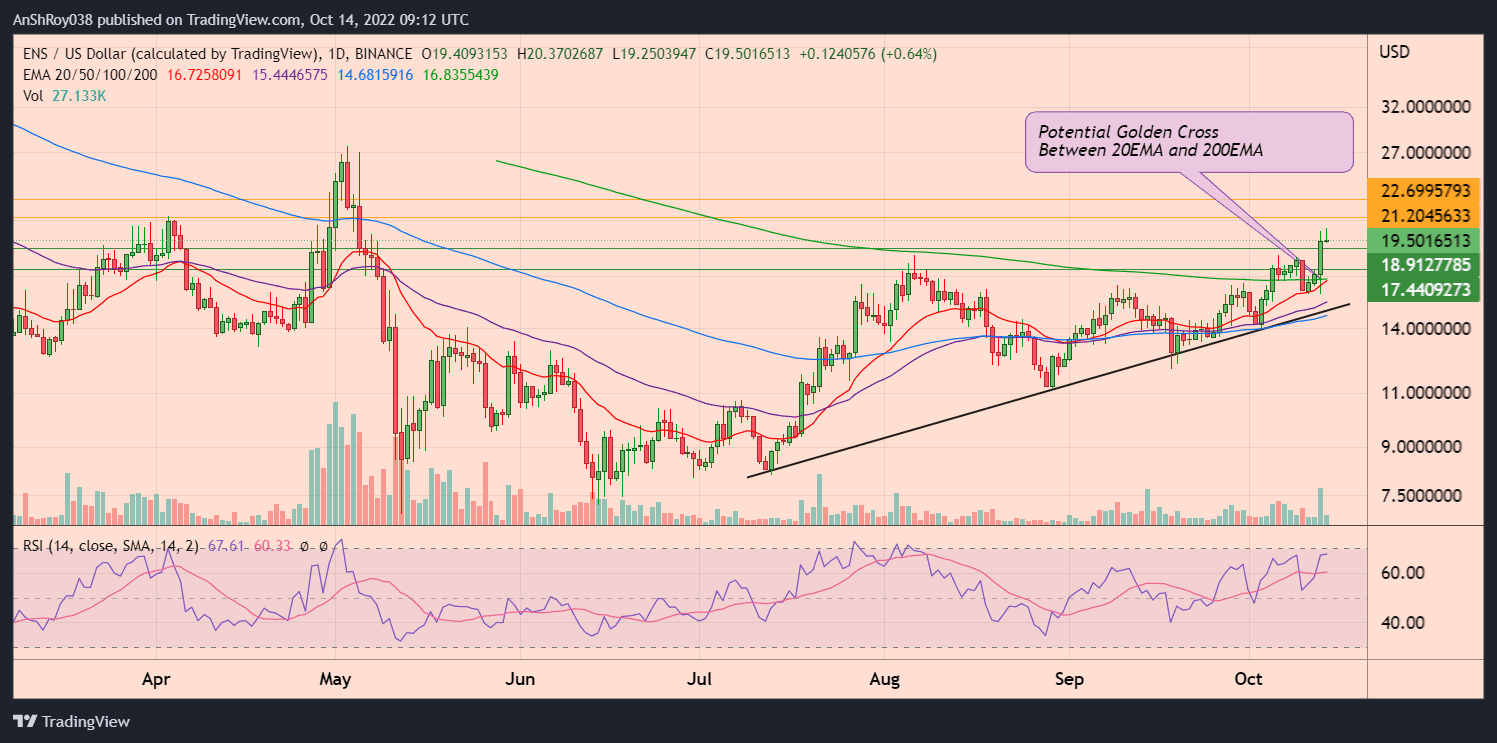
As such, ENS prices might continue their uptrend to challenge resistance near $21.2. A move above immediate resistance would likely see the token rise to resistance near $22.7 before corrections pare gains.
Meanwhile, the relative strength index for ENS is near the overbought threshold, clocking at 67.61 on the daily timeframe. In addition, the upper-sloping RSI trendline and the long upper wick on the Oct 14’s daily candle indicate a strong bearish presence near the upper price levels.
As a result, ENS prices might fall to support near $18.9. Moreover, a sustained downtrend could see ENS prices falling to support near $17.4 before recovering.
3. LUNC/USD
Terra Classic (LUNC) prices have stagnated over the past few weeks. LUNC prices have been range bound between the 20-day EMA (red wave) and 50-day EMA (purple wave) since Oct 10.
The token’s prices dropped over 6% on Thursday, with the downtrend continuing on Oct 14. Currently, LUNC prices have support from their 50-day EMA near $0.000257.
Moreover, if the downtrend forces LUNC prices below immediate support, the token might fall over 20% from current levels to test support near $0.000226 before recovering.

Conversely, if the token starts an uptrend, LUNC prices would first challenge resistance from their 20-day EMA (red wave) near $0.0003. A sustained uptrend might result in LUNC moving above immediate resistance and rising to $0.00034 before corrections pare gains.
Meanwhile, the relative strength index for LUNC remains neutral, with a value of 48.77 on the daily charts.
4. REEF/USD
Reef Finance’s native token REEF prices have been on an uptrend since Oct 6, with the token jumping from Oct 6’s low of $0.0047 to reach an intraday high of $0.00635 on Oct 14 before corrections pared gains.
Also Read: Cardano (ADA) risks a 70% drop amid Daedalus 5.1.0 updatesREEF prices have remained above multi-week ascending trendline support, but the token’s 200-day EMA (green wave) continues to rebuff any uptrends. Currently, REEF prices have immediate resistance from their 200-day EMA near $0.0064.
Moving above immediate resistance would likely provide REEF prices the momentum to rise to resistance near $0.00715 before corrections pare gains.
Meanwhile, the relative strength index for REEF remains neutral, clocking at 67.08 on the daily timeframe. However, the rising RSI trendline indicates that the momentum indicator might soon become overbought. Traders often consider an overbought RSI a signal of looming trend reversal.
As a result, REEF prices risk falling to support near $0.0058 once the uptrend breaks down. Moreover, a marketwide sell-off could see the token fall below ascending trendline support and reach $0.0053 before recovering.
Enjoyed Huobi Token’s recent rally that led to 100% gains. Here are three reasons why a crash might be imminent.

… [Trackback]
[…] Information on that Topic: coinchapter.com/cryptocurrency-price-analysis-today-sushiswap-sushi-ethereum-name-service-ens-terra-classic-lunc-reef-finance-reef/ […]
… [Trackback]
[…] Information to that Topic: coinchapter.com/cryptocurrency-price-analysis-today-sushiswap-sushi-ethereum-name-service-ens-terra-classic-lunc-reef-finance-reef/ […]
… [Trackback]
[…] Read More on that Topic: coinchapter.com/cryptocurrency-price-analysis-today-sushiswap-sushi-ethereum-name-service-ens-terra-classic-lunc-reef-finance-reef/ […]
… [Trackback]
[…] Read More on that Topic: coinchapter.com/cryptocurrency-price-analysis-today-sushiswap-sushi-ethereum-name-service-ens-terra-classic-lunc-reef-finance-reef/ […]
… [Trackback]
[…] Find More to that Topic: coinchapter.com/cryptocurrency-price-analysis-today-sushiswap-sushi-ethereum-name-service-ens-terra-classic-lunc-reef-finance-reef/ […]
… [Trackback]
[…] Find More to that Topic: coinchapter.com/cryptocurrency-price-analysis-today-sushiswap-sushi-ethereum-name-service-ens-terra-classic-lunc-reef-finance-reef/ […]