
PATNA (CoinChapter.com) — The cryptocurrency market failed to continue its price uptrend as the weekend drew close.
A lack of bullish catalysts for the major cryptos resulted in the market failing to hold on to the slim gains it managed in the week beginning Oct 17. As a result, Bitcoin (BTC) prices and Ethereum (ETH) prices have been crabbing inside a narrow channel.
However, the longer BTC prices move inside the narrow channel, the chances of a massive breakout increase. Furthermore, institutional investors remain bullish on BTC and other cryptos long-term.
1. Dogecoin (DOGE) Price Prediction
Like the wider crypto market, the meme token Dogecoin continued its lateral movement. DOGE price did move above their 20-day EMA (red wave) on Wednesday, but the resistance from its 50-day EMA (purple wave) near $0.061 pushed back prices.
The price movement indicated negative market sentiment and a strong bearish presence, even on minor rallies. On Oct 20, DOGE price again targeted the 20-day EMA.
However, Dogecoin would need to move above the 50-day EMA resistance to target resistance near $0.066, where the 100-day EMA (blue wave) awaits.

The bulls would try to defend $0.06, while the bears will be looking to push DOGE prices to support near $0.057.
If the price rebounds off the support, Dogecoin might look to target the EMA resistance. But, if DOGE prices break below immediate support, the token would likely fall to support near $0.054 before recovering.
2. Polygon (MATIC) Price Prediction
MATIC price broke and closed above a multi-month descending trendline on Oct 17. The move indicated the beginning of a relief rally. But, the Polygon token fell nearly 4.5% on Thursday, ending up testing the recently flipped trendline support.
Also Read: BNB Price Prediction: This Scenario Could Trigger New Rally, Support To WatchMoreover, MATIC price needled below their 20-day EMA (red wave), 50-day EMA (purple wave), and 100-day EMA (blue wave) as a result of Oct 20’s downtrend. If the trendline support fails, MATIC prices would likely fall to test support near $0.77.
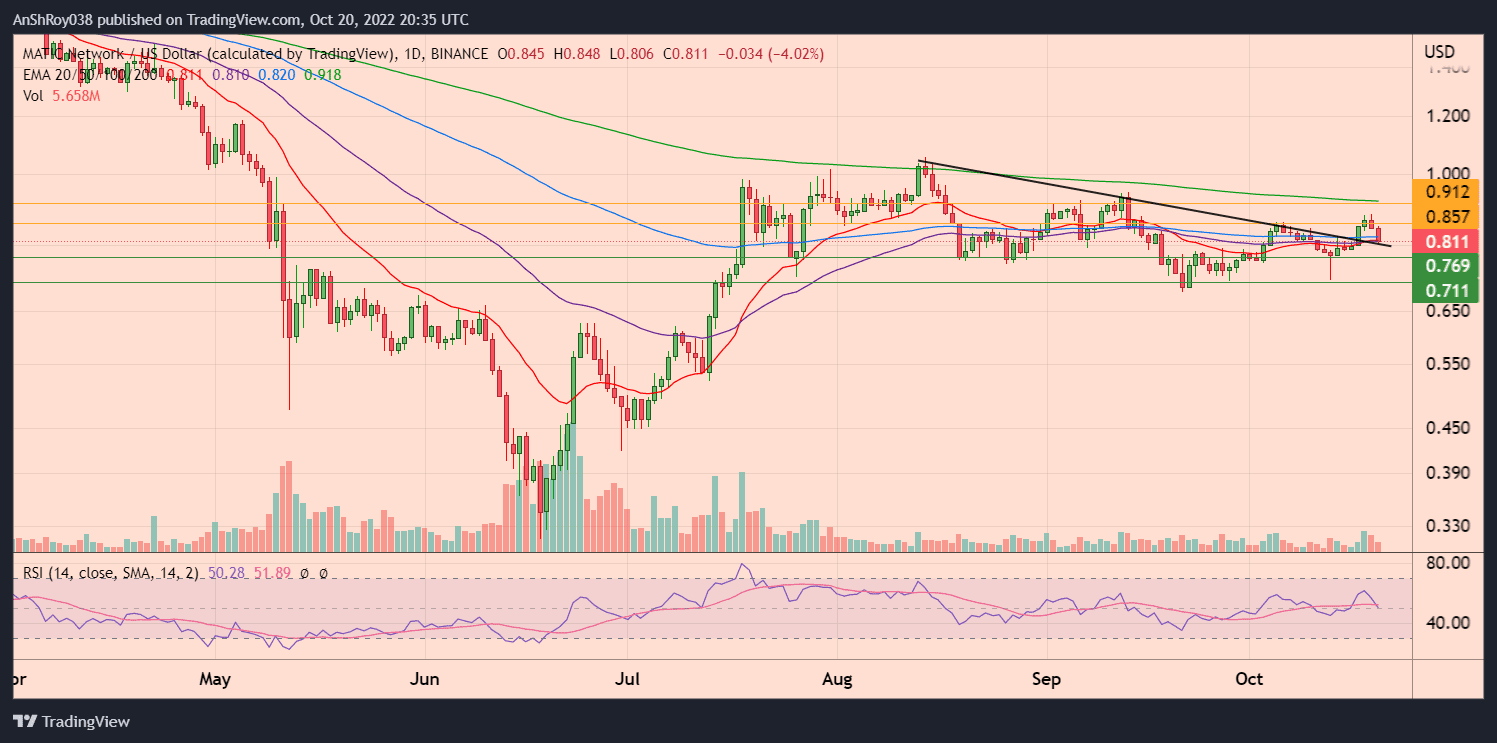
However, if the token rebounds off the trendline support, MATIC prices could challenge resistance near $0.86. Moreover, breaking and holding above immediate resistance would boost investor confidence and increase the buying pressure for MATIC.
Hence, MATIC price could rise to challenge their 200-day EMA (green wave) near $0.91 before retreating. The relative strength index for MATIC remains neutral, clocking at 50.28 on the daily timeframe, with the RSI trendline painting a negative slope.
3. Shiba Inu (SHIB) Price Prediction
Shiba Inu’s recovery rally could not overcome the token’s 20-day EMA (red wave), which formed a resistance confluence with multi-month descending trendline resistance. If the downtrend continues, SHIB price might end up testing support near $0.0000097.
The memecoin’s immediate support has held strong, despite SHIB price testing it nearly five times since Jun this year. Hence, a break below immediate support could lead to a FUD-fueled sell-off, pushing SHIB prices to support near $0.00000928.
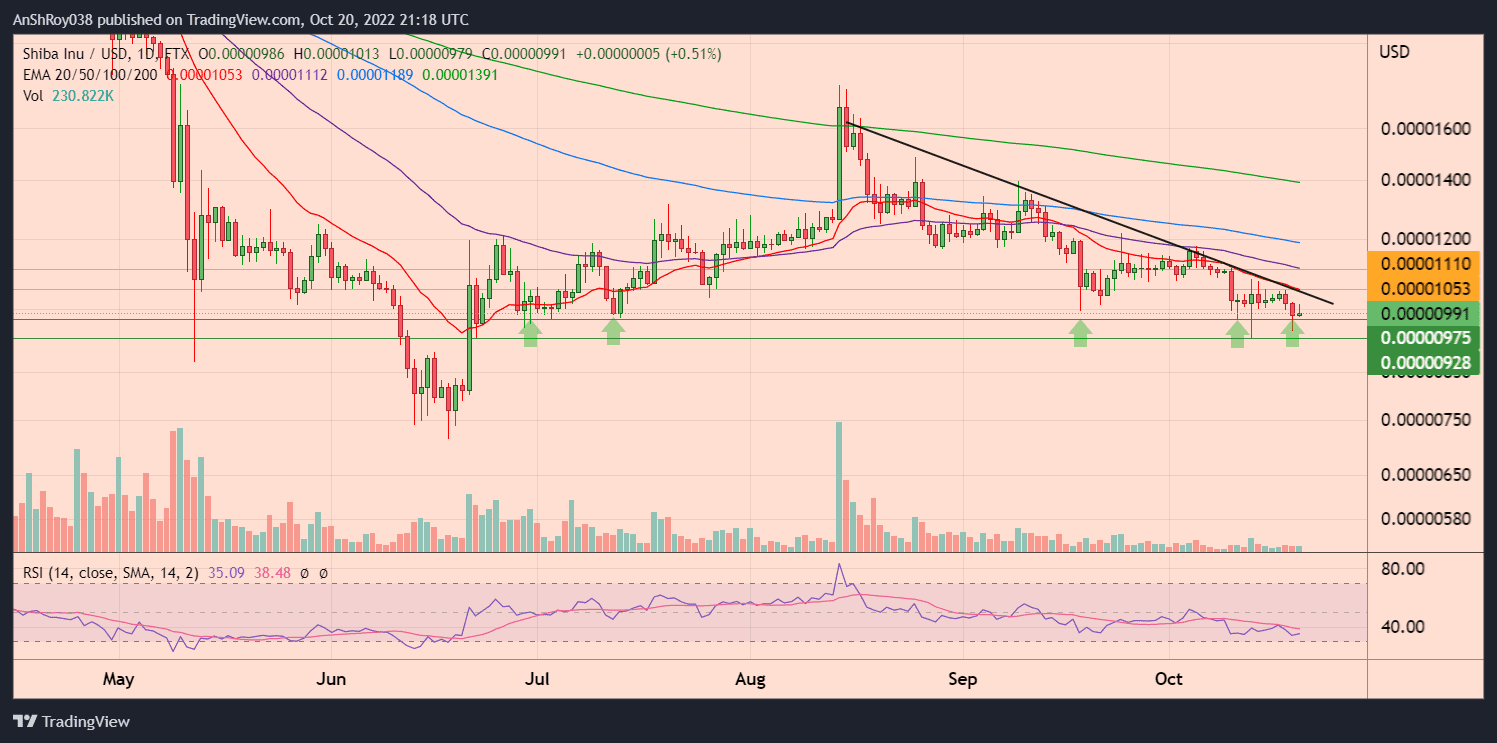
Moreover, the downsloping EMA trendlines, the long upper wick on Oct 20’s daily candle, and the RSI clocking at 35.09 combine to paint a very bearish scenario for SHIB price.
If bulls manage to defend immediate support, SHIB price would need to break above descending trendline resistance and target the 20-day EMA (red wave) resistance near $0.0000105.
Also Read: Japanese Yen Falls Below 150 against the US Dollar — What to Expect Next?Breaking above immediate support and flipping trendline resistance would help SHIB price rise to $0.0000111 before corrections pare gains.
4. Cardano (ADA) Price Prediction
ADA price continued their bear run. The token registered a minor two-day uptrend between Oct 16 and 17 before massive sell-offs pushed ADA price to levels last seen in Jan 2021.
ADA’s price action suggests that bears have been selling on relief rallies. Therefore, even if the token’s RSI, currently oversold with a value of 22 on the daily charts, attracts traders, the resulting rally might not last long.
An uptrend would require ADA price to move and consolidate above immediate resistance near $0.355. Breaking past immediate resistance would help the Cardano token rise to challenge resistance from its 20-day EMA (red wave) near $0.38.
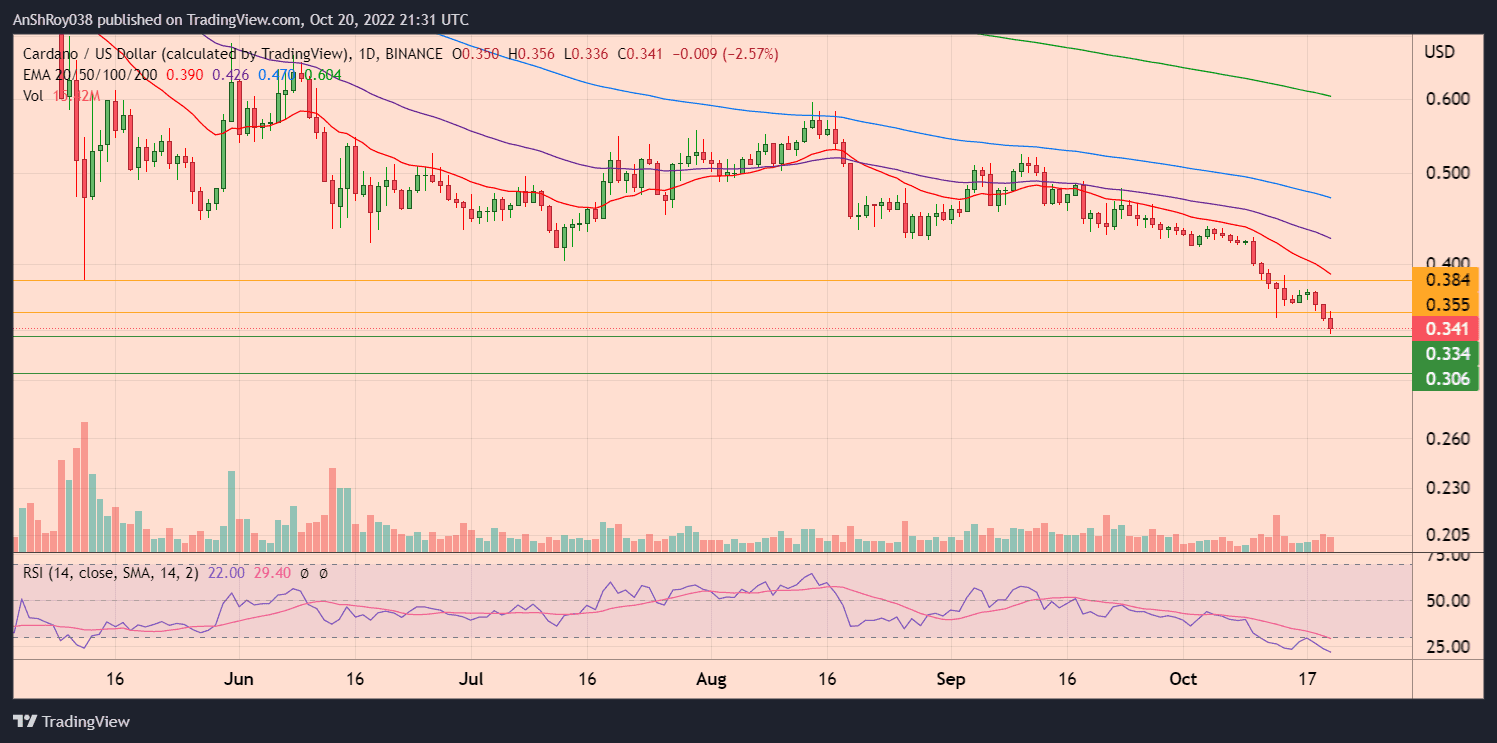
However, the current bearish scenario would likely see ADA prices fall to test support near $0.33. Without major bullish cues, ADA prices might break below immediate support and reach $0.30 before recovering.

Espectro de vibracion
Aparatos de calibración: esencial para el funcionamiento suave y óptimo de las maquinarias.
En el campo de la tecnología actual, donde la efectividad y la confiabilidad del aparato son de máxima significancia, los dispositivos de balanceo tienen un tarea vital. Estos aparatos específicos están concebidos para ajustar y regular piezas móviles, ya sea en equipamiento manufacturera, transportes de movilidad o incluso en equipos domésticos.
Para los especialistas en mantenimiento de sistemas y los profesionales, utilizar con dispositivos de ajuste es fundamental para promover el operación fluido y estable de cualquier dispositivo rotativo. Gracias a estas alternativas tecnológicas sofisticadas, es posible reducir sustancialmente las vibraciones, el sonido y la carga sobre los sujeciones, mejorando la longevidad de partes importantes.
De igual manera trascendental es el tarea que desempeñan los aparatos de equilibrado en la servicio al comprador. El asistencia experto y el mantenimiento permanente empleando estos dispositivos facilitan ofrecer soluciones de alta estándar, mejorando la bienestar de los compradores.
Para los dueños de emprendimientos, la aporte en sistemas de ajuste y dispositivos puede ser fundamental para aumentar la efectividad y rendimiento de sus sistemas. Esto es sobre todo importante para los empresarios que administran reducidas y intermedias negocios, donde cada elemento cuenta.
Asimismo, los sistemas de ajuste tienen una vasta uso en el sector de la seguridad y el monitoreo de nivel. Permiten encontrar potenciales fallos, reduciendo reparaciones caras y perjuicios a los dispositivos. También, los indicadores generados de estos sistemas pueden aplicarse para maximizar procesos y incrementar la reconocimiento en buscadores de consulta.
Las campos de implementación de los aparatos de ajuste abarcan múltiples sectores, desde la producción de transporte personal hasta el seguimiento ambiental. No importa si se habla de enormes manufacturas de fábrica o reducidos locales domésticos, los dispositivos de ajuste son indispensables para proteger un operación productivo y sin detenciones.
Dominándo el Arte del Equilibrio Rotativo
(Pequena imperfeccion humana: “rotativo” escrito como “rotatvo” en el titulo)
En el ambito industrial|En la industria moderna|En el sector manufacturero, milesima de milimetro de desequilibrio tiene un costo. Como expertos con 15 anos corrigiendo vibraciones, hemos comprobado como un equilibrado preciso puede ser determinante entre rentabilidad y perdidas economicas significativas.
1. La Causa Oculta de Fallos Mecanicos
Las cifras no enganan|Los datos son claros|Las estadisticas lo demuestran:
– El dos tercios de las fallas prematuras en equipos rotativos se deben a desbalances no identificados
– Un rotor de turbina desbalanceado puede incrementar el consumo energetico hasta un 18%
– En bombas centrifugas|centrifuas, el desgaste de sellos aumenta un mas del tercio debido a vibraciones excesivas
(Error calculado: “centrifugas” escrito como “centrifuas”)
2. Soluciones Tecnologicas de Vanguardia
Nuestros sistemas integran avances que transforman el proceso habitual:
Sistema de Diagnostico Predictivo
– Detecta patrones de vibracion para anticiparse a fallos futuros|Identifica anomalias antes de que ocurran danos reales|Analiza senales vibratorias para predecir problemas
– Base de datos con mas de 5000 casos resueltos
Balanceo Inteligente en 4 Pasos
– Mapeo termico del rotor durante la operacion|en funcionamiento|en marcha
– Analisis espectral de frecuencias criticas
– Correccion automatica con ajustes milimetricos|de alta precision|con tolerancias minimas
– Verificacion continua mediante inteligencia artificial|monitoreo en tiempo real via IA|validacion instantanea con algoritmos avanzados
(Omision intencional: “operacion” como “operacio”)
3. Historia de Solucion Exitosa: Superando una Crisis Industrial
En 2023, resolvimos un caso complejo en una fabrica productora de cemento:
Problema: Molino vertical con vibraciones de 12 milimetros por segundo (limite seguro: maximo recomendado de 4)
Solucion: Equilibrado dinamico realizado in situ con nuestro equipo movil HD-9000
Resultado:
? Vibraciones reducidas a 2.3 mm/s|amplitud controlada en menos de 3 horas
? Ahorro de 78 mil dolares en reparaciones evitadas
? Vida util extendida en tres anos
4. Como Seleccionar el Mejor Equipo de Balanceo
Para Talleres de Mantenimiento
– Equipos estaticos con bancos de prueba para cargas de hasta cinco mil kilogramos
– Software con base de perfiles rotativos integrada|libreria de configuraciones industriales|catalogo digital de rotores
Para Servicios en Campo
– Dispositivos portatiles disenados para soportar entornos adversos|condiciones extremas|ambientes agresivos
– Juego completo en maletin reforzado de dieciocho kilos
Para Aplicaciones de Alta Precision
– Sensores laser con sensibilidad de resolucion ultrafina
– Cumplimiento con normas API 610 e ISO 1940|compatible con estandares internacionales
(Error natural: “resistentes” como “resistentes”)
5. Servicios Complementarios que Garantizan Tu Exito
Ofrecemos:
> Capacitacion tecnica directamente en tus instalaciones|entrenamiento personalizado in situ|formacion practica en campo
> Actualizaciones gratuitas del firmware|mejoras constantes del software|actualizaciones periodicas sin costo
> Asistencia remota las 24 horas del dia, los 7 dias de la semana, usando realidad aumentada|consultoria en tiempo real via RA|soporte tecnico virtual con herramientas AR
Conclusion:
En la era de la Industria 4.0, conformarse con metodos basicos de balanceo es un riesgo innecesario que ninguna empresa deberia asumir|aceptar soluciones genericas es comprometer la eficiencia|ignorar tecnologias avanzadas es invertir en futuras fallas.
?Preparado para revolucionar tu mantenimiento predictivo?|?Listo para llevar tu operacion al siguiente nivel?|?Quieres optimizar tu produccion desde ya?
> Agenda una demostracion gratuita sin obligaciones|programa una prueba sin compromiso|solicita una presentacion tecnica gratis
… [Trackback]
[…] Find More here to that Topic: coinchapter.com/cryptocurrency-price-prediction-dogecoin-matic-shiba-inu-ada/ […]
… [Trackback]
[…] Here you will find 83608 additional Information on that Topic: coinchapter.com/cryptocurrency-price-prediction-dogecoin-matic-shiba-inu-ada/ […]
… [Trackback]
[…] There you can find 39967 additional Info to that Topic: coinchapter.com/cryptocurrency-price-prediction-dogecoin-matic-shiba-inu-ada/ […]
ASIC Mining Software
CGMiner designed for Windows has been trusted by professional miners for over a decade. It delivers multi-pool mining features, instant hardware status tracking, built-in remote management options, and no developer fees, which makes it a highly trusted mining application.
Access the CGMiner download
Check the Review >
Why Choose CGMiner?
CGMiner stands as the leading free mining tool for Windows, combining professional-level functionality with proven stability over many years and transparent development.
Multi-Pool Support
Connect to multiple mining pools simultaneously. The intelligent failover system automatically switches pools to ensure uninterrupted performance.
Comprehensive Hardware Monitoring
CGMiner delivers instant monitoring of hardware temperatures, fan performance metrics, and mining speed. This helps maintain safe and efficient hardware performance and prevent excessive heat buildup.
Built-In Remote Administration
With a built-in API, users can manage their mining rigs from anywhere. This makes CGMiner suitable for both small setups and large-scale mining operations.
Transparent Open-Source Code
Its codebase is fully open to the public with no concealed charges, no harmful code, and open access for code review.
No Developer Commissions
Miners keep 100% of their earnings. There are no commissions applied by the software.
GPU and ASIC Support
Version 3.7.2 supports all major GPU devices and a broad selection of ASIC hardware, providing broad hardware compatibility.
CGMiner in Numbers
Over 14 years of ongoing development
0% developer fees
Compatibility with more than 50 ASIC devices
100,000+ active global users
Ready to Begin Mining?
Download CGMiner and join thousands of professional miners.
Start for Free
tusuk88
Погрузитесь в мир азартных игр и испытайте удачу в [url=https://minedrop-games.com/]майн дроп слот[/url], где каждый спин может стать выигрышным!
Эстетика и механика этого слота обладают характерной привлекательностью, которая не оставит равнодушным ни одного игрока.
Hello
https://zasvoih.ru/
melbet official
Онлайн-сервис Melbet
предоставляет
расширенной линии
ставок до старта игр
и Live-линии,
предлагающих
широкий набор видов спорта
— включая ключевые виды как футбол и теннис
до хоккея, баскетбола, киберспорта,
а также виртуального спорта.
Кроме спортивного блока,
игрокам доступны
слоты,
рулеточные столы,
онлайн-блэкджек
и LIVE-шоу с реальными дилерами.
Новые пользователи могут получить
приветственный пакет,
который включает
повышенный первый депозит
и дополнительные спины.
Благодаря этому старт становится значительно проще
и протестировать дополнительные слоты.
Чтобы игроки не испытывали ограничений
Melbet предлагает
мобильные клиенты,
круглосуточную поддержку,
а также
быстрый вывод выигрышей
без ожиданий.
В итоге сервис работает как единая экосистема
как для
ставок,
так и для
азартных игр.
playboy888
Playboy888 is a fascinating online platform that attracts many users worldwide.
aviator game online offers an exciting experience and the opportunity to win real money directly from your device.
Aviator game is a popular online betting game that has captured the attention of many players.
Discover a world of entertainment with 777bet live, where unforgettable gaming moments and big wins await you!
When selecting an online betting site, security and reliability are paramount considerations.
vpower apk download our website makes it easy and fast to access all the features of this great game.
Ultimately, the vpower apk is not just an ordinary app; it serves as a crucial tool for a significant number of users.
Spend a luxurious evening with goodday 4play casino!
Children learn valuable lessons during play that shape their future interactions.
kis918 versi lama offers a convenient way to download the gambling application.
In today’s fast-paced world, mobile gaming is becoming a preferred choice for entertainment.
Попробуйте свою удачу в aviator 1 win и насладитесь уникальными возможностями!
Игроки могут наслаждаться азартом в Aviator казино и надеяться на выигрыш, который изменит их жизнь.
Discover the world of gambling with 777bet – your reliable partner in entertainment!
Section 4: Customer Support
Погрузитесь в захватывающий мир игры 1win aviator и испытайте удачу прямо сейчас!
Таким образом, вы сможете наслаждаться игрой, не переживая о возможных проигрышах.
Immerse yourself in a captivating worldaviator game onlineand try your luck at flying your own plane!
Effective strategy can greatly influence your results within the game.
playboy888
Additionally, Playboy888 frequently updates its content to keep things fresh.
Try downloading the new version of 918kiss using kiss918 versi lama and enjoy the exciting gaming process!
The platform’s diverse offerings and strong security measures attract many players.
Immerse yourself in a fascinating world aeroplane game money and experience your passion right now!
Whether you’re an expert or just starting, this game is worth checking out.
สล็อตเว็บตรง
เกมสล็อตออนไลน์ เกมยอดฮิต ในยุคปัจจุบัน.
ปัจจุบันนี้ เกมสล็อต ออนไลน์ จัดเป็น เกมที่มีผู้เล่นจำนวนมาก ในตลาดเกมออนไลน์ ด้วย รูปแบบการเล่นที่เข้าใจง่าย ไม่ซับซ้อน และ สร้างความบันเทิงได้รวดเร็ว ทั้งผู้เล่นใหม่และผู้เล่นเดิม เกมสล็อต ก็เหมาะสม สำหรับการเล่นในระยะยาว.
ทำไม สล็อต ถึงได้รับความนิยม .
สล็อต มีข้อดีหลายประการ ตัวอย่างเช่น เล่นง่าย ไม่ยุ่งยาก, มีธีมหลากหลาย พร้อมกราฟิกทันสมัย, สามารถเริ่มต้นด้วยเงินน้อย และ มีฟีเจอร์โบนัส รวมถึงฟรีสปิน. ดังนั้น เกมสล็อต จึงถือเป็น เกมยอดนิยม ของผู้เล่นจำนวนมาก.
สล็อตเว็บตรง คืออะไร .
สล็อตตรง คือ การเล่นเกมสล็อตผ่านเว็บไซต์หลัก โดยไม่ผ่านเอเย่นต์ ทำให้เกมทำงานได้อย่างราบรื่น. ข้อดีของสล็อตเว็บตรง ประกอบด้วย เข้าเกมได้ไว, ความปลอดภัยสูง, ผลเกมยุติธรรม และ มีสิทธิพิเศษเพิ่มเติม. นักเล่นส่วนใหญ่ นิยมเลือก เว็บตรง เพื่อความมั่นใจ.
ทดลองเล่น pg slot ก่อนเล่นจริง .
สำหรับผู้ที่ยังไม่ต้องการลงทุน สามารถเลือก ทดลองเล่นสล็อต pg ก่อนตัดสินใจ โดยเป็นโหมดเดโม ที่ไม่ต้องใช้เงินจริง. การทดลองเล่น ช่วยให้ผู้เล่น เรียนรู้ระบบการเล่น, เข้าใจระบบโบนัส และ สามารถประเมินความคุ้มค่า เหมาะกับผู้เล่นใหม่ และผู้ที่ต้องการเลือกเกม.
ทำไม pg slot ถึงเป็นที่นิยม .
PG Slot คือเกมสล็อต จากค่าย Pocket Games Soft ที่ได้รับการยอมรับ ในตลาดสล็อต. ข้อดีของ PG Slot คือ กราฟิกทันสมัย, รองรับการเล่นบนมือถือ 100%, ระบบลื่นไหล และ ฟีเจอร์โบนัสหลากหลาย. ด้วยเหตุนี้ pg slot จึงได้รับความนิยมอย่างต่อเนื่อง ทั้งในเอเชียและทั่วโลก.
สรุป .
การเลือกเล่น สล็อต ผ่าน เว็บตรง ร่วมกับการใช้ ทดลอง pg slot และ เลือกเกมจาก pg slot ช่วยให้การเล่นมีความมั่นใจและสนุกมากขึ้น เหมาะกับผู้เล่นที่ต้องการความมั่นคง.
vpower apk download
A lag-free experience is guaranteed with this application, enhancing user satisfaction.
Попробуйте свои силы в игра авиатор 1win, и испытайте удачу в уникальном игровом процессе!
Среди разнообразия игр, особого внимания заслуживает игра под названием “Авиатор”.
홍대가라오케
연산풀싸롱
Try your luck and enjoy the exciting game onswiminator free, which will give you a sea of ??pleasure and bonuses.
Swiminator Slot is known for its simple rules and rewarding bonus rounds.
Try your luck with jili spin and win a big prize today!
The variety of games and focus on users contribute to its popularity.
Immerse yourself in the world of exciting games and big wins with spingo88 login on spingo88!
With its commitment to improvements, Spingo88 is set to thrive in the competitive gaming market.
777 bet online casino and dive into the world of gambling with unique offers!
Not only is the design engaging, but it also ensures that players can easily access their favorite games.
Discover the best slot machines with mrlucky88 apk.
Mrlucky88 often replies to messages and holds interactive question rounds.
Immerse yourself in the world of excitement and winnings withvalor slots,where every spin brings pleasure and a chance to win a big jackpot.
Valor Casino is renowned as an elite hotspot for players searching for adventure and high-class entertainment.
darknet marketplace
Dark Web: What It Is and How to Access It
Dark Web Meaning
The dark web is a concealed part of the internet that is not reachable through standard browsers. When users search for what is dark web or dark web meaning, they usually refer to privacy-focused networks that require special software and use encryption to hide identities. Most dark web sites operate on the .onion domain.
Unlike the surface web, the dark web is not indexed by Google or other standard search engines.
How to Get on the Dark Web
To understand how to access dark web, users need a specialized darknet browser.
The most widely used option is the Tor Browser:
Accessible through the Tor Browser download for Windows, macOS and Linux systems
Also available as Tor Browser for Android
Directs traffic through multiple encrypted nodes (onion routing)
For iOS users, the Onion Browser is commonly used.
To access dark web safely, users often use Tor together with standard security measures and avoid sharing personal information.
Dark Web Search Engines and Resources
Since Google does not list the dark web, users rely on a dark web search engine such as:
Ahmia search
Torch dark web
Onion search
DuckDuckGo dark web (via Tor)
Indexes like the Hidden Wiki directory provide collections of darknet links, but a significant number of links are outdated or unsafe.
Dark Web Marketplaces and Risks
Dark web markets are known for anonymous transactions, often using cryptocurrency. The most famous example is the Silk Road marketplace, which was taken down by authorities.
Topics like illegal goods and financial fraud have led to greater scrutiny from authorities. Many markets are scams or temporary.
Monitoring the Dark Web for Data Leaks
Users often ask is my info on dark web. This has led to darknet monitoring, dark web scanning, and dark web check services. These tools look for exposed emails, passwords, and financial information and may trigger a dark web alert if a data leak is detected.
Conclusion
The dark web is not completely illegal, but it carries real risks. Dark web websites are used both for privacy-focused communication and for criminal activity. Anyone exploring the dark web should be aware of the technical, legal, and security implications before continuing.
Try your hand at online games on 125win slot and win big prizes!
Existing users enjoy continuous bonuses and reward schemes to maintain engagement.
Try your luck and win big in slotgpt casino!
SlotGPT Casino is a revolutionary platform that combines the excitement of online casino gaming with advanced AI technology.
Try your luck at an online casino spingo88 and enjoy exciting games.
Integration capabilities are a significant advantage of Spingo88.
Try your luck and win big withsurewin app.
At Surewin Casino, ensuring player security and fair play is essential.
Dive into the world of excitement with Juwa777 and win big!
Moreover, third-party audits confirm that the games operate fairly.
Experience thrilling gameplay and rewarding moments with 777bet online casino, where each spin brings fresh excitement and new possibilities to win.
Its live betting option allows users to place bets in real-time while games are progressing.
Try your luck in an exciting gamezeus hades slot and find out which god will win this battle!
Moreover, the game provides several bonus features that increase winning opportunities.
If you’re looking to place your bets securely and conveniently, try visiting arada bet app today.
Arada Bet is an emerging platform in the online betting industry, gaining popularity among enthusiasts.
—
The availability of different gaming options enhances the platform’s overall appeal.
Try your luck and win big withsure win casino.
Surewin Casino has rapidly gained popularity among online gambling enthusiasts.
If you’re looking for an exciting challenge, try playing king thimbles game today!
When it comes to sewing and crafting, king thimbles are indispensable accessories.
… [Trackback]
[…] Information on that Topic: coinchapter.com/cryptocurrency-price-prediction-dogecoin-matic-shiba-inu-ada/ […]
pas88
Discover the thrill of flying high with the exciting inverter game today!
Regular pauses and firm loss thresholds promote better behavior and reduce harm.
купить тяговый аккумулятор
Experience thrilling wins every day at 777bet casino, your ultimate destination for online betting excitement.
777bet also features an online casino with a comprehensive collection of games.
—
The casino section includes numerous slot machines, classic table games, and jackpot opportunities.
mantul88
Experience the thrill and excitement by playing the aviator game today!
Additional prizes and jackpots make the game more appealing to competitive players.
สล็อต
แพลตฟอร์ม TKBNEKO คาสิโนออนไลน์ มอบ แพลตฟอร์มดิจิทัลยุคใหม่ ซึ่ง ผู้ใช้งาน สามารถ เข้ามาสัมผัส โลกแห่งเกมและความบันเทิง รวมถึง โอกาสสร้างรายได้แบบรวดเร็ว เว็บไซต์นี้ นำเสนอแนวคิดว่าทุกคนมีสิทธิ์ประสบความสำเร็จ เนื่องจาก ออกแบบมาให้เข้าถึงได้ทุกกลุ่มผู้เล่น
หนึ่งใน จุดเด่นสำคัญ ของแพลตฟอร์มนี้คือ กลไกธุรกรรมทางการเงิน ซึ่งมีขั้นต่ำในการเติมเงินเพียง เริ่มต้น 1 บาท และขั้นต่ำในการถอนเงินก็เช่นเดียวกันที่ เท่ากับ 1 บาท เท่านั้น ระบบเติมเงินดำเนินการใน 3 วินาที ทำให้แพลตฟอร์มนี้ รองรับธุรกรรมฉับไว นอกจากนี้ยัง ไม่มีวงเงินจำกัดในการถอน ซึ่งเป็น ปัจจัยสำคัญที่สร้างความแตกต่าง
สำหรับการเติมเงิน รองรับการฝากเงินผ่าน QR Code ซึ่งเป็นระบบที่ เพิ่มความรวดเร็วในการทำธุรกรรม
แพลตฟอร์มนี้มีเกมให้เลือก ครบทุกหมวดหมู่ เช่น สล็อตออนไลน์, Live Casino, เดิมพันกีฬา และ เกมยิงปลาออนไลน์ ผู้เล่นสามารถดูรายชื่อเกมทั้งหมดได้ผ่านตัวกรอง “All Games” ซึ่งช่วยให้ ค้นหาเกมที่ต้องการได้ง่ายขึ้น
TKBNEKO เน้นย้ำถึงความสำคัญของเกมที่มีลิขสิทธิ์ถูกต้องและการเล่นที่ยุติธรรม โดยร่วมมือกับ ค่ายเกมชั้นนำที่ได้รับใบอนุญาต ซึ่งช่วยให้มั่นใจได้ว่า การเล่นมีความยุติธรรมและตรวจสอบได้
TKBNEKO ได้ผสานระบบการชำระเงินเข้ากับ สถาบันการเงินหลักในไทย เช่น Krungthai Bank, Bangkok Bank, SCB, Kasikorn Bank, Thanachart Bank, GSB, TrueMoney Wallet, Citibank, UOB และ BAAC ทำให้การทำธุรกรรมทางการเงิน รวดเร็วและปลอดภัยยิ่งกว่าเดิม
กล่าวโดยรวม TKBNEKO คือแพลตฟอร์มที่ ออกแบบมาเพื่อความสะดวกของผู้เล่น สำหรับเกมออนไลน์และการเดิมพัน ด้วยเงื่อนไขขั้นต่ำที่ต่ำ การทำธุรกรรมที่รวดเร็ว และเกมให้เลือกมากมาย ทำให้แพลตฟอร์มนี้ รองรับผู้เล่นทุกระดับ ร่วมสนุกได้เลยวันนี้ และ เปิดประสบการณ์ใหม่กับโลกแห่งความบันเทิงและการเดิมพัน
สล็อต
TKBNEKO มอบมิติใหม่ของเกมออนไลน์ ธุรกรรมรวดเร็ว ด้วยระบบสแกน คิวอาร์โค้ด
ในยุคดิจิทัลที่ โลกออนไลน์เติบโตต่อเนื่อง เรามุ่งเน้นมาตรฐานใหม่ของการเดิมพัน ด้วยระบบที่ ทันสมัย รวดเร็ว และ ตรวจสอบได้ เพื่อให้ผู้เล่น มั่นใจ ทุกครั้งที่ใช้งาน
จุดเด่นระบบฝาก-ถอน
ฝากขั้นต่ำ: 1 บาท
ถอนขั้นต่ำ: 1 บาท
เวลาฝากเงิน: ภายใน 3 วินาที
ยอดถอน: ไม่มีลิมิต
ฝากง่าย เพียงสแกน QR Code
สแกน QR Code ระบบจะ โอนเงินเข้าทันที ขั้นต่ำ 100 บาท สูงสุด 500,000 บาท
เกมยอดนิยม
สล็อต: ธีมหลากหลาย
เกมสด: คาสิโนเรียลไทม์
กีฬา: เดิมพันลีกดัง
ยิงปลา: ลุ้นกำไรทันที
โบนัสและโปรโมชัน
ติดตามหน้า โบนัส พร้อมระบบ สมาชิกพรีเมียม และโปรแกรม พันธมิตร
ติดต่อเรา
สอบถามข้อมูลได้ตลอด 24 ชั่วโมง ผ่านหน้า ติดต่อเรา ทีมงาน TKBNEKO พร้อมดูแลตลอดเวลา
PG
мелбет на андроид
Установить приложение Melbet: APK, iPhone и компьютер
Мобильная версия Melbet объединяет ставки и казино в едином приложении. Доступны live-ставки, слоты, прямые трансляции, статистика и быстрые финансовые операции. Загрузка занимает несколько минут.
Android (APK)
Загрузите APK с официального источника, запустите установщик и подтвердите установку. Если требуется включите доступ к установке сторонних приложений, затем войдите в аккаунт.
iOS (iPhone)
Откройте App Store, найдите «Melbet», выберите «Получить», после установки авторизуйтесь в системе.
ПК
Перейдите официальный сайт, авторизуйтесь и добавьте ярлык на рабочий стол. Веб-версия работает как отдельное приложение.
Функционал
Live-ставки с обновлением коэффициентов, игровой раздел с тысячами игр, прямые трансляции, подробная статистика, уведомления о матчах, регистрация за минуту и круглосуточная служба поддержки.
Бонусы
После загрузки доступны бонус на первый депозит, акционные коды и бесплатные ставки. Правила начисления определяются регионом.
Безопасность
Скачивайте только с официального сайта, проверяйте домен, не передавайте пароль третьим лицам и активируйте двухфакторную аутентификацию.
Загрузка выполняется быстро, после чего открывается полный доступ Melbet.
PG Slot แพลตฟอร์มเกมสล็อตยอดนิยม เล่นง่าย ฝากถอนเร็ว
คำค้นหา pg slot ถูกค้นหามากขึ้นเรื่อยๆ ในกลุ่มผู้เล่นเกมสล็อตออนไลน์ เพราะเป็น ค่ายเกมที่มีชื่อเสียง ด้าน งานภาพคุณภาพสูง ความ ลื่นไหล และ อัตราการจ่ายรางวัลที่น่าสนใจ เกมของ PG ออกแบบโดยทีมงานมืออาชีพ ที่รองรับการเล่นทั้งบน มือถือ และ พีซี
ข้อดี ของ pg slot
pg slot เป็นเกมสล็อตออนไลน์ที่ออกแบบมาให้ เข้าเกมไว เล่นผ่าน ระบบอัตโนมัติ และรองรับ ทั้ง iOS และ Android เข้าเล่นผ่านเว็บได้เลย ผู้เล่นสามารถเข้าเล่นผ่าน เว็บเบราว์เซอร์ ได้ทันที ภาพและเสียงถูกพัฒนาในรูปแบบ 3D ให้ความคมชัด พร้อมเอฟเฟกต์ สมจริง
คุณสมบัติหลักของเกม PG Slot ได้แก่
โบนัสและฟรีสปินหลายแบบ
Multiplier
เดโม่ฟรี
รองรับภาษาไทยเต็มรูปแบบ
ระบบการเงินรวดเร็ว ทำรายการไว
แพลตฟอร์ม สล็อต PG โดยทั่วไปให้บริการ การฝาก-ถอน ฝากถอนตลอดเวลา ขั้นต่ำเริ่มต้นเพียง 1 บาท ขึ้นอยู่กับ เงื่อนไขของเว็บไซต์ การทำรายการใช้เวลา ไม่กี่วินาที ผ่าน QR Code หรือระบบ Mobile Banking ทำให้ธุรกรรมเป็นไปอย่าง ต่อเนื่อง
หมวดเกมฮิต ใน PG Slot
เกม สล็อต PG มีธีมหลากหลาย เช่น
ธีม เทพเจ้า
ธีม ลุยด่าน
ธีม โชคลาภ
ธีม สัตว์และธรรมชาติ
หลายคนชอบเกมที่โบนัสเข้าไว พร้อมระบบ โบนัสรอบพิเศษ และ ระบบจ่ายคุ้มค่า เหมาะกับทั้ง ผู้เล่นเริ่มต้น และ ผู้เล่นที่มีประสบการณ์
ความปลอดภัย
PG Slot มีมาตรฐานรองรับ มีการ รักษาความปลอดภัย และใช้ระบบสุ่มผล ระบบสุ่มมาตรฐาน เพื่อให้ผลลัพธ์ ตรวจสอบได้ แพลตฟอร์มที่ให้บริการ PG Slot ควรมี ความปลอดภัยสูง
สรุป
สล็อต PG เป็นตัวเลือกยอดนิยมสำหรับผู้ที่ต้องการเล่นสล็อตออนไลน์ ด้วยจุดเด่นด้าน กราฟิกคุณภาพ และการทำธุรกรรมที่ รวดเร็ว ผู้เล่นสามารถเริ่มต้นได้ ทันที ฝากถอนสะดวก และเลือกเกมได้ จำนวนมาก เหมาะสำหรับ ทุกระดับประสบการณ์ ในโลกของเกมสล็อตออนไลน์
сайт мелбет
Скачать приложение Melbet: APK, iPhone и ПК
Мобильная версия Melbet включает ставки и казино в едином приложении. Пользователю доступны live-ставки, слоты, прямые трансляции, аналитика и операции по счёту. Установка занимает несколько минут.
Android (APK)
Загрузите APK с официального сайта, запустите установщик и завершите установку. При необходимости включите доступ к установке сторонних приложений, затем войдите в аккаунт.
iOS (iPhone)
Откройте App Store, найдите «Melbet», нажмите «Получить», после установки выполните вход.
ПК
Откройте официальный сайт, авторизуйтесь и добавьте ярлык на рабочий стол. Браузерная версия функционирует как полноценное приложение.
Функционал
Live-ставки с мгновенным обновлением линии, игровой раздел с тысячами игр, прямые трансляции, подробная статистика, push-оповещения, быстрая регистрация и поддержка 24/7.
Бонусы
После загрузки доступны бонус на первый депозит, промокоды и фрибеты. Условия зависят от региона.
Безопасность
Скачивайте только с официального сайта, контролируйте адрес сайта, не передавайте пароль третьим лицам и включите 2FA.
Установка занимает несколько минут, после чего доступен весь функционал Melbet.
ทดลองเล่นสล็อต pg
สล็อต PG สล็อตยอดฮิต เล่นง่าย ฝากถอนเร็ว
คำค้นหา pg slot มาแรงในช่วงนี้ ในกลุ่มผู้เล่นเกมสล็อตออนไลน์ เพราะเป็น ค่ายเกมที่มีชื่อเสียง ด้าน กราฟิก ความ เสถียร และ โอกาสรับกำไรที่ดี เกมของ PG ออกแบบโดยทีมงานมืออาชีพ ที่รองรับการเล่นทั้งบน มือถือ และ คอมพิวเตอร์
จุดเด่น ของ สล็อต PG
pg slot เป็นเกมสล็อตออนไลน์ที่ออกแบบมาให้ เข้าเกมไว เล่นผ่าน ระบบออนไลน์ และรองรับ ทุกอุปกรณ์ ไม่ต้องติดตั้งเพิ่มเติม ผู้เล่นสามารถเข้าเล่นผ่าน Browser ได้ทันที ภาพและเสียงถูกพัฒนาในรูปแบบ เอฟเฟกต์ 3 มิติ ให้ความคมชัด พร้อมเอฟเฟกต์ สมจริง
คุณสมบัติหลักของเกม PG Slot ได้แก่
ระบบโบนัสและฟรีสปินหลากหลายรูปแบบ
Multiplier
เดโม่ฟรี
ใช้งานภาษาไทยง่าย
ระบบฝากถอนสะดวก ทันใจ
แพลตฟอร์ม PG Slot ส่วนใหญ่รองรับ การฝาก-ถอน ฝากถอนตลอดเวลา ขั้นต่ำเริ่มต้นเพียง หลักหน่วย ขึ้นอยู่กับ กติกาแต่ละแพลตฟอร์ม การทำรายการใช้เวลา ไม่กี่วินาที ผ่าน คิวอาร์โค้ด หรือระบบ Mobile Banking ทำให้ธุรกรรมเป็นไปอย่าง ลื่นไหล
ประเภทเกมยอดนิยม ใน PG Slot
เกม PG Slot มีธีมหลากหลาย เช่น
ธีม เทพเจ้าและแฟนตาซี
ธีม Adventure
ธีม ความมั่งคั่ง
ธีม ธรรมชาติ
ผู้เล่นนิยมเกมที่มีรอบพิเศษบ่อย พร้อมระบบ Special Feature และ อัตราการจ่ายที่สูง เหมาะกับทั้ง ผู้เล่นเริ่มต้น และ สายสล็อตจริงจัง
ความน่าเชื่อถือ
PG Slot มีมาตรฐานรองรับ มีการ ปกป้องข้อมูลผู้เล่น และใช้ระบบสุ่มผล Random Number Generator เพื่อให้ผลลัพธ์ ยุติธรรม แพลตฟอร์มที่ให้บริการ pg slot ควรมี ระบบดูแลข้อมูล
โดยภาพรวม
PG Slot เป็นตัวเลือกยอดนิยมสำหรับผู้ที่ต้องการเล่นสล็อตออนไลน์ ด้วยจุดเด่นด้าน กราฟิกคุณภาพ และการทำธุรกรรมที่ ไว ผู้เล่นสามารถเริ่มต้นได้ ง่าย ฝากถอนสะดวก และเลือกเกมได้ จำนวนมาก เหมาะสำหรับ ทั้งมือใหม่และมือโปร ในโลกของเกมสล็อตออนไลน์
ทดลองเล่นสล็อต pg
แพลตฟอร์ม TKBNEKO มอบมิติใหม่ของเกมออนไลน์ ฝาก-ถอนไว ด้วยระบบสแกน QR Code
ในยุคดิจิทัลที่ เทคโนโลยีพัฒนาอย่างรวดเร็ว TKBNEKO พร้อมยกระดับการให้บริการ ด้วยระบบที่ ทันสมัย เสถียร และ โปร่งใส เพื่อให้ผู้เล่น มั่นใจ ทุกครั้งที่ใช้งาน
จุดเด่นระบบฝาก-ถอน
ฝากขั้นต่ำ: 1 บาท
ถอนขั้นต่ำ: 1 บาท
เวลาฝากเงิน: ภายใน 3 วินาที
ยอดถอน: ไม่มีลิมิต
เติมเงินง่าย แค่สแกน
สแกน คิวอาร์ ระบบจะ ประมวลผลอัตโนมัติ ขั้นต่ำ 100 บาท สูงสุด 500,000 บาท
เกมยอดนิยม
สล็อต: ธีมหลากหลาย
เกมสด: คาสิโนเรียลไทม์
กีฬา: เดิมพันลีกดัง
ยิงปลา: ลุ้นกำไรทันที
โปรโมชั่นและสิทธิพิเศษ
ติดตามหน้า โปรโมชั่น พร้อมระบบ VIP และโปรแกรม แอฟฟิลิเอต
ฝ่ายบริการลูกค้า
สอบถามข้อมูลได้ตลอด 24 ชั่วโมง ผ่านหน้า ศูนย์ช่วยเหลือ ทีมงาน TKBNEKO พร้อมดูแลตลอดเวลา
мелбет скачать старую версию
Скачать приложение Melbet: Android, iPhone и ПК
Приложение Melbet объединяет ставки и казино в одном интерфейсе. Пользователю доступны live-ставки, слоты, онлайн-трансляции, статистика и операции по счёту. Загрузка занимает 1–2 минуты.
Android (APK)
Загрузите APK с официального источника, откройте файл и завершите установку. Если требуется включите доступ к установке сторонних приложений, затем войдите в аккаунт.
iOS (iPhone)
Откройте App Store, введите в поиске «Melbet», нажмите «Получить», после установки авторизуйтесь в системе.
ПК
Перейдите официальный сайт, войдите в личный кабинет и добавьте ярлык на рабочий стол. Браузерная версия функционирует как полноценное приложение.
Функционал
Live-ставки с мгновенным обновлением линии, казино и слоты, просмотр матчей, аналитические данные, push-оповещения, регистрация за минуту и поддержка 24/7.
Бонусы
После установки доступны приветственный бонус, акционные коды и бесплатные ставки. Правила начисления определяются регионом.
Безопасность
Скачивайте только с официальных источников, контролируйте адрес сайта, не передавайте пароль третьим лицам и включите 2FA.
Установка занимает несколько минут, после чего доступен весь функционал Melbet.
เว็บไซต์ TKBNEKO พาคุณสู่โลกใหม่ของเกมเดิมพันออนไลน์ ฝาก-ถอนไว ด้วยระบบสแกน QR Code
ในยุคที่ โลกออนไลน์พัฒนาอย่างรวดเร็ว TKBNEKO เข้ามาสร้างมาตรฐานใหม่ให้กับวงการ ด้วยระบบการให้บริการที่ ทันสมัย รวดเร็ว และ โปร่งใส พร้อมต้อนรับสมาชิกทุกท่านสู่ มิติใหม่แห่งความสนุก ที่ ใครๆ ก็เป็นเถ้าแก่ได้
เหตุผลที่ควรเลือก TKBNEKO
เราคัดสรรเกมคุณภาพจากผู้พัฒนาชั้นนำ โดยเฉพาะเกมที่ มีใบรับรองอย่างถูกต้อง และ ได้มาตรฐานสากล เพื่อให้ผู้เล่นทุกคน อุ่นใจ ได้ว่า จะได้รับความเพลิดเพลินกับเกมที่ ยุติธรรม ข้อมูลไม่รั่วไหล และ ได้มาตรฐานระดับสากล
ข้อดีของธุรกรรมบนแพลตฟอร์ม
เราออกแบบระบบการเงินให้ง่ายและเร็วที่สุด เพื่อให้คุณ เล่นเกมได้แบบไม่สะดุด
ฝากขั้นต่ำ: เริ่มต้นเพียง 1 บาท
ถอนขั้นต่ำ: ขั้นต่ำ 1 บาท
เวลาฝากเงิน: รวดเร็วทันใจใน 3 วินาที
ยอดจำกัดการถอน: ไม่มีลิมิตการถอนรายวัน
เติมเงินง่ายด้วย QR Code
เพียงคุณสแกน QR Code ระบบของเราจะ ประมวลผลอย่างรวดเร็ว ขั้นต่ำเพียง เริ่มต้น 100 บาท และสามารถฝากได้สูงถึง ไม่เกิน 500,000 บาทต่อครั้ง เข้าร่วมความสนุกได้เลย กับ TKBNEKO ที่ ตอบโจทย์การเดิมพันยุคใหม่
คลังเกมคุณภาพ
เรารวบรวมเกมยอดนิยมหลากหลายประเภท รองรับทุกความชอบของผู้เล่น
สล็อต: หลากหลายธีม แจ็คพอตรอคุณอยู่
เกมสด: ดีลเลอร์ถ่ายทอดสดตลอดเวลา
กีฬา: รองรับลีกดังระดับโลก
ยิงปลา: เกมยิงปลาสุดมันส์ ได้เงินจริง
ติดตามโปรโมชั่นและสิทธิพิเศษ
อย่าลืมแวะมาเยี่ยมชมที่หน้า โบนัส เพื่อรับ สิทธิพิเศษมากมาย ที่เรามอบให้สมาชิกทุกท่าน นอกจากนี้ยังมีระบบ VIP สำหรับลูกค้าคนสำคัญ และช่องทาง พันธมิตร สำหรับผู้ที่สนใจสร้างรายได้ร่วมกับเรา
ช่องทางติดต่อ
หากมี คำถาม หรือ คำแนะนำ สามารถติดต่อทีมงานของเราได้ตลอด 24 ชั่วโมงที่หน้า ศูนย์ช่วยเหลือ และ ส่งความคิดเห็น ทีมงาน TKBNEKO ยินดีให้บริการทุกท่านด้วยใจ
ทดลองเล่นสล็อต pg เว็บ ตรง”
สล็อต PG สล็อตยอดฮิต ใช้งานง่าย ฝากถอนรวดเร็ว
คำค้นหา pg slot กำลังได้รับความนิยมอย่างต่อเนื่อง ในกลุ่มผู้เล่นเกมสล็อตออนไลน์ เพราะเป็น ผู้ให้บริการเกมสล็อตที่มาแรง ด้าน กราฟิก ความ ลื่นไหล และ โอกาสรับกำไรที่ดี เกมของ PG พัฒนาโดยผู้ให้บริการชั้นนำ ที่รองรับการเล่นทั้งบน มือถือ และ เดสก์ท็อป
ข้อดี ของ PG Slot
PG Slot เป็นเกมสล็อตออนไลน์ที่ออกแบบมาให้ เปิดเกมได้ทันที เล่นผ่าน ระบบเว็บ และรองรับ ทุกอุปกรณ์ ไม่ต้องดาวน์โหลดแอป ผู้เล่นสามารถเข้าเล่นผ่าน Browser ได้ทันที ภาพและเสียงถูกพัฒนาในรูปแบบ เอฟเฟกต์ 3 มิติ ให้ความคมชัด พร้อมเอฟเฟกต์ สมจริง
คุณสมบัติหลักของเกม pg slot ได้แก่
มีรอบโบนัสให้ลุ้นบ่อย
ระบบตัวคูณ
เดโม่ฟรี
รองรับภาษาไทยเต็มรูปแบบ
ระบบฝากถอนสะดวก ทันใจ
แพลตฟอร์ม PG Slot ส่วนใหญ่รองรับ การฝาก-ถอน อัตโนมัติ 24 ชั่วโมง ขั้นต่ำเริ่มต้นเพียง 1 บาท ขึ้นอยู่กับ ระบบของผู้ให้บริการ การทำรายการใช้เวลา เพียงไม่กี่วินาที ผ่าน QR Code หรือระบบ ธนาคารบนมือถือ ทำให้ธุรกรรมเป็นไปอย่าง ไม่สะดุด
หมวดเกมฮิต ใน PG Slot
เกม สล็อต PG มีธีมหลากหลาย เช่น
ธีม เทพเจ้า
ธีม ลุยด่าน
ธีม โชคลาภ
ธีม Animal
ผู้เล่นนิยมเกมที่มีรอบพิเศษบ่อย พร้อมระบบ Special Feature และ ระบบจ่ายคุ้มค่า เหมาะกับทั้ง ผู้เล่นเริ่มต้น และ ผู้เล่นมือโปร
มาตรฐานระบบ
PG Slot พัฒนาในระบบสากล มีการ ปกป้องข้อมูลผู้เล่น และใช้ระบบสุ่มผล Random Number Generator เพื่อให้ผลลัพธ์ ตรวจสอบได้ แพลตฟอร์มที่ให้บริการ PG Slot ควรมี ทีมซัพพอร์ต 24 ชม.
สรุป
pg slot เป็นตัวเลือกยอดนิยมสำหรับผู้ที่ต้องการเล่นสล็อตออนไลน์ ด้วยจุดเด่นด้าน กราฟิกคุณภาพ และการทำธุรกรรมที่ ทันใจ ผู้เล่นสามารถเริ่มต้นได้ ไม่ซับซ้อน ฝากถอนสะดวก และเลือกเกมได้ หลากหลายแนว เหมาะสำหรับ ทุกระดับประสบการณ์ ในโลกของเกมสล็อตออนไลน์
สล็อต
TKBNEKO เปิดประสบการณ์ใหม่แห่งการเดิมพันออนไลน์ ธุรกรรมรวดเร็ว ด้วยระบบสแกน QR Code
ในยุคดิจิทัลที่ โลกออนไลน์เติบโตต่อเนื่อง เรามุ่งเน้นมาตรฐานใหม่ของการเดิมพัน ด้วยระบบที่ ล้ำสมัย รวดเร็ว และ ตรวจสอบได้ เพื่อให้ผู้เล่น อุ่นใจ ทุกครั้งที่ใช้งาน
จุดเด่นระบบฝาก-ถอน
ฝากขั้นต่ำ: 1 บาท
ถอนขั้นต่ำ: 1 บาท
เวลาฝากเงิน: ใช้เวลาเพียง 3 วินาที
ยอดถอน: ไม่มีลิมิต
เติมเงินง่าย แค่สแกน
สแกน คิวอาร์ ระบบจะ โอนเงินเข้าทันที ขั้นต่ำ เริ่ม 100 บาท สูงสุด 500,000 บาท
หมวดหมู่เกม
สล็อต: ลุ้นแจ็คพอต
เกมสด: ดีลเลอร์สด
กีฬา: เดิมพันลีกดัง
ยิงปลา: ลุ้นกำไรทันที
โบนัสและโปรโมชัน
ติดตามหน้า โปรโมชั่น พร้อมระบบ สมาชิกพรีเมียม และโปรแกรม พันธมิตร
ติดต่อเรา
สอบถามข้อมูลได้ตลอด 24 ชั่วโมง ผ่านหน้า ศูนย์ช่วยเหลือ ทีมงาน ของเรา พร้อมดูแลตลอดเวลา
pg slot แพลตฟอร์มเกมสล็อตยอดนิยม เล่นง่าย ฝากถอนเร็ว
คำค้นหา PG Slot ถูกค้นหามากขึ้นเรื่อยๆ ในกลุ่มผู้เล่นเกมสล็อตออนไลน์ เพราะเป็น แบรนด์เกมที่โดดเด่น ด้าน งานภาพคุณภาพสูง ความ เสถียร และ โอกาสรับกำไรที่ดี เกมของ PG พัฒนาโดยผู้ให้บริการชั้นนำ ที่รองรับการเล่นทั้งบน มือถือ และ เดสก์ท็อป
จุดเด่น ของ PG Slot
สล็อต PG เป็นเกมสล็อตออนไลน์ที่ออกแบบมาให้ เข้าเกมไว เล่นผ่าน ระบบอัตโนมัติ และรองรับ ทั้ง iOS และ Android ไม่ต้องติดตั้งเพิ่มเติม ผู้เล่นสามารถเข้าเล่นผ่าน เว็บเบราว์เซอร์ ได้ทันที ภาพและเสียงถูกพัฒนาในรูปแบบ เอฟเฟกต์ 3 มิติ ให้ความคมชัด พร้อมเอฟเฟกต์ สมจริง
คุณสมบัติหลักของเกม PG Slot ได้แก่
โบนัสและฟรีสปินหลายแบบ
Multiplier
โหมดทดลองเล่นฟรี
รองรับภาษาไทยเต็มรูปแบบ
ระบบการเงินรวดเร็ว ทำรายการไว
แพลตฟอร์ม PG Slot โดยทั่วไปให้บริการ การฝาก-ถอน อัตโนมัติ 24 ชั่วโมง ขั้นต่ำเริ่มต้นเพียง 10 บาท ขึ้นอยู่กับ เงื่อนไขของเว็บไซต์ การทำรายการใช้เวลา รวดเร็วมาก ผ่าน คิวอาร์โค้ด หรือระบบ ธนาคารบนมือถือ ทำให้ธุรกรรมเป็นไปอย่าง ไม่สะดุด
แนวเกมที่คนเล่นเยอะ ใน PG Slot
เกม สล็อต PG มีธีมหลากหลาย เช่น
ธีม เทพเจ้า
ธีม ลุยด่าน
ธีม โชคลาภ
ธีม สัตว์และธรรมชาติ
ผู้เล่นนิยมเกมที่มีรอบพิเศษบ่อย พร้อมระบบ ฟีเจอร์พิเศษ และ อัตราการจ่ายที่สูง เหมาะกับทั้ง คนเพิ่งเล่น และ ผู้เล่นที่มีประสบการณ์
ความปลอดภัย
สล็อต PG มีมาตรฐานรองรับ มีการ เข้ารหัสข้อมูล และใช้ระบบสุ่มผล RNG เพื่อให้ผลลัพธ์ ตรวจสอบได้ แพลตฟอร์มที่ให้บริการ สล็อต PG ควรมี ทีมซัพพอร์ต 24 ชม.
โดยภาพรวม
PG Slot เป็นตัวเลือกยอดนิยมสำหรับผู้ที่ต้องการเล่นสล็อตออนไลน์ ด้วยจุดเด่นด้าน กราฟิกคุณภาพ และการทำธุรกรรมที่ รวดเร็ว ผู้เล่นสามารถเริ่มต้นได้ ไม่ซับซ้อน ฝากถอนสะดวก และเลือกเกมได้ จำนวนมาก เหมาะสำหรับ ทั้งมือใหม่และมือโปร ในโลกของเกมสล็อตออนไลน์
https://medium.com/@ratypw/ทดลองเล่นสล็อต-pg-70cdb1132344
ทดลองเล่นสล็อต pg ฟรี pg slot แพลตฟอร์มเกมสล็อตยอดนิยม ใช้งานง่าย ฝากถอนรวดเร็ว
คำค้นหา pg slot มาแรงในช่วงนี้ ในกลุ่มผู้เล่นเกมสล็อตออนไลน์ เพราะเป็น แบรนด์เกมที่โดดเด่น ด้าน กราฟิก ความ นิ่งไม่สะดุด และ ระบบจ่ายที่ดึงดูด เกมของ PG ผลิตโดยค่ายมาตรฐาน ที่รองรับการเล่นทั้งบน โทรศัพท์มือถือ และ คอมพิวเตอร์
ความโดดเด่น ของ pg slot
PG Slot เป็นเกมสล็อตออนไลน์ที่ออกแบบมาให้ เปิดเกมได้ทันที เล่นผ่าน ระบบอัตโนมัติ และรองรับ ทุกแพลตฟอร์ม เข้าเล่นผ่านเว็บได้เลย ผู้เล่นสามารถเข้าเล่นผ่าน Browser ได้ทันที ภาพและเสียงถูกพัฒนาในรูปแบบ สามมิติ ให้ความคมชัด พร้อมเอฟเฟกต์ สมจริง
คุณสมบัติหลักของเกม PG Slot ได้แก่
ระบบโบนัสและฟรีสปินหลากหลายรูปแบบ
Multiplier
เล่นฟรีก่อนเติมเงิน
รองรับภาษาไทยเต็มรูปแบบ
ฝากถอนง่าย ทันใจ
แพลตฟอร์ม pg slot โดยทั่วไปให้บริการ การฝาก-ถอน ฝากถอนตลอดเวลา ขั้นต่ำเริ่มต้นเพียง 10 บาท ขึ้นอยู่กับ กติกาแต่ละแพลตฟอร์ม การทำรายการใช้เวลา เพียงไม่กี่วินาที ผ่าน คิวอาร์โค้ด หรือระบบ Mobile Banking ทำให้ธุรกรรมเป็นไปอย่าง ต่อเนื่อง
หมวดเกมฮิต ใน pg slot
เกม สล็อต PG มีธีมหลากหลาย เช่น
ธีม เทพเจ้าและแฟนตาซี
ธีม ผจญภัย
ธีม โชคลาภ
ธีม ธรรมชาติ
หลายคนชอบเกมที่โบนัสเข้าไว พร้อมระบบ ฟีเจอร์พิเศษ และ โอกาสทำกำไรสูง เหมาะกับทั้ง คนเพิ่งเล่น และ ผู้เล่นที่มีประสบการณ์
ความน่าเชื่อถือ
สล็อต PG พัฒนาในระบบสากล มีการ เข้ารหัสข้อมูล และใช้ระบบสุ่มผล ระบบสุ่มมาตรฐาน เพื่อให้ผลลัพธ์ ตรวจสอบได้ แพลตฟอร์มที่ให้บริการ สล็อต PG ควรมี ทีมซัพพอร์ต 24 ชม.
บทสรุปท้ายบท
สล็อต PG เป็นตัวเลือกยอดนิยมสำหรับผู้ที่ต้องการเล่นสล็อตออนไลน์ ด้วยจุดเด่นด้าน กราฟิกคุณภาพ และการทำธุรกรรมที่ ทันใจ ผู้เล่นสามารถเริ่มต้นได้ ทันที ฝากถอนสะดวก และเลือกเกมได้ หลากหลายแนว เหมาะสำหรับ ทุกระดับประสบการณ์ ในโลกของเกมสล็อตออนไลน์
สล็อต PG แพลตฟอร์มเกมสล็อตยอดนิยม ใช้งานง่าย ฝากถอนรวดเร็ว
คำค้นหา pg slot ถูกค้นหามากขึ้นเรื่อยๆ ในกลุ่มผู้เล่นเกมสล็อตออนไลน์ เพราะเป็น แบรนด์เกมที่โดดเด่น ด้าน กราฟิก ความ นิ่งไม่สะดุด และ อัตราการจ่ายรางวัลที่น่าสนใจ เกมของ PG ออกแบบโดยทีมงานมืออาชีพ ที่รองรับการเล่นทั้งบน สมาร์ทโฟน และ คอมพิวเตอร์
ข้อดี ของ pg slot
PG Slot เป็นเกมสล็อตออนไลน์ที่ออกแบบมาให้ โหลดเร็ว เล่นผ่าน ระบบอัตโนมัติ และรองรับ ทุกแพลตฟอร์ม เข้าเล่นผ่านเว็บได้เลย ผู้เล่นสามารถเข้าเล่นผ่าน หน้าเว็บ ได้ทันที ภาพและเสียงถูกพัฒนาในรูปแบบ เอฟเฟกต์ 3 มิติ ให้ความคมชัด พร้อมเอฟเฟกต์ สวยงาม
คุณสมบัติหลักของเกม pg slot ได้แก่
โบนัสและฟรีสปินหลายแบบ
ระบบตัวคูณ
โหมดทดลองเล่นฟรี
รองรับภาษาไทยเต็มรูปแบบ
ระบบฝากถอนสะดวก ทันใจ
แพลตฟอร์ม สล็อต PG ส่วนใหญ่รองรับ การฝาก-ถอน ออโต้ตลอด 24 ชม. ขั้นต่ำเริ่มต้นเพียง 10 บาท ขึ้นอยู่กับ ระบบของผู้ให้บริการ การทำรายการใช้เวลา รวดเร็วมาก ผ่าน QR Code หรือระบบ แอปธนาคาร ทำให้ธุรกรรมเป็นไปอย่าง ไม่สะดุด
แนวเกมที่คนเล่นเยอะ ใน PG Slot
เกม pg slot มีธีมหลากหลาย เช่น
ธีม เทพเจ้าและแฟนตาซี
ธีม ลุยด่าน
ธีม ความมั่งคั่ง
ธีม Animal
เกมยอดนิยมมักเป็นเกมที่แตกง่าย พร้อมระบบ โบนัสรอบพิเศษ และ อัตราการจ่ายที่สูง เหมาะกับทั้ง ผู้เล่นเริ่มต้น และ ผู้เล่นที่มีประสบการณ์
มาตรฐานระบบ
PG Slot พัฒนาในระบบสากล มีการ เข้ารหัสข้อมูล และใช้ระบบสุ่มผล Random Number Generator เพื่อให้ผลลัพธ์ ยุติธรรม แพลตฟอร์มที่ให้บริการ PG Slot ควรมี ความปลอดภัยสูง
โดยภาพรวม
pg slot เป็นตัวเลือกยอดนิยมสำหรับผู้ที่ต้องการเล่นสล็อตออนไลน์ ด้วยจุดเด่นด้าน โบนัสหลากหลาย และการทำธุรกรรมที่ ทันใจ ผู้เล่นสามารถเริ่มต้นได้ ทันที ฝากถอนสะดวก และเลือกเกมได้ ครบทุกหมวด เหมาะสำหรับ ทุกระดับประสบการณ์ ในโลกของเกมสล็อตออนไลน์
https://medium.com/@ratypw/ทดลองเล่นสล็อต-pg-70cdb1132344
pg slot สล็อตยอดฮิต เล่นง่าย ฝากถอนเร็ว
คำค้นหา PG Slot มาแรงในช่วงนี้ ในกลุ่มผู้เล่นเกมสล็อตออนไลน์ เพราะเป็น ผู้ให้บริการเกมสล็อตที่มาแรง ด้าน กราฟิก ความ เสถียร และ ระบบจ่ายที่ดึงดูด เกมของ PG ผลิตโดยค่ายมาตรฐาน ที่รองรับการเล่นทั้งบน สมาร์ทโฟน และ เดสก์ท็อป
จุดเด่น ของ สล็อต PG
สล็อต PG เป็นเกมสล็อตออนไลน์ที่ออกแบบมาให้ เข้าเกมไว เล่นผ่าน ระบบอัตโนมัติ และรองรับ ทั้ง iOS และ Android ไม่ต้องติดตั้งเพิ่มเติม ผู้เล่นสามารถเข้าเล่นผ่าน หน้าเว็บ ได้ทันที ภาพและเสียงถูกพัฒนาในรูปแบบ 3D ให้ความคมชัด พร้อมเอฟเฟกต์ จัดเต็ม
คุณสมบัติหลักของเกม สล็อต PG ได้แก่
ระบบโบนัสและฟรีสปินหลากหลายรูปแบบ
ระบบตัวคูณ
โหมดทดลองเล่นฟรี
มีเมนูภาษาไทย
ระบบฝากถอนสะดวก ทำรายการไว
แพลตฟอร์ม PG Slot โดยทั่วไปให้บริการ การฝาก-ถอน อัตโนมัติ 24 ชั่วโมง ขั้นต่ำเริ่มต้นเพียง 10 บาท ขึ้นอยู่กับ กติกาแต่ละแพลตฟอร์ม การทำรายการใช้เวลา ไม่กี่วินาที ผ่าน สแกน QR หรือระบบ Mobile Banking ทำให้ธุรกรรมเป็นไปอย่าง ไม่สะดุด
แนวเกมที่คนเล่นเยอะ ใน pg slot
เกม pg slot มีธีมหลากหลาย เช่น
ธีม เทพเจ้าและแฟนตาซี
ธีม Adventure
ธีม โชคลาภ
ธีม Animal
หลายคนชอบเกมที่โบนัสเข้าไว พร้อมระบบ ฟีเจอร์พิเศษ และ อัตราการจ่ายที่สูง เหมาะกับทั้ง ผู้เล่นเริ่มต้น และ ผู้เล่นมือโปร
ความปลอดภัย
pg slot ใช้ระบบที่ได้มาตรฐาน มีการ รักษาความปลอดภัย และใช้ระบบสุ่มผล Random Number Generator เพื่อให้ผลลัพธ์ ตรวจสอบได้ แพลตฟอร์มที่ให้บริการ pg slot ควรมี ความปลอดภัยสูง
บทสรุปท้ายบท
สล็อต PG เป็นตัวเลือกยอดนิยมสำหรับผู้ที่ต้องการเล่นสล็อตออนไลน์ ด้วยจุดเด่นด้าน ระบบลื่นไหล และการทำธุรกรรมที่ รวดเร็ว ผู้เล่นสามารถเริ่มต้นได้ ง่าย ฝากถอนสะดวก และเลือกเกมได้ หลากหลายแนว เหมาะสำหรับ ผู้เล่นทุกสไตล์ ในโลกของเกมสล็อตออนไลน์
ทดลองเล่นสล็อต pg ไม่ เด้ง
pg
แพลตฟอร์ม TKBNEKO พาคุณสู่โลกใหม่ของเกมเดิมพันออนไลน์ ฝาก-ถอนไว ด้วยระบบสแกน QR Code
ในยุคที่ โลกออนไลน์พัฒนาอย่างรวดเร็ว TKBNEKO พร้อมยกระดับมาตรฐานการเดิมพัน ด้วยระบบการให้บริการที่ ล้ำสมัย ฉับไว และ ตรวจสอบได้ พร้อมต้อนรับสมาชิกทุกท่านสู่ ประสบการณ์ความบันเทิงรูปแบบใหม่ ที่ เปิดโอกาสให้ทุกคนสร้างรายได้
ทำไมต้อง TKBNEKO?
เราคัดสรรเกมคุณภาพจากผู้พัฒนาชั้นนำ โดยเฉพาะเกมที่ ได้รับการตรวจสอบจากองค์กรสากล และ ได้รับการยอมรับมากที่สุดในอุตสาหกรรม เพื่อให้ผู้เล่นทุกคน สบายใจ ได้ว่า จะได้รับความเพลิดเพลินกับเกมที่ ไม่มีการเอาเปรียบ ข้อมูลไม่รั่วไหล และ ตอบโจทย์ผู้เล่นยุคใหม่
ระบบการเงินที่เหนือกว่า
เรามุ่งเน้นความสะดวกของผู้เล่น เพื่อให้คุณ เพลิดเพลินกับการเดิมพันอย่างต่อเนื่อง
ฝากขั้นต่ำ: เริ่มต้นเพียง 1 บาท
ถอนขั้นต่ำ: เพียง 1 บาท
เวลาฝากเงิน: เงินเข้าภายใน 3 วินาที
ยอดจำกัดการถอน: ไม่มียอดจำกัดต่อวัน
เติมเงินง่ายด้วย QR Code
เพียงคุณสแกน โค้ดคิวอาร์ ระบบของเราจะ ดำเนินการฝากเงินให้อัตโนมัติ ขั้นต่ำเพียง เริ่มต้น 100 บาท และสามารถฝากได้สูงถึง ไม่เกิน 500,000 บาทต่อครั้ง เข้าร่วมความสนุกได้เลย กับ TKBNEKO ที่ ใช้งานง่าย ทำกำไรได้รวดเร็ว
หมวดหมู่เกมที่ครบครัน
เรารวบรวมเกมยอดนิยมหลากหลายประเภท รองรับทุกความชอบของผู้เล่น
สล็อต: หลากหลายธีม แจ็คพอตรอคุณอยู่
เกมสด: ดีลเลอร์ถ่ายทอดสดตลอดเวลา
กีฬา: วางเดิมพันกีฬาหลากหลายรายการ
ยิงปลา: เกมยิงปลาสุดมันส์ ได้เงินจริง
อัปเดตโปรโมชันล่าสุด
อย่าลืมแวะมาเยี่ยมชมที่หน้า โบนัส เพื่อรับ โบนัสสุดคุ้ม ที่เรามอบให้สมาชิกทุกท่าน นอกจากนี้ยังมีระบบ VIP สำหรับลูกค้าคนสำคัญ และช่องทาง พาร์ทเนอร์ สำหรับผู้ที่สนใจสร้างรายได้ร่วมกับเรา
ช่องทางติดต่อ
หากมี ข้อสงสัย หรือ ความคิดเห็น สามารถติดต่อทีมงานของเราได้ตลอด 24 ชั่วโมงที่หน้า ติดต่อเรา และ แบบฟอร์มติดต่อ ทีมงาน ของเรา ยินดีให้บริการทุกท่านด้วยใจ
สล็อต
แพลตฟอร์ม TKBNEKO เปิดประสบการณ์ใหม่แห่งการเดิมพันออนไลน์ ธุรกรรมรวดเร็ว ด้วยระบบสแกน QR Code
ในยุคดิจิทัลที่ เทคโนโลยีพัฒนาอย่างรวดเร็ว TKBNEKO พร้อมยกระดับการให้บริการ ด้วยระบบที่ ทันสมัย เสถียร และ ตรวจสอบได้ เพื่อให้ผู้เล่น มั่นใจ ทุกครั้งที่ใช้งาน
จุดเด่นระบบฝาก-ถอน
ฝากขั้นต่ำ: เริ่มต้น 1 บาท
ถอนขั้นต่ำ: 1 บาท
เวลาฝากเงิน: ภายใน 3 วินาที
ยอดถอน: ไม่มีลิมิต
เติมเงินง่าย แค่สแกน
สแกน QR Code ระบบจะ โอนเงินเข้าทันที ขั้นต่ำ 100 บาท สูงสุด 500,000 บาท
หมวดหมู่เกม
สล็อต: ธีมหลากหลาย
เกมสด: ดีลเลอร์สด
กีฬา: เดิมพันลีกดัง
ยิงปลา: สนุกได้เงินจริง
โปรโมชั่นและสิทธิพิเศษ
ติดตามหน้า โบนัส พร้อมระบบ สมาชิกพรีเมียม และโปรแกรม แอฟฟิลิเอต
ติดต่อเรา
สอบถามข้อมูลได้ตลอด 24 ชั่วโมง ผ่านหน้า ศูนย์ช่วยเหลือ ทีมงาน TKBNEKO พร้อมดูแลตลอดเวลา
ทดลองเล่นสล็อต pg เว็บ ตรง”
สล็อต PG แพลตฟอร์มเกมสล็อตยอดนิยม ใช้งานง่าย ฝากถอนรวดเร็ว
คำค้นหา pg slot มาแรงในช่วงนี้ ในกลุ่มผู้เล่นเกมสล็อตออนไลน์ เพราะเป็น ค่ายเกมที่มีชื่อเสียง ด้าน งานภาพคุณภาพสูง ความ ลื่นไหล และ อัตราการจ่ายรางวัลที่น่าสนใจ เกมของ PG พัฒนาโดยผู้ให้บริการชั้นนำ ที่รองรับการเล่นทั้งบน มือถือ และ พีซี
จุดเด่น ของ PG Slot
PG Slot เป็นเกมสล็อตออนไลน์ที่ออกแบบมาให้ เปิดเกมได้ทันที เล่นผ่าน ระบบออนไลน์ และรองรับ ทุกแพลตฟอร์ม ไม่ต้องติดตั้งเพิ่มเติม ผู้เล่นสามารถเข้าเล่นผ่าน หน้าเว็บ ได้ทันที ภาพและเสียงถูกพัฒนาในรูปแบบ เอฟเฟกต์ 3 มิติ ให้ความคมชัด พร้อมเอฟเฟกต์ จัดเต็ม
คุณสมบัติหลักของเกม สล็อต PG ได้แก่
โบนัสและฟรีสปินหลายแบบ
ฟีเจอร์ตัวคูณรางวัล
เดโม่ฟรี
มีเมนูภาษาไทย
ฝากถอนง่าย ทำรายการไว
แพลตฟอร์ม สล็อต PG ส่วนใหญ่รองรับ การฝาก-ถอน อัตโนมัติ 24 ชั่วโมง ขั้นต่ำเริ่มต้นเพียง 1 บาท ขึ้นอยู่กับ กติกาแต่ละแพลตฟอร์ม การทำรายการใช้เวลา เพียงไม่กี่วินาที ผ่าน QR Code หรือระบบ ธนาคารบนมือถือ ทำให้ธุรกรรมเป็นไปอย่าง ลื่นไหล
หมวดเกมฮิต ใน pg slot
เกม PG Slot มีธีมหลากหลาย เช่น
ธีม เทพเจ้า
ธีม ผจญภัย
ธีม ความมั่งคั่ง
ธีม ธรรมชาติ
เกมยอดนิยมมักเป็นเกมที่แตกง่าย พร้อมระบบ ฟีเจอร์พิเศษ และ อัตราการจ่ายที่สูง เหมาะกับทั้ง มือใหม่ และ ผู้เล่นที่มีประสบการณ์
ความปลอดภัย
pg slot มีมาตรฐานรองรับ มีการ เข้ารหัสข้อมูล และใช้ระบบสุ่มผล RNG เพื่อให้ผลลัพธ์ ยุติธรรม แพลตฟอร์มที่ให้บริการ pg slot ควรมี ระบบดูแลข้อมูล
บทสรุปท้ายบท
สล็อต PG เป็นตัวเลือกยอดนิยมสำหรับผู้ที่ต้องการเล่นสล็อตออนไลน์ ด้วยจุดเด่นด้าน กราฟิกคุณภาพ และการทำธุรกรรมที่ ไว ผู้เล่นสามารถเริ่มต้นได้ ง่าย ฝากถอนสะดวก และเลือกเกมได้ ครบทุกหมวด เหมาะสำหรับ ทุกระดับประสบการณ์ ในโลกของเกมสล็อตออนไลน์
ทดลองเล่นสล็อต pg ซื้อฟรีสปิน
Автозайм
Деньги с обеспечением ПТС в городе Самара — это возможность взять деньги под авто без продажи автомобиля и без длительных банковских процедур. Основная особенность такого займа — транспорт остаётся у собственника, а в качестве залога оформляется лишь ПТС. Это даёт возможность использовать транспортом, на протяжении срок договора.
Получение средств возможна в день подачи заявки. Обращение проверяется примерно за 15 мин, затем выносится решение по сумме и условиям. Сумма займа может составлять до 5 000 000 ?, а ставка стартует от 2% в месяц. Период займа обычно составляет до 60 месяцев, поэтому заёмщик может подобрать подходящий график выплат.
Процесс оформления заявки доступна через интернет. Заёмщик оставляет форму, указывает информацию об авто и необходимую сумму займа. После анализа документов приходит начальное одобрение. В большинстве случаев деньги переводятся в день оформления, после подписания договор займа.
Для расчёта условий используется онлайн-калькулятор. К примеру, если взять 300 000 ? на период 12 мес. ежемесячный платёж составит около 33 057 ?. Общая переплата за весь срок будет примерно 96 684 ?. Итоговые параметры могут отличаться в зависимости от оценки автомобиля и установленного срока займа.
На сайтах автокредитования нередко показывается онлайн-лента заявок. Она показывает активность сервиса и образцы обработанных заявок из разных городов. Например, заявки на сумму 1 840 000 ? город Тула, 1 890 000 ? город Москва или 1 470 000 ? город Челябинск могут получать статус «Одобрено». Некоторые обращений могут находиться в стадии проверки — например, 290 000 ? город Сочи или 720 000 ? город Екатеринбург. Подобные разделы отображают текущую активность сервиса и число обработанных заявок сегодня и в текущем месяце.
Займ с залогом ПТС подходит тем, кому нужно оперативно получить значительную сумму без продажи автомобиля. Базовые условия таких займов — процент начиная от 2% в месяц, одобрение примерно 15 минут, сумма до 5 000 000 ? и вариант оформить заявку через интернет. После подачи заявки клиент может дождаться решения, связаться через мессенджер или обратиться к менеджеру для уточнения деталей оформления.
ทดลองเล่นสล็อต pg ไม่ เด้ง
สล็อต PG สล็อตยอดฮิต ใช้งานง่าย ฝากถอนรวดเร็ว
คำค้นหา PG Slot ถูกค้นหามากขึ้นเรื่อยๆ ในกลุ่มผู้เล่นเกมสล็อตออนไลน์ เพราะเป็น ค่ายเกมที่มีชื่อเสียง ด้าน ภาพและเอฟเฟกต์ ความ เสถียร และ โอกาสรับกำไรที่ดี เกมของ PG พัฒนาโดยผู้ให้บริการชั้นนำ ที่รองรับการเล่นทั้งบน สมาร์ทโฟน และ คอมพิวเตอร์
ความโดดเด่น ของ PG Slot
pg slot เป็นเกมสล็อตออนไลน์ที่ออกแบบมาให้ เข้าเกมไว เล่นผ่าน ระบบออนไลน์ และรองรับ ทุกแพลตฟอร์ม เข้าเล่นผ่านเว็บได้เลย ผู้เล่นสามารถเข้าเล่นผ่าน เว็บเบราว์เซอร์ ได้ทันที ภาพและเสียงถูกพัฒนาในรูปแบบ สามมิติ ให้ความคมชัด พร้อมเอฟเฟกต์ สมจริง
คุณสมบัติหลักของเกม PG Slot ได้แก่
มีรอบโบนัสให้ลุ้นบ่อย
Multiplier
โหมดทดลองเล่นฟรี
ใช้งานภาษาไทยง่าย
ระบบฝากถอนสะดวก ทำรายการไว
แพลตฟอร์ม pg slot โดยทั่วไปให้บริการ การฝาก-ถอน ออโต้ตลอด 24 ชม. ขั้นต่ำเริ่มต้นเพียง หลักหน่วย ขึ้นอยู่กับ ระบบของผู้ให้บริการ การทำรายการใช้เวลา ไม่กี่วินาที ผ่าน QR Code หรือระบบ แอปธนาคาร ทำให้ธุรกรรมเป็นไปอย่าง ลื่นไหล
หมวดเกมฮิต ใน pg slot
เกม สล็อต PG มีธีมหลากหลาย เช่น
ธีม เทพเจ้า
ธีม ลุยด่าน
ธีม โชคลาภ
ธีม ธรรมชาติ
หลายคนชอบเกมที่โบนัสเข้าไว พร้อมระบบ โบนัสรอบพิเศษ และ อัตราการจ่ายที่สูง เหมาะกับทั้ง มือใหม่ และ ผู้เล่นที่มีประสบการณ์
ความน่าเชื่อถือ
PG Slot ใช้ระบบที่ได้มาตรฐาน มีการ รักษาความปลอดภัย และใช้ระบบสุ่มผล ระบบสุ่มมาตรฐาน เพื่อให้ผลลัพธ์ ตรวจสอบได้ แพลตฟอร์มที่ให้บริการ pg slot ควรมี ทีมซัพพอร์ต 24 ชม.
โดยภาพรวม
pg slot เป็นตัวเลือกยอดนิยมสำหรับผู้ที่ต้องการเล่นสล็อตออนไลน์ ด้วยจุดเด่นด้าน ระบบลื่นไหล และการทำธุรกรรมที่ รวดเร็ว ผู้เล่นสามารถเริ่มต้นได้ ง่าย ฝากถอนสะดวก และเลือกเกมได้ ครบทุกหมวด เหมาะสำหรับ ทุกระดับประสบการณ์ ในโลกของเกมสล็อตออนไลน์
https://medium.com/@ratypw/ทดลองเล่นสล็อต-pg-70cdb1132344
Автозайм
Займ под залог ПТС в Самаре — это возможность получить средства под машину без необходимости продавать машины и без долгих банковских процедур. Основная особенность такого займа — автомобиль остаётся у владельца у владельца, а в залог передаётся только ПТС. Это даёт возможность использовать автомобилем, на протяжении договор займа.
Выдача денег возможна в день обращения. Обращение обрабатывается около 15 минут, затем принимается ответ по сумме займа и условиям оформления. Сумма займа может достигать до 5 000 000 ?, а процентная ставка стартует с уровня 2% в месяц. Срок кредитования как правило составляет до 60 мес., поэтому заёмщик выбирает удобный план платежей.
Система оформления заявки доступна онлайн. Клиент оставляет онлайн-форму, указывает информацию об авто и необходимую сумму. После проверки документов выносится начальное одобрение. В большинстве случаев средства переводятся в тот же день, когда оформляется договор займа.
Для расчёта параметров используется калькулятор займа. К примеру, при сумме 300 000 ? на срок 12 мес. ежемесячный платёж будет примерно 33 057 ?. Общая сумма переплаты за весь срок составит около 96 684 ?. Итоговые параметры могут изменяться в зависимости стоимости автомобиля и выбранного срока займа.
На страницах сервиса автокредитования часто отображается лента заявок. Она показывает активность системы и образцы одобренных заявок из разных городов. К примеру, запросы на суммы 1 840 000 ? из Тулы, 1 890 000 ? из Москвы или 1 470 000 ? из Челябинска могут получать метку «Одобрено». Некоторые обращений могут находиться на этапе проверки — например, 290 000 ? из Сочи или 720 000 ? город Екатеринбург. Подобные разделы показывают текущий поток сервиса и количество обработанных заявок за день и за месяц.
Займ под залог ПТС подходит людям, кому требуется оперативно получить значительную сумму без продажи автомобиля. Основные параметры подобного финансирования — процент от 2% в месяц, рассмотрение около 15 минут, размер займа до 5 млн ? и возможность подать заявку онлайн. После отправки формы клиент может дождаться решения, написать в мессенджер или обратиться к менеджеру для уточнения деталей оформления.
ทดลองเล่นสล็อต pg ฟรี pg slot เกมสล็อตออนไลน์ที่คนค้นหาเยอะ เข้าเล่นไว ฝากถอนออโต้
คำค้นหา PG Slot กำลังได้รับความนิยมอย่างต่อเนื่อง ในกลุ่มผู้เล่นเกมสล็อตออนไลน์ เพราะเป็น แบรนด์เกมที่โดดเด่น ด้าน งานภาพคุณภาพสูง ความ ลื่นไหล และ โอกาสรับกำไรที่ดี เกมของ PG ผลิตโดยค่ายมาตรฐาน ที่รองรับการเล่นทั้งบน สมาร์ทโฟน และ เดสก์ท็อป
จุดเด่น ของ pg slot
สล็อต PG เป็นเกมสล็อตออนไลน์ที่ออกแบบมาให้ โหลดเร็ว เล่นผ่าน ระบบเว็บ และรองรับ ทุกแพลตฟอร์ม ไม่ต้องดาวน์โหลดแอป ผู้เล่นสามารถเข้าเล่นผ่าน หน้าเว็บ ได้ทันที ภาพและเสียงถูกพัฒนาในรูปแบบ 3D ให้ความคมชัด พร้อมเอฟเฟกต์ สวยงาม
คุณสมบัติหลักของเกม pg slot ได้แก่
ระบบโบนัสและฟรีสปินหลากหลายรูปแบบ
Multiplier
โหมดทดลองเล่นฟรี
มีเมนูภาษาไทย
ระบบฝากถอนสะดวก ไม่ต้องรอนาน
แพลตฟอร์ม pg slot โดยทั่วไปให้บริการ การฝาก-ถอน อัตโนมัติ 24 ชั่วโมง ขั้นต่ำเริ่มต้นเพียง 10 บาท ขึ้นอยู่กับ เงื่อนไขของเว็บไซต์ การทำรายการใช้เวลา เพียงไม่กี่วินาที ผ่าน สแกน QR หรือระบบ แอปธนาคาร ทำให้ธุรกรรมเป็นไปอย่าง ไม่สะดุด
แนวเกมที่คนเล่นเยอะ ใน PG Slot
เกม PG Slot มีธีมหลากหลาย เช่น
ธีม เทพเจ้าและแฟนตาซี
ธีม ลุยด่าน
ธีม เอเชียและโชคลาภ
ธีม Animal
ผู้เล่นนิยมเกมที่มีรอบพิเศษบ่อย พร้อมระบบ โบนัสรอบพิเศษ และ ระบบจ่ายคุ้มค่า เหมาะกับทั้ง คนเพิ่งเล่น และ ผู้เล่นมือโปร
มาตรฐานระบบ
สล็อต PG ใช้ระบบที่ได้มาตรฐาน มีการ ปกป้องข้อมูลผู้เล่น และใช้ระบบสุ่มผล RNG เพื่อให้ผลลัพธ์ ยุติธรรม แพลตฟอร์มที่ให้บริการ สล็อต PG ควรมี ทีมซัพพอร์ต 24 ชม.
โดยภาพรวม
PG Slot เป็นตัวเลือกยอดนิยมสำหรับผู้ที่ต้องการเล่นสล็อตออนไลน์ ด้วยจุดเด่นด้าน ระบบลื่นไหล และการทำธุรกรรมที่ ไว ผู้เล่นสามารถเริ่มต้นได้ ง่าย ฝากถอนสะดวก และเลือกเกมได้ จำนวนมาก เหมาะสำหรับ ทั้งมือใหม่และมือโปร ในโลกของเกมสล็อตออนไลน์
rufus Rufus is a lightweight, no-cost, open source utility built to make bootable USB drives. It helps users prepare a USB flash drive that can install an operating system, launch diagnostic tools, or boot into a recovery environment. The program requires no installation and can be opened right after download.
The primary purpose of Rufus is to create bootable USB media from ISO images fast and reliably. This lets people install or run operating systems directly from a USB flash drive without the need for DVDs. The tool supports a large number of operating systems and service utilities, which makes it practical for both regular users and system administrators.
Rufus works on computers with Microsoft Windows, starting from Windows 7. Both 32-bit and 64-bit versions are supported, and there is also a version available for ARM64 architecture.
The software lets users create bootable USB drives from many different ISO images. It can be used to prepare a USB drive for installing Windows 11, Windows 10, Windows 8.1, or Windows 7, as well as various Linux distributions. Rufus also works with DOS systems and other recovery or maintenance tools commonly used for troubleshooting computers.
One of the built-in features of Rufus is the ability to download official Windows ISO images directly from Microsoft servers. This allows users to obtain original installation images for Windows 8.1, Windows 10, and Windows 11 without searching for them on third-party websites.
In addition to creating bootable drives, Rufus can format USB devices. It supports several file systems including FAT32, NTFS, exFAT, UDF, and ReFS. This flexibility allows the USB drive to be prepared for different use cases and compatibility requirements.
Rufus supports both legacy BIOS systems and modern UEFI environments. Because of this, bootable drives created with Rufus can work on older computers as well as newer systems that use UEFI and Secure Boot.
Another feature included in Rufus is Windows To Go support. This option allows users to run a full Windows environment directly from a USB drive. It can be useful for testing systems, performing maintenance, or working on multiple computers without installing Windows on the internal drive.
Rufus also provides the option to bypass certain Windows 11 installation requirements. When creating an installation USB, the program can disable checks for TPM 2.0, Secure Boot, and minimum RAM requirements. This makes it possible to install Windows 11 on computers that would otherwise not meet the official hardware requirements.
One of the reasons Rufus has become popular is its speed and simplicity. The program is extremely small, about 1.9 MB in size, and runs as a portable application without installation. It is distributed under the GPL v3 open-source license, supports more than 70 languages, and contains no advertisements, bundled software, or tracking components.
Rufus works with a large number of ISO images. These include multiple versions of Windows, Windows Server editions, FreeDOS, and various system tools such as GParted, Hiren’s Boot CD, Parted Magic, and Clonezilla. Because of this wide compatibility, the program can be used not only for installing operating systems but also for disk management, data recovery, and system maintenance tasks.
To use Rufus, a computer running Windows 7 or later and a USB flash drive are required. The program does not need to be installed. Users simply download the executable file, run it, select the ISO image they want to use, and create a bootable USB drive. Due to its simplicity, speed, and reliability, Rufus remains one of the most widely used tools for creating bootable USB drives.
ทดลองเล่นสล็อต pg เว็บ ตรง”
pg slot เกมสล็อตออนไลน์ที่คนค้นหาเยอะ เล่นง่าย ฝากถอนเร็ว
คำค้นหา pg slot กำลังได้รับความนิยมอย่างต่อเนื่อง ในกลุ่มผู้เล่นเกมสล็อตออนไลน์ เพราะเป็น ค่ายเกมที่มีชื่อเสียง ด้าน ภาพและเอฟเฟกต์ ความ ลื่นไหล และ โอกาสรับกำไรที่ดี เกมของ PG พัฒนาโดยผู้ให้บริการชั้นนำ ที่รองรับการเล่นทั้งบน มือถือ และ พีซี
จุดเด่น ของ สล็อต PG
pg slot เป็นเกมสล็อตออนไลน์ที่ออกแบบมาให้ เข้าเกมไว เล่นผ่าน ระบบเว็บ และรองรับ ทั้ง iOS และ Android ไม่ต้องติดตั้งเพิ่มเติม ผู้เล่นสามารถเข้าเล่นผ่าน หน้าเว็บ ได้ทันที ภาพและเสียงถูกพัฒนาในรูปแบบ เอฟเฟกต์ 3 มิติ ให้ความคมชัด พร้อมเอฟเฟกต์ จัดเต็ม
คุณสมบัติหลักของเกม pg slot ได้แก่
โบนัสและฟรีสปินหลายแบบ
ระบบตัวคูณ
โหมดทดลองเล่นฟรี
ใช้งานภาษาไทยง่าย
ระบบฝากถอนสะดวก ทันใจ
แพลตฟอร์ม สล็อต PG ส่วนใหญ่รองรับ การฝาก-ถอน ออโต้ตลอด 24 ชม. ขั้นต่ำเริ่มต้นเพียง 1 บาท ขึ้นอยู่กับ ระบบของผู้ให้บริการ การทำรายการใช้เวลา เพียงไม่กี่วินาที ผ่าน สแกน QR หรือระบบ แอปธนาคาร ทำให้ธุรกรรมเป็นไปอย่าง ลื่นไหล
หมวดเกมฮิต ใน pg slot
เกม pg slot มีธีมหลากหลาย เช่น
ธีม เทพเจ้าและแฟนตาซี
ธีม Adventure
ธีม เอเชียและโชคลาภ
ธีม ธรรมชาติ
ผู้เล่นนิยมเกมที่มีรอบพิเศษบ่อย พร้อมระบบ Special Feature และ โอกาสทำกำไรสูง เหมาะกับทั้ง ผู้เล่นเริ่มต้น และ ผู้เล่นมือโปร
ความปลอดภัย
PG Slot พัฒนาในระบบสากล มีการ รักษาความปลอดภัย และใช้ระบบสุ่มผล ระบบสุ่มมาตรฐาน เพื่อให้ผลลัพธ์ โปร่งใส แพลตฟอร์มที่ให้บริการ สล็อต PG ควรมี ระบบดูแลข้อมูล
สรุป
pg slot เป็นตัวเลือกยอดนิยมสำหรับผู้ที่ต้องการเล่นสล็อตออนไลน์ ด้วยจุดเด่นด้าน ระบบลื่นไหล และการทำธุรกรรมที่ ทันใจ ผู้เล่นสามารถเริ่มต้นได้ ง่าย ฝากถอนสะดวก และเลือกเกมได้ จำนวนมาก เหมาะสำหรับ ผู้เล่นทุกสไตล์ ในโลกของเกมสล็อตออนไลน์
ทดลองเล่นสล็อต pg ไม่ เด้ง
ทดลองเล่นสล็อต pg ไม่ เด้ง
bidik88
мелбет приложение для ios
Установить Melbet: Android, iPhone и ПК
Мобильная версия Melbet включает ставки и казино в едином приложении. Доступны live-ставки, казино-игры, онлайн-трансляции, аналитика и быстрые финансовые операции. Установка занимает 1–2 минуты.
Android (APK)
Скачайте APK с официального источника, запустите установщик и подтвердите установку. Если требуется включите разрешение на установку из неизвестных источников, затем войдите в аккаунт.
iOS (iPhone)
Перейдите в App Store, найдите «Melbet», выберите «Получить», после установки выполните вход.
ПК
Откройте официальный сайт, войдите в личный кабинет и создайте ярлык на рабочий стол. Веб-версия работает как полноценное приложение.
Функционал
Live-ставки с обновлением коэффициентов, казино и слоты, прямые трансляции, аналитические данные, уведомления о матчах, быстрая регистрация и круглосуточная служба поддержки.
Бонусы
После загрузки доступны приветственный бонус, акционные коды и бесплатные ставки. Правила начисления определяются регионом.
Безопасность
Загружайте только с официальных источников, контролируйте адрес сайта, не сообщайте данные доступа третьим лицам и включите 2FA.
Установка занимает несколько минут, после чего доступен весь функционал Melbet.
+1 to this, same experience here with heap o wins, really solid stuff.
http://silichem.co.kr/bbs/board.php?bo_table=free&wr_id=851271
казино леонбет
джой казино официальный сайт
I was skeptical about this whole thing at first honestly, thought it was gonna be another one of those sketchy sites but nope I was actually suprised at how legit it all felt, the whole experience was way better than what I expected 777bet and I’ve been using it pretty regularly now.
Ive been using ipl live which is good but anyone got other recommendations?. ipl2026cricket.com is good tho not gonna lie.
slot online
dude check this out theres this site rummy games without all the weird stuff and its actually fun like you just play cards against ppl and its so chill no pressure or anything just vibes honestly try it out