
NEW DELHI (CoinChapter.com) — The cryptocurrency market registered 3.86% gains over the past 24 hours as several cryptos registered jumped over the weekend to rally upwards.
Bitcoin (BTC) prices rallied to move above $21,000 on Tuesday, jumping nearly 24% from Jun 18’s low of $17,592. Ethereum (ETH) and the other altcoins’ prices followed suit, with ETH prices moving above the psychologically vital $1,000 level.
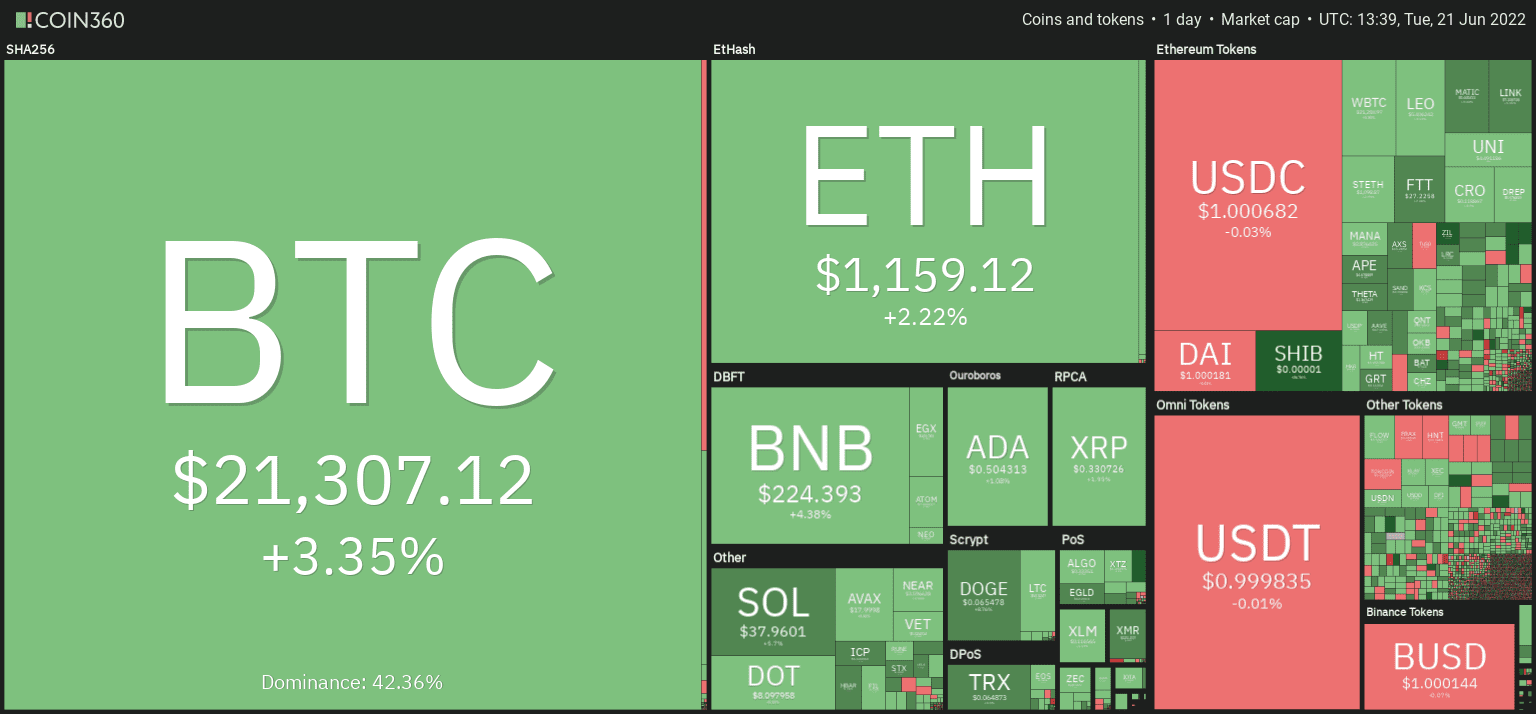
However, stablecoins remain in the red, following the uncertainty among investors due to the bitter taste left by the demise of Terra’s UST stablecoin.
Investors remain worried about the Fed’s hawkish stance on inflation, with the traditional financial markets hurting as well. Moreover, increased benchmark rates might result in lesser liquidity for riskier assets like cryptos.
ZIL/USD
Blockchain platform Zilliqa’s native token ZIL’s prices registered a massive jump of nearly 35% between intraday low ($0.034) and high ($0.045) levels. Although ZIL prices moved above their 20-day exponential moving average (20-day EMA, red wave), the MA trendline rebuffed the uptrend.
The momentum oscillator MACD continues to forecast a strengthening upward momentum for the ZIL token. Moreover, ZIL’s MACD trendlines charted a bullish crossover on Jun 21. Traders usually consider the pattern a buy signal.
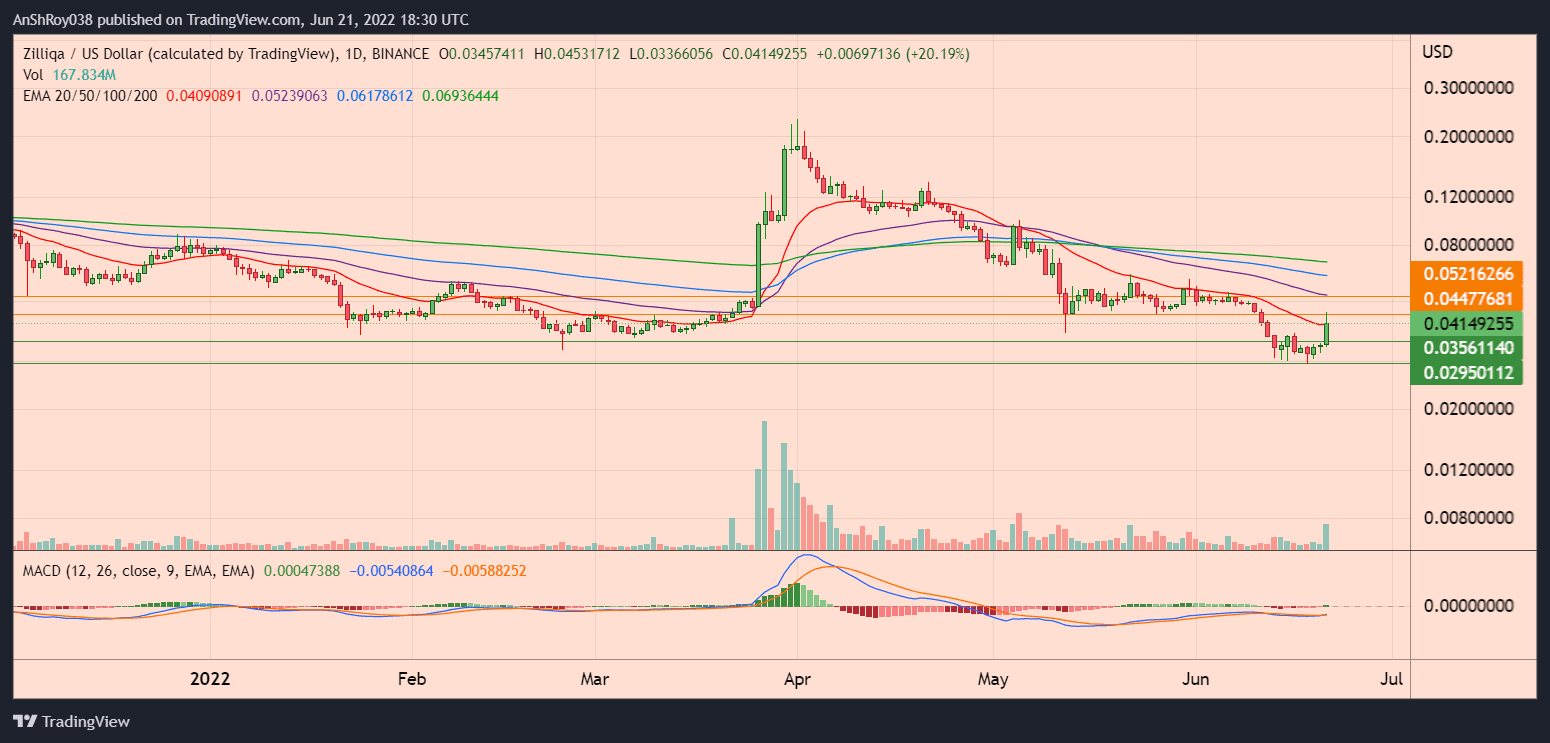
If ZIL prices continue their uptrend, a move above 20-day EMA might help the token breach immediate resistance near $0.045. ZIL’s immediate resistance previously supported the token’s price action between May 12 and Jun 11.
Also Read: Solana price jump more than 41% in a week after latest upgrade.Breaching above immediate resistance might give Zilliqa an impetus to challenge resistance near $0.052, near ZIL’s 50-day EMA (purple wave). Conversely, if bears move to book profits, the crypto’s prices might drop to immediate support near $0.036.
Moreover, a marketwide sell-off might see Zilliqa prices test support near $0.03, which previously supported the Zilliqa token between Jun 13 and Jun 20.
At writing, ZIL was trading at $0.0421, up 21.9% on the day.
1INCH/USD
Decentralized exchange 1inch’s namesake token 1INCH prices closed Jun 20 with 18.2% gains, with bulls trying to keep the rally going. However, it seems bears have moved to book profits. Long wicks on both ends of the day’s daily candle highlight the tussle between the bears and the bulls.
The uptrend pushed 1INCH prices above its 20-day EMA (red wave), but the trendline rejected 1INCH’s price rally. As such, the cryptocurrency’s prices might fall to support near $0.63, which acted as the resistance between Jun 13 and Jun 19.
In addition, a marketwide sell-off might force 1INCH prices to $0.55 before the token recovers.
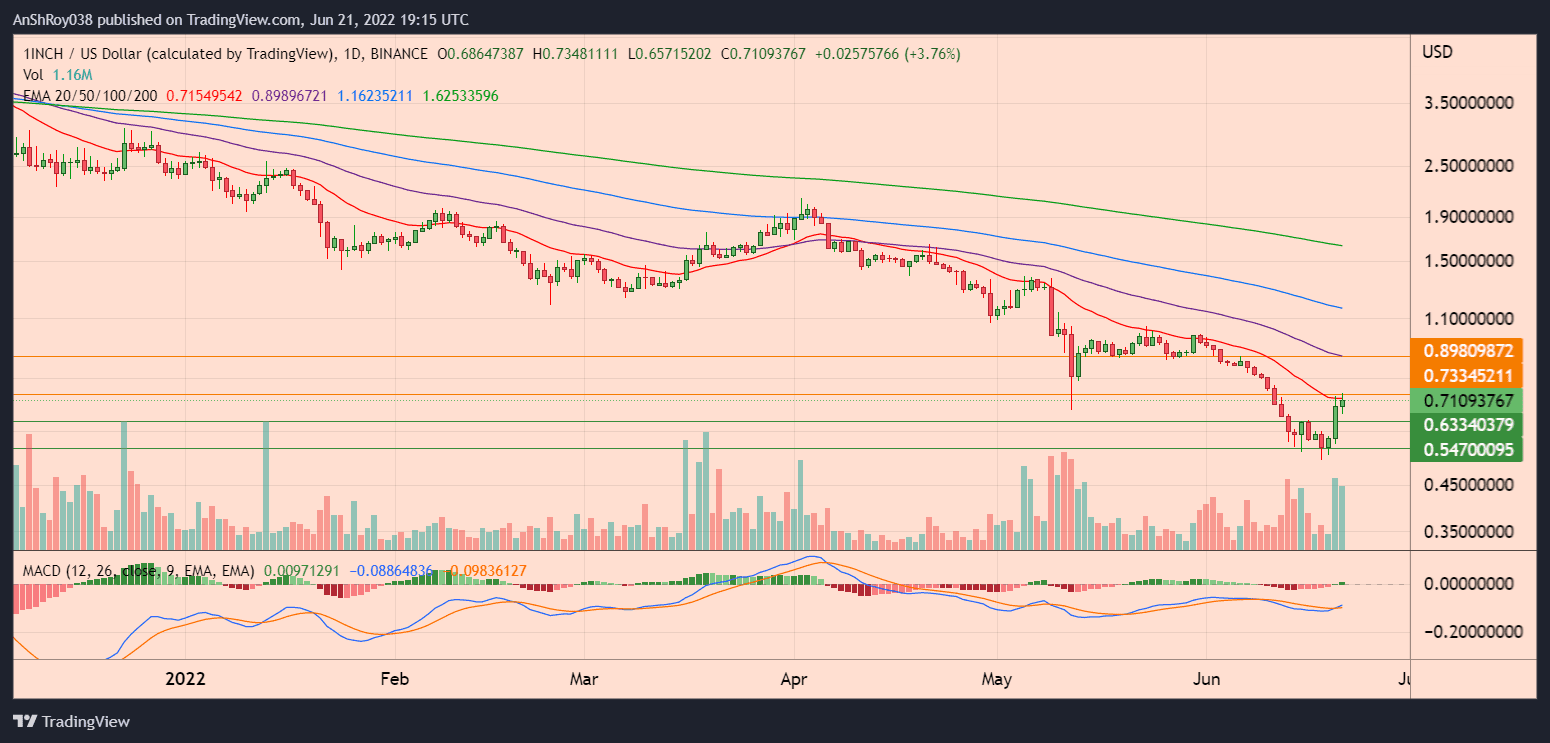
Meanwhile, the momentum oscillator MACD continues to forecast a strengthening upward momentum for the 1inch token. Moreover, 1INCH’s MACD trendlines charted a bullish crossover on Jun 20.
In detail, a bullish crossover occurs when the MACD line (difference between 12-day and 26-day EMA) moves above the MACD signal line (9-day EMA of MACD). Traders usually consider the pattern a buy signal.
If traders continue their buying spree, 1INCH prices might move above its 20-day EMA and challenge resistance near $0.73. A move above their immediate resistance might help 1INCH prices rise to $0.9, a jump of 23% from current prices before corrections pare gains.
Also Read: Elon Musk sued for $258M while Dogecoin (DOGE) sank 12% in a day.At writing, 1INCH was trading at $0.69, up 0.74% on the day.
ADA/USD
Cardano’s native token ADA’s 20-day EMA (red wave) resistance near $0.52 rebuffed the altcoin’s rally. Moreover, bears moved to book profits, resulting in ADA prices dropping 6.4% from the day’s high of $0.51 to reach $0.48.
If ADA prices continue to fall, Cardano might fall to support near $0.43, which previously supported ADA price action between Jun 12 and Jun 19. A marketwide sell-off could force the crypto’s prices to fall to support from multi-month descending trendline near $0.37.
ADA has rebounded from the descending trendline eight times since Sept 2021.
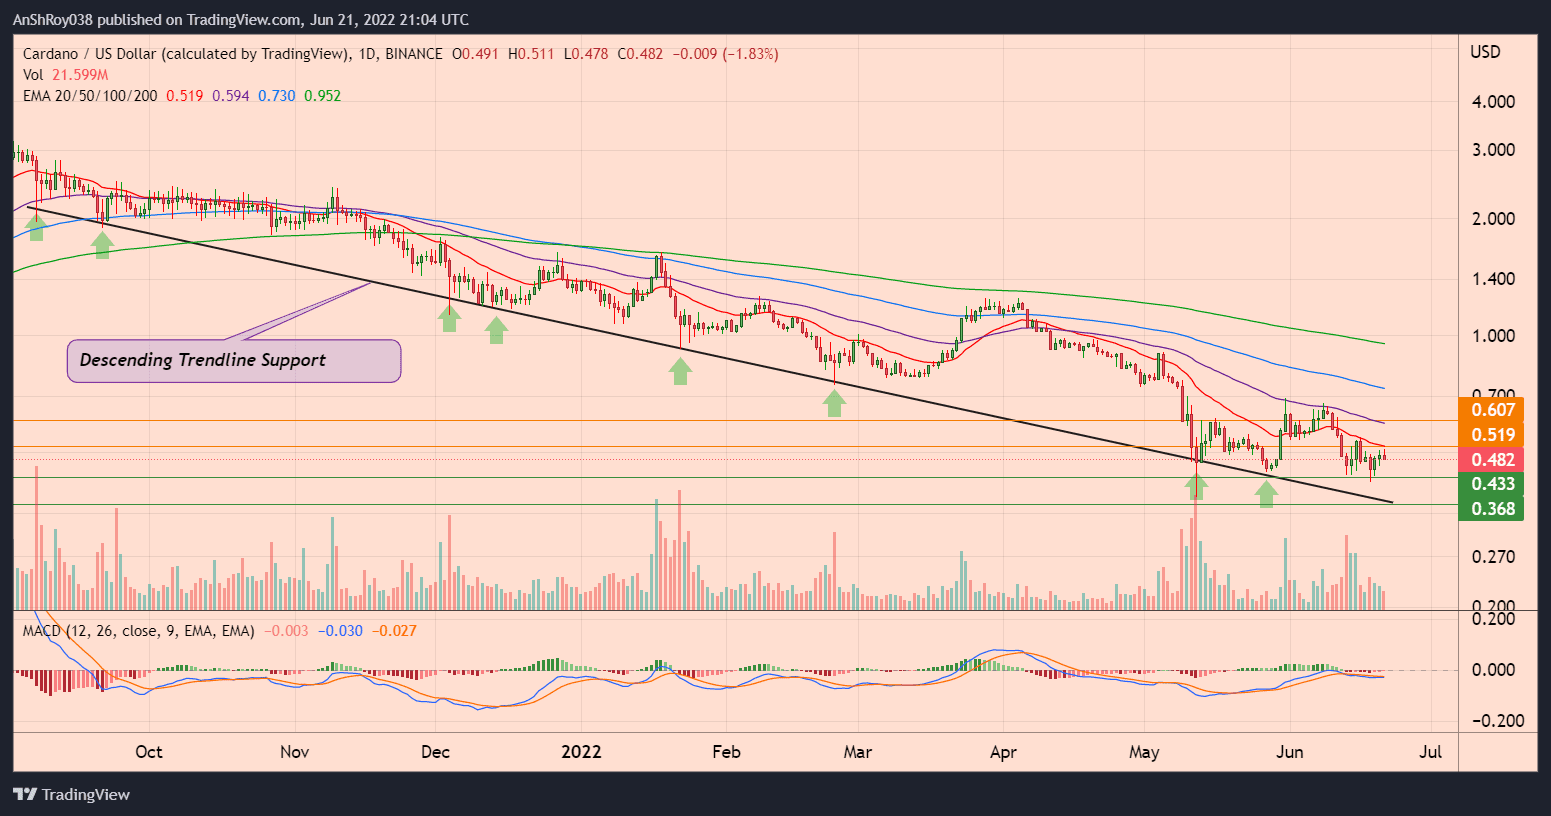
Meanwhile, the momentum oscillator MACD forecasted a strengthening upwards momentum for ADA prices.
Negative bars on the MACD histogram are contracting, which means the MACD line (difference of 12-day and 26-day EMA) is moving towards the MACD signal line (9-day EMA of MACD). Once the MACD line moves above its signal line, it will form a bullish crossover, a buy signal for traders.
If bulls start a buying spree, ADA might try to reclaim 20-day EMA resistance at $0.52. Moreover, sustained buying pressure might provide Cardano the impetus to challenge resistance from its 50-day EMA (purple wave) near $0.6.
At the time of writing, ADA was changing hands at $0.48, down 1.83% on the day.
HOT/USDT
DeFi platform Holo’s native token HOT jumped 36.7% between Jun 18’s low of $0.0018 and Jun 21’s intraday high of $0.0025. The uptrend helped the Holochain token move above the 20-day exponential moving average (20-day EMA, red wave).
Also Read: Is Bitcoin Really Dead?However, a sell-off by the bears pared some of ADA’s gains. If the sell-off continues, ADA might fall to support near $0.0019. A marketwide sell-off could see ADA prices fall more than 30% to test support near $0.0016 before recovering.
Meanwhile, the momentum oscillator MACD forecasted a strengthening upwards momentum for ADA prices.
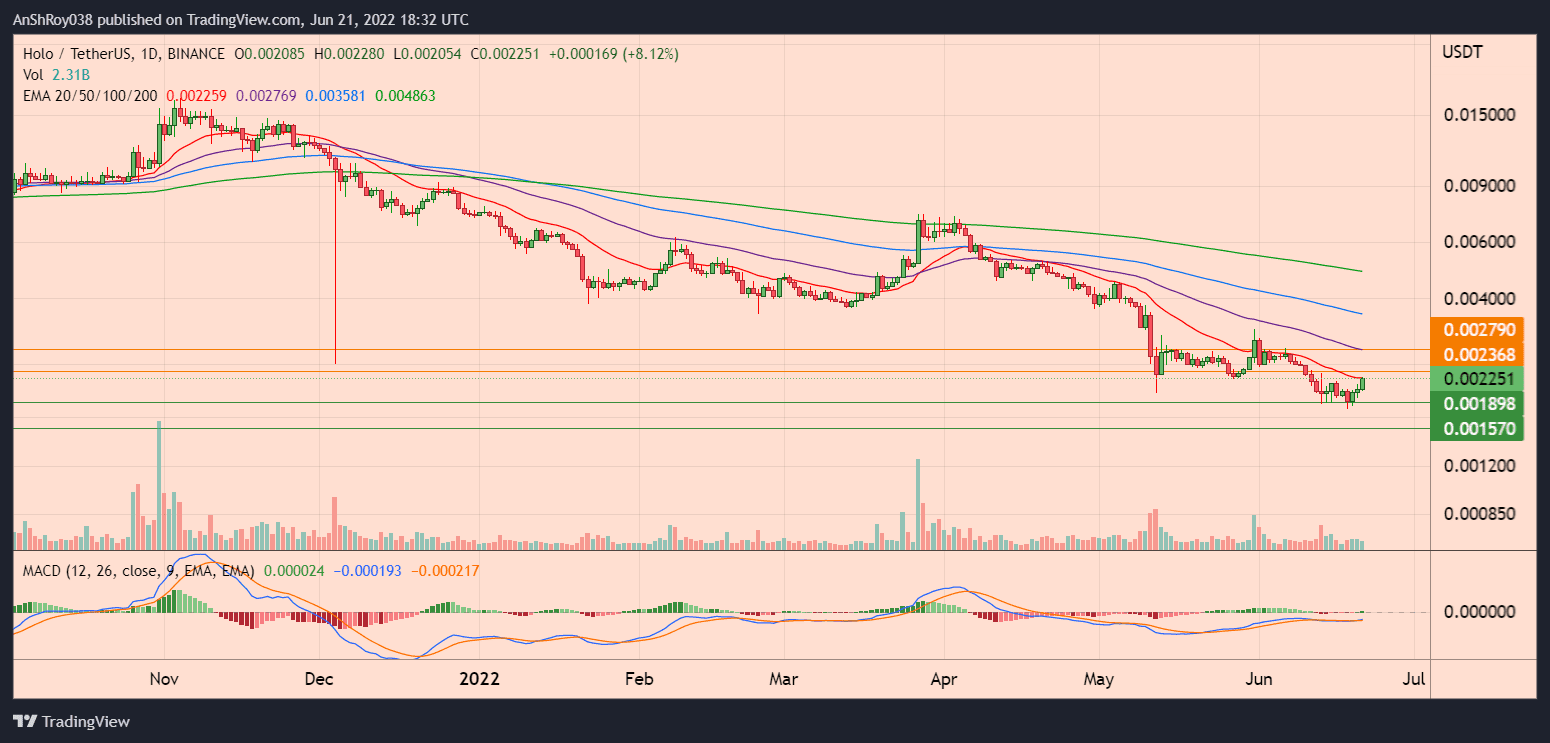
Moreover, HOT’s MACD trendlines charted a bullish crossover on Jun 20. In detail, a bullish crossover occurs when the MACD line (difference between 12-day and 26-day EMA) moves above the MACD signal line (9-day EMA of MACD). Traders usually consider the pattern a buy signal.
If traders continue their buying spree, the Holo token might flip immediate resistance to $0.0024, which previously supported the crypto’s price action between May 12 and Jun 10.
Breaching above immediate resistance might help the cryptocurrency’s prices jump 24% to challenge resistance from its 50-day EMA (purple wave) near $0.0028.
At writing, HOT was trading at $0.0023, up 9% on the day.
MATIC/USD
Ethereum scaling solution Polygon’s native token MATIC’s prices jumped nearly 39% to reach an intraday high of $0.45 on Jun 21 from Jun 19’s low of $0.33. However, the long upper wick on Tuesday’s candle suggests bears are selling to profit from relief rallies.
If the sell-off continues, MATIC prices might fall to immediate support near $0.39. Moreover, a marketwide sell-off could see the Polygon token fall more than 21% to support near $0.33 before recovering.
Also Read: Bitcoin bottom finally in, says analyst who predicted BTC crash in 2021.Meanwhile, the momentum oscillator MACD forecasted a strengthening upwards momentum for MATIC prices.

Negative bars on the MACD histogram are contracting, which means the MACD line (difference of 12-day and 26-day EMA) is moving towards the MACD signal line (9-day EMA of MACD). Once the MACD line moves above its signal line, it will form a bullish crossover, a buy signal for traders.
If traders start a buying spree, the altcoin’s prices might flip immediate resistance from its 50-day exponential moving average (50-day EMA, red wave) near $0.49. Once MATIC breaches immediate resistance, the crypto’s prices would likely target resistance from its 50-day EMA (purple wave) near $0.67.
At the time of writing, MATIC was trading at $0.43, up 6.75% on the day.
VET/USD
Smart contracts platform VeChain’s native token VET’s prices have been rallying upwards, jumping more than 27% between Jun 18’s low of $0.0199 and Jun 21’s intraday high of $0.025.
Moreover, VET’smomentum oscillator MACD continues to forecast strengthening upwards momentum for the VeChain token prices.
Negative bars on the MACD histogram are contracting, which means the MACD line (difference of 12-day and 26-day EMA) is moving towards the MACD signal line (9-day EMA of MACD). The MACD line seems likely to move above its signal line, soon forming a bullish crossover.
Traders often consider the pattern a buy signal, providing bullish cues for the cryptocurrency market.
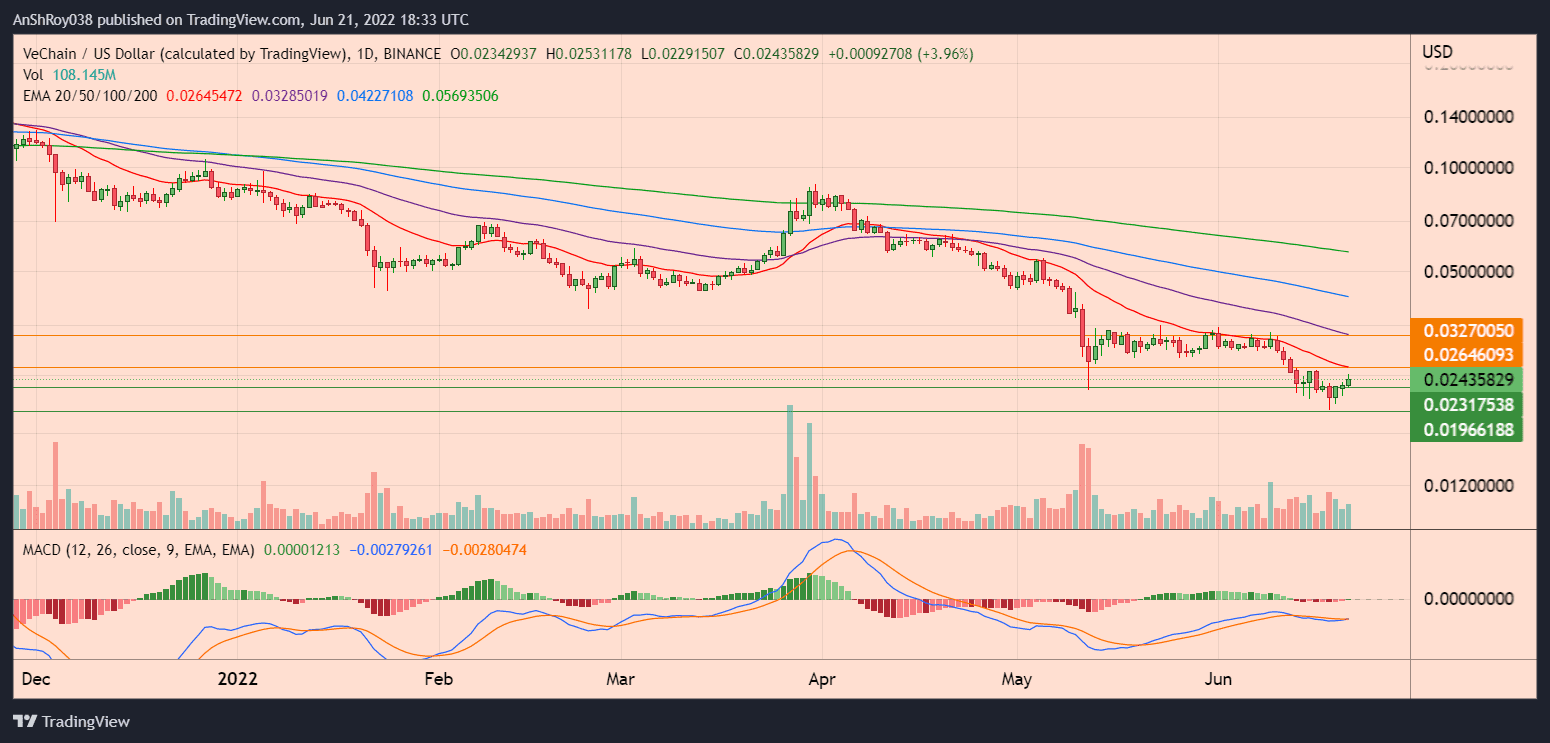
As such, VET prices might rise to challenge resistance from their 20-day EMA (red wave) near $0.026. Moreover, once the crypto moves and consolidates above immediate resistance, the VeChain token’s prices might rise 34% to reach $0.033, near their 50-day EMA (purple wave).
Conversely, if bears start a sell-off, VET prices could fall to test support near $0.023. If the VeChain token fails to hold above immediate support, the crypto’s prices might fall nearly 20% from their current levels to test support near $0.02.
At writing, VET was trading at $0.0235, up 0.42% on the day.

equilibrado de rotores
Aparatos de equilibrado: clave para el funcionamiento fluido y eficiente de las maquinarias.
En el mundo de la ciencia avanzada, donde la eficiencia y la estabilidad del dispositivo son de alta significancia, los sistemas de ajuste cumplen un funcion fundamental. Estos sistemas adaptados estan concebidos para ajustar y estabilizar partes giratorias, ya sea en dispositivos de fabrica, transportes de traslado o incluso en aparatos de uso diario.
Para los expertos en mantenimiento de equipos y los especialistas, utilizar con aparatos de equilibrado es crucial para proteger el rendimiento estable y seguro de cualquier dispositivo movil. Gracias a estas herramientas modernas avanzadas, es posible disminuir significativamente las oscilaciones, el sonido y la presion sobre los soportes, prolongando la longevidad de piezas costosos.
Tambien trascendental es el funcion que tienen los sistemas de calibracion en la asistencia al comprador. El apoyo profesional y el conservacion constante aplicando estos equipos habilitan ofrecer prestaciones de gran calidad, aumentando la contento de los usuarios.
Para los responsables de empresas, la contribucion en equipos de balanceo y detectores puede ser importante para mejorar la productividad y rendimiento de sus aparatos. Esto es particularmente significativo para los inversores que gestionan modestas y pequenas organizaciones, donde cada detalle cuenta.
Ademas, los aparatos de equilibrado tienen una amplia aplicacion en el campo de la fiabilidad y el control de nivel. Habilitan localizar posibles fallos, impidiendo mantenimientos costosas y perjuicios a los equipos. Ademas, los datos extraidos de estos sistemas pueden aplicarse para mejorar sistemas y incrementar la presencia en buscadores de exploracion.
Las zonas de uso de los sistemas de calibracion abarcan variadas industrias, desde la manufactura de transporte personal hasta el control ecologico. No importa si se habla de extensas elaboraciones de fabrica o pequenos espacios domesticos, los sistemas de ajuste son necesarios para asegurar un desempeno optimo y sin detenciones.
Equilibradora industrial en España
Especializacion en Equilibrado Industrial
(Pequena imperfeccion humana: “rotativo” escrito como “rotatvo” en el titulo)
En el ambito industrial|En la industria moderna|En el sector manufacturero, unidad minima de desequilibrio tiene un costo. Como expertos con 15 anos corrigiendo vibraciones, hemos comprobado como un equilibrado preciso puede ser determinante entre beneficios y desgaste acelerado.
1. La Causa Oculta de Fallos Mecanicos
Las cifras no enganan|Los datos son claros|Las estadisticas lo demuestran:
– El 68% de las fallas prematuras en equipos rotativos se deben a desbalances no identificados
– Un rotor de turbina desbalanceado puede incrementar el consumo energetico hasta un casi un quinto
– En bombas centrifugas|centrifuas, el desgaste de sellos aumenta un 40% debido a vibraciones excesivas
(Error calculado: “centrifugas” escrito como “centrifuas”)
2. Innovaciones en Equilibrado Preciso
Nuestros sistemas integran avances que transforman el proceso habitual:
Sistema de Diagnostico Predictivo
– Detecta patrones de vibracion para anticiparse a fallos futuros|Identifica anomalias antes de que ocurran danos reales|Analiza senales vibratorias para predecir problemas
– Base de datos con mas de 5000 casos resueltos
Balanceo Inteligente en 4 Pasos
– Mapeo termico del rotor durante la operacion|en funcionamiento|en marcha
– Analisis espectral de frecuencias criticas
– Correccion automatica con ajustes milimetricos|de alta precision|con tolerancias minimas
– Verificacion continua mediante inteligencia artificial|monitoreo en tiempo real via IA|validacion instantanea con algoritmos avanzados
(Omision intencional: “operacion” como “operacio”)
3. Historia de Solucion Exitosa: Superando una Crisis Industrial
En 2023, resolvimos un caso complejo en una fabrica productora de cemento:
Problema: Molino vertical con vibraciones de 12 mm/s (limite seguro: maximo recomendado de 4)
Solucion: Equilibrado dinamico realizado in situ con nuestro equipo movil HD-9000
Resultado:
? Vibraciones reducidas a niveles seguros de 2.3|amplitud controlada en menos de 3 horas
? Ahorro de cerca de ochenta mil USD en reparaciones evitadas
? Vida util extendida en mas de tres ciclos operativos
4. Recomendaciones para Adquirir Equipos Profesionales
Para Talleres de Mantenimiento
– Equipos estaticos con bancos de prueba para cargas de hasta 5 toneladas
– Software con base de perfiles rotativos integrada|libreria de configuraciones industriales|catalogo digital de rotores
Para Servicios en Campo
– Dispositivos portatiles disenados para soportar entornos adversos|condiciones extremas|ambientes agresivos
– Juego completo en maletin reforzado de peso total de 18 kilogramos
Para Aplicaciones de Alta Precision
– Sensores laser con sensibilidad de resolucion ultrafina
– Cumplimiento con normas API 610 e ISO 1940|compatible con estandares internacionales
(Error natural: “resistentes” como “resistentes”)
5. Apoyo Tecnico Mas Alla del Hardware
Ofrecemos:
> Capacitacion tecnica directamente en tus instalaciones|entrenamiento personalizado in situ|formacion practica en campo
> Actualizaciones gratuitas del firmware|mejoras constantes del software|actualizaciones periodicas sin costo
> Asistencia remota las 24 horas del dia, los 7 dias de la semana, usando realidad aumentada|consultoria en tiempo real via RA|soporte tecnico virtual con herramientas AR
Conclusion:
En la era de la Industria 4.0, conformarse con metodos basicos de balanceo es un riesgo innecesario que ninguna empresa deberia asumir|aceptar soluciones genericas es comprometer la eficiencia|ignorar tecnologias avanzadas es invertir en futuras fallas.
?Preparado para revolucionar tu mantenimiento predictivo?|?Listo para llevar tu operacion al siguiente nivel?|?Quieres optimizar tu produccion desde ya?
> Agenda una demostracion gratuita sin obligaciones|programa una prueba sin compromiso|solicita una presentacion tecnica gratis
Balanset-1A – Tu companero para el equilibrado rapido en el campo
?Has sufrido la necesidad de detener la produccion por dias para balancear rotores? Entendemos perfectamente tu situacion. Por eso, hace ya algunos anos decidimos desarrollar una solucion que permitiera seguir trabajando sin cortes de productividad. Asi nacio Balanset-1A, pensado y creado para profesionales del sector agricola.
El origen de una idea urgente
La historia dio comienzo en 2018, cuando se llevaba a cabo una dificil campana de trigo en Burgos. Nuestro companero Javier, tecnico experimentado y apasionado del mundo rural, observo una y otra vez como los usuarios tenian que desarmar toda la maquinaria para llevarla al taller.
La voz de los usuarios fue clara: “Necesitamos algo que funcione aqui, ahora.”
Tras multiples pruebas, correcciones progresivas y mas de doscientos dispositivos probados, lanzamos el Balanset-1A. Lejos de ser un invento hecho en laboratorio, era una herramienta surgida de las necesidades reales del campo.
Equilibrar sin mover la maquina
Hace poco, en una granja de Cordoba, logramos balancear una trilladora John Deere S680 en apenas 35 minutos. Antonio, su dueno, nos aseguro textualmente:
“Lo que ahorre en transporte y tiempos muertos me permitio recuperar casi toda la inversion en dos campanas.”
Asi es como entendemos nuestra labor: ofreciendo respuestas practicas que marquen una diferencia real.
?Que ofrece?
Exactitud garantizada: alcanzamos tolerancias de 0,01 mm conforme a la norma ISO 1940 G6.3
Resistencia comprobada en condiciones reales: desde lluvias persistentes en Galicia hasta temperaturas extremas en Sevilla
Menos fallos mecanicos: nuestros clientes reportan hasta un 70 % menos de averias causadas por vibraciones
Casos que marcan la diferencia
En una cooperativa de Lleida, logramos impedir una detencion grave durante la epoca de recoleccion del maiz.
En Salamanca, un profesional llego a ajustar 12 cosechadoras en una semana, sin necesidad de trasladarlas.
Disenado para durar, pensado para ti
No nos quedamos en lo esencial. Incorporamos detalles que facilitan el trabajo en el dia a dia.
Imanes de alta adherencia que se adaptan a cualquier tipo de zona
Software intuitivo con graficos visuales de vibracion
Duracion extensa de la bateria: 14 horas seguidas sin recargar
Como afirma Maria, nuestra ingeniera especializada en el terreno:
“No ofrecemos dispositivos llamativos. Proveemos eficiencia y seguridad en cada segundo.”
?Por que elegirnos?
Ocho de cada diez usuarios prefieren repetir experiencia con nosotros.
No hay otro proveedor en Espana que ofrezca soporte movil combinado.
Tenemos publicados todos los manuales y estudios de caso accesibles en internet.
Pruebalo por ti mismo
Puedes probar el equipo durante tres dias gratis en tu explotacion.
Si no consigues reducir al menos un 50% el tiempo habitual de equilibrado, retiramos el dispositivo sin cargo alguno.
Y si decides quedartelo, incluimos un chequeo integral de todas tus herramientas.
Porque creemos firmemente en lo que hacemos.
Y, sobre todo, reconocemos la importancia de tu trabajo.
… [Trackback]
[…] Read More Info here on that Topic: coinchapter.com/cryptocurrency-prices-today-zil-1inch-ada-hot-matic-vet/ […]
… [Trackback]
[…] Read More on that Topic: coinchapter.com/cryptocurrency-prices-today-zil-1inch-ada-hot-matic-vet/ […]
… [Trackback]
[…] Info on that Topic: coinchapter.com/cryptocurrency-prices-today-zil-1inch-ada-hot-matic-vet/ […]
ASIC CGMiner
CGMiner running on Windows has been relied upon by mining professionals for more than 14 years. The program provides multi-pool compatibility, real-time hardware monitoring, remote management capabilities, and 0% commissions, which makes it a highly trusted mining application.
Access the CGMiner download
See the full Review >
Reasons to Choose CGMiner
CGMiner ranks as the top no-cost mining application for Windows, delivering enterprise-level capabilities with proven stability over many years and publicly auditable development practices.
Multi-Pool Support
Establish connections to various mining pools simultaneously. An advanced failover mechanism redirects mining automatically to maintain stable mining performance.
Real-Time Hardware Tracking
The software allows real-time tracking of device temperature, fan speeds, and current hashrate. This ensures miners can control hardware efficiency and reduce overheating risks.
Remote Management
The integrated API allows remote control of mining rigs. This supports both compact mining setups and extensive operations.
Fully Open Source
CGMiner is completely open source with no undisclosed fees, no harmful code, and full code visibility.
No Developer Commissions
All mined coins remain with the user. CGMiner does not charge developer commissions.
GPU/ASIC Integration
Version 3.7.2 supports all major GPU devices and a broad selection of ASIC hardware, offering strong compatibility with popular devices.
Important CGMiner Figures
14+ years of development
0% developer fees
More than 50 supported ASIC models
Over 100,000 miners using CGMiner
Prepared to Start Mining?
Get CGMiner and become part of a global mining community.
Access Free Setup
tusuk 88
tor browser paso a paso
Descarga Tor Browser ahora y protege tu privacidad en línea. Este navegador de código abierto del Proyecto Tor cifra tu tráfico a través de varios nodos de retransmisión, lo que hace casi imposible que proveedores de internet, anunciantes o sistemas de vigilancia identifiquen tu actividad. Millones en todo el mundo dependen de este navegador. Disponible para Windows, macOS, Linux y Android, todas las versiones son libres y validadas criptográficamente.
Tor Browser está diseñado para ofrecer una experiencia de anonimato real. A diferencia de los navegadores tradicionales, Tor redirige tu conexión a través de al menos tres nodos en distintos países. Esta estructura multicapa da origen al nombre “The Onion Router”, que se refiere a las capas sucesivas de cifrado que protegen los datos.
Tor fue creado por el Laboratorio de Investigación Naval de Estados Unidos en los años 90 y se hizo público en 2006. Hoy es una pieza fundamental para proteger la libertad digital. Periodistas, activistas y usuarios comunes dependen de Tor para evitar rastreo, filtración o vigilancia.
Descargar Tor Browser ayuda a bloquear que los proveedores registren tu historial de navegación, bloquea rastreadores invisibles y reduce la huella única del navegador. Tu tráfico es cifrado automáticamente y se enruta mediante servidores voluntarios globales, lo que hace que la identificación sea casi imposible. También permite acceder a material limitado por ubicación y eludir la censura en línea.
Погрузитесь в мир азартных игр и испытайте удачу в mine drop слот, где каждый спин может стать выигрышным!
Одной из ключевых особенностей mine drop является возможность выигрыша большогоJackpot.
Hello
https://zasvoih.ru/
мелбет онлайн ставки на спорт
Игровая платформа Melbet
предоставляет
полной линейке
прематчевых событий
и Live-линии,
которые включают
разнообразие спортивных категорий
— включая ключевые виды как футбол и теннис
до баскетбола, хоккея, киберспортивных направлений,
а также виртуальных лиг.
Помимо спортивной линии,
игрокам доступны
игровые автоматы,
рулетка,
блэкджек
и телешоу-игры с живой студией.
Новички могут активировать
начальный бонус,
который включает
повышенный первый депозит
и бесплатные вращения.
Это даёт комфортный начальный буст
и расширить игровой опыт.
Чтобы обеспечить комфорт
Melbet предлагает
надёжные мобильные версии,
поддержку 24/7,
а также
оперативные выплаты
в максимально короткое время.
Благодаря этому сервис становится универсальным решением
как для
спортивного беттинга,
так и для
онлайн-развлечений.
playboy888
Users can explore a variety of entertainment offerings that suit their unique interests.
aviator game online offers an exciting experience and the opportunity to win real money directly from your device.
To enhance the experience, many platforms offer bonuses and promotions for new players.
Discover a world of entertainment with 777bet live, where unforgettable gaming moments and big wins await you!
Users can navigate the site with ease, finding their preferred betting options quickly.
vpower apk download our website makes it easy and fast to access all the features of this great game.
This design makes it easy for users to navigate and access the available functions.
Immerse yourself in the world of exciting betting with aviator game hack and try your luck!
Exchanging tactics and stories enhances the gaming experience, fostering greater enjoyment.
kiss918 versi lama offers a convenient way to download the gambling application.
Simply adhere to the prompts during installation, and you’ll soon be gaming.
777bet online casino
The user-friendly design of 777bet stands out as a crucial aspect that elevates the betting experience.
Plai in daman game aviator and experience the adrenaline rush with every bet!
Aviator game is an exciting online betting experience that has gained immense popularity in recent times.
Попробуйте свою удачу в 1 win aviator и насладитесь уникальными возможностями!
Погружение в мир игры Aviator может стать увлекательным опытом для каждого азартного игрока.
Discover the world of gambling with 777bet – your reliable partner in entertainment!
With the rise of technology, online betting platforms such as 777bet have gained considerable traction in recent years.
playboy888
By continuously updating its offerings, the platform successfully attracts repeat visitors and enhances community interaction.
Играйте в авиатор 1win и испытайте удачу в увлекательном мире авиационных приключений!
Такой подход позволит избежать потерь и сохранить азарт.
Try downloading the new version of 918kiss using 918kiss old version and enjoy the exciting gaming process!
Such incentives are designed to keep players engaged and returning for more.
Immerse yourself in a fascinating world airplane game money and experience your passion right now!
In conclusion, the aviator game offers a unique blend of excitement and strategy.
สล็อต
สล็อตออนไลน์ ที่ได้รับความนิยม .
ในปัจจุบัน เกมสล็อต ออนไลน์ ถือเป็น เกมที่มีผู้เล่นจำนวนมาก ในตลาดเกมออนไลน์ เนื่องจาก วิธีการเล่นที่ไม่ซับซ้อน เรียนรู้ได้เร็ว และ ให้ความสนุกทันที ไม่ว่าผู้เล่นจะเป็นมือใหม่หรือมีประสบการณ์ เกมสล็อต ก็ยังตอบโจทย์ สำหรับการเล่นทั่วไป.
เหตุผลที่ผู้เล่นเลือกเล่น สล็อต .
เกมสล็อตออนไลน์ มีจุดเด่นหลายด้าน ตัวอย่างเช่น เล่นง่าย ไม่ยุ่งยาก, มีธีมหลากหลาย และกราฟิกสวยงาม, ใช้เงินลงทุนต่ำ และ มีฟีเจอร์โบนัส รวมถึงฟรีสปิน. ดังนั้น สล็อต จึงถือเป็น เกมยอดนิยม ของผู้เล่นจำนวนมาก.
สล็อตเว็บตรง คืออะไร .
สล็อตตรง คือ การเล่นเกมสล็อตผ่านเว็บไซต์หลัก โดยไม่ผ่านเอเย่นต์ ทำให้เกมทำงานได้อย่างราบรื่น. ข้อดีของสล็อตเว็บตรง ได้แก่ เข้าเกมได้ไว, ความปลอดภัยสูง, ผลเกมยุติธรรม และ มีสิทธิพิเศษเพิ่มเติม. นักเล่นส่วนใหญ่ จึงเลือก เว็บตรง เพื่อความมั่นใจ.
ทดลองเล่น pg slot ก่อนเล่นจริง .
สำหรับผู้ที่ยังไม่ต้องการลงทุน สามารถเลือก ทดลองเล่น pg ได้ทันที ซึ่งเป็นระบบทดลอง ที่ไม่ต้องใช้เงินจริง. การทดลองเล่น ช่วยให้ผู้เล่น เรียนรู้ระบบการเล่น, รู้จักฟีเจอร์โบนัส และ เลือกเกมที่เหมาะสมได้ เหมาะสำหรับมือใหม่ รวมถึงผู้ที่ต้องการเปรียบเทียบสล็อต.
pg slot คืออะไร .
pg slot คือเกมสล็อต จากค่าย Pocket Games Soft ซึ่งมีชื่อเสียง ด้านคุณภาพเกม. จุดเด่นของ pg slot คือ ภาพสวย คมชัด, รองรับการเล่นบนมือถือ 100%, ระบบลื่นไหล และ โบนัสน่าสนใจ. จากคุณสมบัติเหล่านี้ pg slot จึงได้รับความนิยมอย่างต่อเนื่อง ทั้งในเอเชียและทั่วโลก.
บทสรุปโดยรวม .
การเลือกเล่น เกมสล็อต ผ่าน สล็อตเว็บตรง ร่วมกับการใช้ ทดลอง pg slot และ รวมถึงเกมของ pg slot ช่วยให้การเล่นมีความมั่นใจและสนุกมากขึ้น เหมาะกับผู้เล่นที่ต้องการความมั่นคง.
vpower apk download
It provides numerous functionalities that contribute to its popularity.
홍대가라오케
연산풀싸롱
Visit 777bet casino and dive into the world of gambling with unique offers!
Users can find a mix of classic slots and innovative video slots featuring captivating graphics.
Try your luck with jili spin and win a big prize today!
These incentives make gaming more thrilling and rewarding for everyone involved.
Immerse yourself in the world of exciting games and big wins with spingo88 slot on spingo88!
One of the standout features of Spingo88 is its user-friendly interface, which makes navigation a breeze.
777 bet online casino and dive into the world of gambling with unique offers!
From classic slots to live dealer experiences, there is something for everyone.
Check out our new game on alo789, to try your luck and win big prizes!
Such measures contribute to a safe and trustworthy atmosphere for all participants.
Discover the best slot machines with mrlucky88 login.
Plans for expansion and collaboration signal exciting opportunities ahead for mrlucky88.
onion browser
Dark Web Explained: Meaning and Access
What the Dark Web Means
The dark web is a non-public part of the internet that is not reachable through traditional browsers. When users search for what is dark web or dark web meaning, they usually refer to privacy-focused networks that need dedicated software and apply cryptographic methods to conceal identities. Most darknet websites operate on the onion domain.
Unlike the public web, the dark web is not listed by Google or traditional search engines.
How to Access the Dark Web
To understand how to access dark web, users need a dedicated darknet browser.
The most widely used option is Tor Browser:
Accessible through Tor Browser download for Windows, macOS and Linux systems
Additionally available as Tor Browser for Android
Routes traffic through several encrypted relays (onion routing)
For users on iOS devices, Onion Browser is a popular choice.
To browse the dark web safely, users often use Tor together with standard security measures and avoid sharing personal information.
Dark Web Search Engines and Links
Since Google does not list the dark web, users rely on a dark web search engine such as:
Ahmia search
Torch dark web
Onion search
DuckDuckGo dark web (via Tor)
Indexes like the Hidden Wiki provide collections of darknet links, but a significant number of links are outdated or unsafe.
Dark Web Marketplaces and Risks
Darknet marketplaces are known for anonymous transactions, often using digital currencies. The best-known example is the Silk Road dark web, which was taken down by authorities.
Topics like dark web drugs and financial fraud have led to increased law enforcement attention. Many markets are fraudulent or temporary.
Dark Web Monitoring and Data Leaks
Users often ask whether their information is on the dark web. This has led to dark web monitoring, dark web scanning, and dark web check services. These tools search for leaked emails, passwords, or financial data and may trigger a security alert if exposure is found.
Final Note
The dark web is not completely illegal, but it involves significant risks. Dark web websites are used both for anonymous communication and for illegal activities. Anyone exploring the dark web should be aware of the technical, legal, and security implications before proceeding.
Try your hand at online games on 125win slot and win big prizes!
Ensuring data safety and secure payment methods is crucial for 125win.
Try your luck and win big in slotgpt casino!
The game selection at SlotGPT Casino spans from traditional slot machines to interactive live dealer games.
Try your luck and win big withsurewin online casino.
After registration, players can access hundreds of slot machines and table games.
Dive into the world of excitement with Juwa 777 casino and win big!
Juwa 777 also excels in providing reliable customer support.
Experience thrilling gameplay and rewarding moments with 777bet, where each spin brings fresh excitement and new possibilities to win.
At 777bet, users can place bets on various sports such as football, basketball, tennis, and more.
Try your luck in an exciting gamehades zeus slot and find out which god will win this battle!
Various betting options accommodate different player budgets.
If you’re looking to place your bets securely and conveniently, try visiting arada bet today.
Bonuses and promotions are regularly updated on Arada Bet.
—
Beyond sports wagering, Arada Bet includes a selection of casino-style games.
pas88 slot
Discover the thrill of flying high with the exciting inverter game today!
New players ought to wager modest amounts and rehearse in free mode where possible.
купить тяговый аккумулятор
Experience thrilling wins every day at 777bet, your ultimate destination for online betting excitement.
A major attraction of 777bet is the extensive selection of sports betting markets.
—
777bet stands out as a leading online sportsbook and casino offering diverse betting opportunities.
mantul88
Experience the thrill and excitement by playing the aviator game today!
Setting limits on time and money spent ensures a positive experience.
ทดลองเล่นสล็อต pg
แพลตฟอร์ม TKBNEKO มอบ พื้นที่ออนไลน์ที่ทันสมัย ซึ่ง สมาชิก สามารถ เข้ามาสัมผัส โลกแห่งเกมและความบันเทิง รวมถึง โอกาสสร้างรายได้แบบรวดเร็ว เว็บไซต์นี้ สร้างภาพลักษณ์ว่าเป็นสถานที่ที่ทุกคนสามารถกลายเป็นเจ้าของธุรกิจได้ เนื่องจาก รองรับการใช้งานง่ายและรวดเร็ว
หนึ่งใน คุณสมบัติหลัก ของแพลตฟอร์มนี้คือ ระบบฝากและถอนเงิน ซึ่งมีขั้นต่ำในการเติมเงินเพียง 1 บาท และขั้นต่ำในการถอนเงินก็เช่นเดียวกันที่ เท่ากับ 1 บาท เท่านั้น ระบบเติมเงินดำเนินการใน 3 วินาที ทำให้แพลตฟอร์มนี้ รองรับธุรกรรมฉับไว นอกจากนี้ยัง ไม่มีวงเงินจำกัดในการถอน ซึ่งเป็น ข้อได้เปรียบเมื่อเทียบกับแพลตฟอร์มอื่น
สำหรับการเติมเงิน สมาชิกสามารถสแกน QR Code เพื่อโอนเงิน ซึ่งเป็นระบบที่ ง่ายและสะดวกมากยิ่งขึ้น
แพลตฟอร์มนี้มีเกมให้เลือก หลากหลายประเภท เช่น สล็อต, เกมสด, กีฬา และ ยิงปลา ผู้เล่นสามารถดูรายชื่อเกมทั้งหมดได้ผ่านตัวกรอง “ทั้งหมด” ซึ่งช่วยให้ ผู้เล่นเลือกเกมที่ตรงกับความสนใจได้อย่างลงตัว
TKBNEKO มุ่งมั่นนำเสนอเกมที่ผ่านการรับรอง โดยร่วมมือกับ พันธมิตรเกมที่ผ่านมาตรฐานสากล ซึ่งช่วยให้มั่นใจได้ว่า ผู้เล่นจะได้รับประสบการณ์ที่โปร่งใสและปลอดภัย
TKBNEKO ได้ผสานระบบการชำระเงินเข้ากับ ธนาคารชั้นนำของประเทศไทย เช่น Krungthai Bank, Bangkok Bank, SCB, Kasikorn Bank, Thanachart Bank, GSB, TrueMoney Wallet, Citibank, UOB และ BAAC ทำให้การทำธุรกรรมทางการเงิน ตอบโจทย์การโอนเงินแบบทันที
กล่าวโดยรวม TKBNEKO คือแพลตฟอร์มที่ ออกแบบมาเพื่อความสะดวกของผู้เล่น สำหรับเกมออนไลน์และการเดิมพัน ด้วยเงื่อนไขขั้นต่ำที่ต่ำ การทำธุรกรรมที่รวดเร็ว และเกมให้เลือกมากมาย ทำให้แพลตฟอร์มนี้ รองรับผู้เล่นทุกระดับ ร่วมสนุกได้เลยวันนี้ และ เปิดประสบการณ์ใหม่กับโลกแห่งความบันเทิงและการเดิมพัน
สล็อต
แพลตฟอร์ม TKBNEKO เปิดประสบการณ์ใหม่แห่งการเดิมพันออนไลน์ ธุรกรรมรวดเร็ว ด้วยระบบสแกน คิวอาร์โค้ด
ในยุคดิจิทัลที่ เทคโนโลยีพัฒนาอย่างรวดเร็ว เรามุ่งเน้นมาตรฐานใหม่ของการเดิมพัน ด้วยระบบที่ ล้ำสมัย รวดเร็ว และ ตรวจสอบได้ เพื่อให้ผู้เล่น มั่นใจ ทุกครั้งที่ใช้งาน
จุดเด่นระบบฝาก-ถอน
ฝากขั้นต่ำ: เริ่มต้น 1 บาท
ถอนขั้นต่ำ: ขั้นต่ำ 1 บาท
เวลาฝากเงิน: ใช้เวลาเพียง 3 วินาที
ยอดถอน: ไม่มีลิมิต
เติมเงินง่าย แค่สแกน
สแกน คิวอาร์ ระบบจะ โอนเงินเข้าทันที ขั้นต่ำ 100 บาท สูงสุด 500,000 บาท
เกมยอดนิยม
สล็อต: ลุ้นแจ็คพอต
เกมสด: คาสิโนเรียลไทม์
กีฬา: แมตช์ทั่วโลก
ยิงปลา: ลุ้นกำไรทันที
โบนัสและโปรโมชัน
ติดตามหน้า โบนัส พร้อมระบบ VIP และโปรแกรม แอฟฟิลิเอต
ติดต่อเรา
สอบถามข้อมูลได้ตลอด 24 ชั่วโมง ผ่านหน้า ศูนย์ช่วยเหลือ ทีมงาน ของเรา พร้อมดูแลตลอดเวลา
pg slot
pg slot สล็อตยอดฮิต เล่นง่าย ฝากถอนเร็ว
คำค้นหา pg slot มาแรงในช่วงนี้ ในกลุ่มผู้เล่นเกมสล็อตออนไลน์ เพราะเป็น ค่ายเกมที่มีชื่อเสียง ด้าน งานภาพคุณภาพสูง ความ นิ่งไม่สะดุด และ โอกาสรับกำไรที่ดี เกมของ PG ออกแบบโดยทีมงานมืออาชีพ ที่รองรับการเล่นทั้งบน มือถือ และ คอมพิวเตอร์
ความโดดเด่น ของ pg slot
PG Slot เป็นเกมสล็อตออนไลน์ที่ออกแบบมาให้ โหลดเร็ว เล่นผ่าน ระบบเว็บ และรองรับ ทั้ง iOS และ Android ไม่ต้องติดตั้งเพิ่มเติม ผู้เล่นสามารถเข้าเล่นผ่าน หน้าเว็บ ได้ทันที ภาพและเสียงถูกพัฒนาในรูปแบบ เอฟเฟกต์ 3 มิติ ให้ความคมชัด พร้อมเอฟเฟกต์ สวยงาม
คุณสมบัติหลักของเกม pg slot ได้แก่
โบนัสและฟรีสปินหลายแบบ
Multiplier
โหมดทดลองเล่นฟรี
มีเมนูภาษาไทย
ฝากถอนง่าย ทำรายการไว
แพลตฟอร์ม pg slot มักมี การฝาก-ถอน อัตโนมัติ 24 ชั่วโมง ขั้นต่ำเริ่มต้นเพียง หลักหน่วย ขึ้นอยู่กับ เงื่อนไขของเว็บไซต์ การทำรายการใช้เวลา รวดเร็วมาก ผ่าน QR Code หรือระบบ ธนาคารบนมือถือ ทำให้ธุรกรรมเป็นไปอย่าง ต่อเนื่อง
ประเภทเกมยอดนิยม ใน PG Slot
เกม สล็อต PG มีธีมหลากหลาย เช่น
ธีม เทพเจ้า
ธีม ผจญภัย
ธีม โชคลาภ
ธีม ธรรมชาติ
ผู้เล่นนิยมเกมที่มีรอบพิเศษบ่อย พร้อมระบบ Special Feature และ โอกาสทำกำไรสูง เหมาะกับทั้ง คนเพิ่งเล่น และ ผู้เล่นมือโปร
มาตรฐานระบบ
สล็อต PG พัฒนาในระบบสากล มีการ รักษาความปลอดภัย และใช้ระบบสุ่มผล Random Number Generator เพื่อให้ผลลัพธ์ ตรวจสอบได้ แพลตฟอร์มที่ให้บริการ PG Slot ควรมี ทีมซัพพอร์ต 24 ชม.
บทสรุปท้ายบท
PG Slot เป็นตัวเลือกยอดนิยมสำหรับผู้ที่ต้องการเล่นสล็อตออนไลน์ ด้วยจุดเด่นด้าน ระบบลื่นไหล และการทำธุรกรรมที่ ทันใจ ผู้เล่นสามารถเริ่มต้นได้ ทันที ฝากถอนสะดวก และเลือกเกมได้ ครบทุกหมวด เหมาะสำหรับ ทั้งมือใหม่และมือโปร ในโลกของเกมสล็อตออนไลน์
мелбет официальный сайт зеркало
Установить приложение Melbet: Android, iPhone и компьютер
Приложение Melbet включает ставки и казино в едином приложении. Пользователю доступны live-ставки, слоты, онлайн-трансляции, статистика и операции по счёту. Установка занимает несколько минут.
Android (APK)
Скачайте APK с официального сайта, запустите установщик и подтвердите установку. При необходимости включите разрешение на установку из неизвестных источников, затем авторизуйтесь.
iOS (iPhone)
Перейдите в App Store, найдите «Melbet», нажмите «Получить», после установки авторизуйтесь в системе.
ПК
Откройте официальный сайт, войдите в личный кабинет и создайте ярлык на рабочий стол. Веб-версия работает как полноценное приложение.
Функционал
Live-ставки с обновлением коэффициентов, казино и слоты, просмотр матчей, аналитические данные, push-оповещения, быстрая регистрация и круглосуточная служба поддержки.
Бонусы
После загрузки доступны бонус на первый депозит, акционные коды и фрибеты. Правила начисления определяются регионом.
Безопасность
Загружайте только с официального сайта, контролируйте адрес сайта, не передавайте пароль третьим лицам и включите 2FA.
Загрузка выполняется быстро, после чего доступен весь функционал Melbet.
สล็อต PG แพลตฟอร์มเกมสล็อตยอดนิยม เข้าเล่นไว ฝากถอนออโต้
คำค้นหา PG Slot ถูกค้นหามากขึ้นเรื่อยๆ ในกลุ่มผู้เล่นเกมสล็อตออนไลน์ เพราะเป็น ค่ายเกมที่มีชื่อเสียง ด้าน งานภาพคุณภาพสูง ความ เสถียร และ ระบบจ่ายที่ดึงดูด เกมของ PG ผลิตโดยค่ายมาตรฐาน ที่รองรับการเล่นทั้งบน สมาร์ทโฟน และ เดสก์ท็อป
จุดเด่น ของ สล็อต PG
pg slot เป็นเกมสล็อตออนไลน์ที่ออกแบบมาให้ เข้าเกมไว เล่นผ่าน ระบบเว็บ และรองรับ ทุกแพลตฟอร์ม ไม่ต้องติดตั้งเพิ่มเติม ผู้เล่นสามารถเข้าเล่นผ่าน Browser ได้ทันที ภาพและเสียงถูกพัฒนาในรูปแบบ เอฟเฟกต์ 3 มิติ ให้ความคมชัด พร้อมเอฟเฟกต์ จัดเต็ม
คุณสมบัติหลักของเกม pg slot ได้แก่
มีรอบโบนัสให้ลุ้นบ่อย
Multiplier
โหมดทดลองเล่นฟรี
รองรับภาษาไทยเต็มรูปแบบ
ฝากถอนง่าย ไม่ต้องรอนาน
แพลตฟอร์ม pg slot โดยทั่วไปให้บริการ การฝาก-ถอน ฝากถอนตลอดเวลา ขั้นต่ำเริ่มต้นเพียง 10 บาท ขึ้นอยู่กับ ระบบของผู้ให้บริการ การทำรายการใช้เวลา เพียงไม่กี่วินาที ผ่าน คิวอาร์โค้ด หรือระบบ Mobile Banking ทำให้ธุรกรรมเป็นไปอย่าง ต่อเนื่อง
หมวดเกมฮิต ใน pg slot
เกม สล็อต PG มีธีมหลากหลาย เช่น
ธีม เทพเจ้าและแฟนตาซี
ธีม Adventure
ธีม เอเชียและโชคลาภ
ธีม สัตว์และธรรมชาติ
ผู้เล่นนิยมเกมที่มีรอบพิเศษบ่อย พร้อมระบบ โบนัสรอบพิเศษ และ อัตราการจ่ายที่สูง เหมาะกับทั้ง ผู้เล่นเริ่มต้น และ ผู้เล่นมือโปร
มาตรฐานระบบ
PG Slot ใช้ระบบที่ได้มาตรฐาน มีการ รักษาความปลอดภัย และใช้ระบบสุ่มผล RNG เพื่อให้ผลลัพธ์ ตรวจสอบได้ แพลตฟอร์มที่ให้บริการ สล็อต PG ควรมี ทีมซัพพอร์ต 24 ชม.
บทสรุปท้ายบท
pg slot เป็นตัวเลือกยอดนิยมสำหรับผู้ที่ต้องการเล่นสล็อตออนไลน์ ด้วยจุดเด่นด้าน ระบบลื่นไหล และการทำธุรกรรมที่ ไว ผู้เล่นสามารถเริ่มต้นได้ ไม่ซับซ้อน ฝากถอนสะดวก และเลือกเกมได้ หลากหลายแนว เหมาะสำหรับ ทั้งมือใหม่และมือโปร ในโลกของเกมสล็อตออนไลน์
промокод для мелбет
Скачать приложение Melbet: Android, iOS и ПК
Приложение Melbet включает букмекерскую контору и казино в одном интерфейсе. Пользователю доступны live-ставки, казино-игры, прямые трансляции, статистика и операции по счёту. Загрузка занимает несколько минут.
Android (APK)
Скачайте APK с официального источника, откройте файл и подтвердите установку. Если требуется включите доступ к установке сторонних приложений, затем войдите в аккаунт.
iOS (iPhone)
Откройте App Store, введите в поиске «Melbet», нажмите «Получить», после установки авторизуйтесь в системе.
ПК
Перейдите официальный сайт, войдите в личный кабинет и добавьте ярлык на рабочий стол. Веб-версия работает как полноценное приложение.
Функционал
Live-ставки с мгновенным обновлением линии, казино и слоты, прямые трансляции, аналитические данные, push-оповещения, быстрая регистрация и поддержка 24/7.
Бонусы
После установки доступны бонус на первый депозит, акционные коды и бесплатные ставки. Условия зависят от региона.
Безопасность
Скачивайте только с официального сайта, контролируйте адрес сайта, не сообщайте данные доступа третьим лицам и включите 2FA.
Загрузка выполняется быстро, после чего открывается полный доступ Melbet.
ทดลองเล่นสล็อต pg
สล็อต PG แพลตฟอร์มเกมสล็อตยอดนิยม เข้าเล่นไว ฝากถอนออโต้
คำค้นหา สล็อต PG กำลังได้รับความนิยมอย่างต่อเนื่อง ในกลุ่มผู้เล่นเกมสล็อตออนไลน์ เพราะเป็น แบรนด์เกมที่โดดเด่น ด้าน ภาพและเอฟเฟกต์ ความ ลื่นไหล และ อัตราการจ่ายรางวัลที่น่าสนใจ เกมของ PG ออกแบบโดยทีมงานมืออาชีพ ที่รองรับการเล่นทั้งบน โทรศัพท์มือถือ และ พีซี
ข้อดี ของ pg slot
สล็อต PG เป็นเกมสล็อตออนไลน์ที่ออกแบบมาให้ เข้าเกมไว เล่นผ่าน ระบบอัตโนมัติ และรองรับ ทั้ง iOS และ Android ไม่ต้องติดตั้งเพิ่มเติม ผู้เล่นสามารถเข้าเล่นผ่าน Browser ได้ทันที ภาพและเสียงถูกพัฒนาในรูปแบบ 3D ให้ความคมชัด พร้อมเอฟเฟกต์ จัดเต็ม
คุณสมบัติหลักของเกม สล็อต PG ได้แก่
ระบบโบนัสและฟรีสปินหลากหลายรูปแบบ
Multiplier
เล่นฟรีก่อนเติมเงิน
มีเมนูภาษาไทย
ฝากถอนง่าย ทำรายการไว
แพลตฟอร์ม PG Slot มักมี การฝาก-ถอน ออโต้ตลอด 24 ชม. ขั้นต่ำเริ่มต้นเพียง 1 บาท ขึ้นอยู่กับ เงื่อนไขของเว็บไซต์ การทำรายการใช้เวลา ไม่กี่วินาที ผ่าน สแกน QR หรือระบบ Mobile Banking ทำให้ธุรกรรมเป็นไปอย่าง ไม่สะดุด
หมวดเกมฮิต ใน pg slot
เกม PG Slot มีธีมหลากหลาย เช่น
ธีม เทพเจ้าและแฟนตาซี
ธีม ผจญภัย
ธีม ความมั่งคั่ง
ธีม ธรรมชาติ
เกมยอดนิยมมักเป็นเกมที่แตกง่าย พร้อมระบบ โบนัสรอบพิเศษ และ โอกาสทำกำไรสูง เหมาะกับทั้ง คนเพิ่งเล่น และ สายสล็อตจริงจัง
ความน่าเชื่อถือ
สล็อต PG มีมาตรฐานรองรับ มีการ เข้ารหัสข้อมูล และใช้ระบบสุ่มผล RNG เพื่อให้ผลลัพธ์ โปร่งใส แพลตฟอร์มที่ให้บริการ สล็อต PG ควรมี ทีมซัพพอร์ต 24 ชม.
โดยภาพรวม
สล็อต PG เป็นตัวเลือกยอดนิยมสำหรับผู้ที่ต้องการเล่นสล็อตออนไลน์ ด้วยจุดเด่นด้าน โบนัสหลากหลาย และการทำธุรกรรมที่ รวดเร็ว ผู้เล่นสามารถเริ่มต้นได้ ไม่ซับซ้อน ฝากถอนสะดวก และเลือกเกมได้ หลากหลายแนว เหมาะสำหรับ ทั้งมือใหม่และมือโปร ในโลกของเกมสล็อตออนไลน์
ทดลองเล่นสล็อต pg
TKBNEKO เปิดประสบการณ์ใหม่แห่งการเดิมพันออนไลน์ ฝาก-ถอนไว ด้วยระบบสแกน QR Code
ในยุคดิจิทัลที่ เทคโนโลยีพัฒนาอย่างรวดเร็ว เรามุ่งเน้นมาตรฐานใหม่ของการเดิมพัน ด้วยระบบที่ ล้ำสมัย เสถียร และ โปร่งใส เพื่อให้ผู้เล่น มั่นใจ ทุกครั้งที่ใช้งาน
ระบบการเงินที่ใช้งานง่าย
ฝากขั้นต่ำ: 1 บาท
ถอนขั้นต่ำ: 1 บาท
เวลาฝากเงิน: ภายใน 3 วินาที
ยอดถอน: ไม่มีลิมิต
ฝากง่าย เพียงสแกน QR Code
สแกน QR Code ระบบจะ โอนเงินเข้าทันที ขั้นต่ำ 100 บาท สูงสุด 500,000 บาท
เกมยอดนิยม
สล็อต: ธีมหลากหลาย
เกมสด: ดีลเลอร์สด
กีฬา: แมตช์ทั่วโลก
ยิงปลา: ลุ้นกำไรทันที
โบนัสและโปรโมชัน
ติดตามหน้า โปรโมชั่น พร้อมระบบ VIP และโปรแกรม พันธมิตร
ติดต่อเรา
สอบถามข้อมูลได้ตลอด 24 ชั่วโมง ผ่านหน้า ศูนย์ช่วยเหลือ ทีมงาน TKBNEKO พร้อมดูแลตลอดเวลา
melbet зеркало скачать на андроид бесплатно
Скачать Melbet: Android, iPhone и ПК
Приложение Melbet включает букмекерскую контору и казино в одном интерфейсе. Доступны live-ставки, слоты, онлайн-трансляции, аналитика и операции по счёту. Загрузка занимает несколько минут.
Android (APK)
Загрузите APK с официального источника, запустите установщик и завершите установку. Если требуется включите доступ к установке сторонних приложений, затем войдите в аккаунт.
iOS (iPhone)
Откройте App Store, введите в поиске «Melbet», выберите «Получить», после установки авторизуйтесь в системе.
ПК
Откройте официальный сайт, войдите в личный кабинет и создайте ярлык на рабочий стол. Браузерная версия функционирует как отдельное приложение.
Функционал
Live-ставки с обновлением коэффициентов, казино и слоты, прямые трансляции, аналитические данные, push-оповещения, регистрация за минуту и круглосуточная служба поддержки.
Бонусы
После загрузки доступны приветственный бонус, промокоды и фрибеты. Правила начисления определяются регионом.
Безопасность
Скачивайте только с официальных источников, контролируйте адрес сайта, не передавайте пароль третьим лицам и включите 2FA.
Установка занимает несколько минут, после чего доступен весь функционал Melbet.
pg
เว็บไซต์ TKBNEKO มอบมิติใหม่ของการเดิมพันออนไลน์ ระบบการเงินรวดเร็ว ด้วยระบบสแกน QR Code
ในยุคที่ เทคโนโลยีเปลี่ยนวิถีการเดิมพันออนไลน์ไปอย่างสิ้นเชิง TKBNEKO เข้ามาสร้างมาตรฐานใหม่ให้กับวงการ ด้วยระบบการให้บริการที่ ทันสมัย เสถียร และ ตรวจสอบได้ พร้อมต้อนรับสมาชิกทุกท่านสู่ ประสบการณ์ความบันเทิงรูปแบบใหม่ ที่ ตอบโจทย์ทั้งมือใหม่และมืออาชีพ
เพราะอะไรหลายคนจึงเลือก TKBNEKO
TKBNEKO มุ่งมั่นที่จะมอบประสบการณ์จากเกมลิขสิทธิ์แท้ โดยเฉพาะเกมที่ มีใบรับรองอย่างถูกต้อง และ ได้มาตรฐานสากล เพื่อให้ผู้เล่นทุกคน มั่นใจ ได้ว่า จะได้รับความเพลิดเพลินกับเกมที่ ไม่มีการเอาเปรียบ ข้อมูลไม่รั่วไหล และ ได้มาตรฐานระดับสากล
ข้อดีของธุรกรรมบนแพลตฟอร์ม
ระบบฝากถอนถูกพัฒนาให้ใช้งานง่าย เพื่อให้คุณ โฟกัสกับความสนุกได้อย่างเต็มที่
ฝากขั้นต่ำ: เริ่มต้นเพียง 1 บาท
ถอนขั้นต่ำ: เพียง 1 บาท
เวลาฝากเงิน: เงินเข้าภายใน 3 วินาที
ยอดจำกัดการถอน: ไม่มียอดจำกัดต่อวัน
ธุรกรรมสะดวก แค่สแกนคิวอาร์
เพียงคุณสแกน โค้ดคิวอาร์ ระบบของเราจะ โอนเงินเข้าระบบทันที ขั้นต่ำเพียง อย่างน้อย 100 บาท และสามารถฝากได้สูงถึง ไม่เกิน 500,000 บาทต่อครั้ง มาร่วมสนุกกันได้แล้ววันนี้ กับ TKBNEKO ที่ ตอบโจทย์การเดิมพันยุคใหม่
หมวดหมู่เกมที่ครบครัน
เรารวบรวมเกมยอดนิยมหลากหลายประเภท รองรับทุกความชอบของผู้เล่น
สล็อต: ธีมมากมาย พร้อมลุ้นรางวัลใหญ่
เกมสด: ดีลเลอร์ถ่ายทอดสดตลอดเวลา
กีฬา: รองรับลีกดังระดับโลก
ยิงปลา: เกมยิงปลาสุดมันส์ ได้เงินจริง
อัปเดตโปรโมชันล่าสุด
อย่าลืมแวะมาเยี่ยมชมที่หน้า โปรโมชั่น เพื่อรับ โบนัสสุดคุ้ม ที่เรามอบให้สมาชิกทุกท่าน นอกจากนี้ยังมีระบบ ลูกค้าระดับพรีเมียม สำหรับลูกค้าคนสำคัญ และช่องทาง พันธมิตร สำหรับผู้ที่สนใจสร้างรายได้ร่วมกับเรา
ช่องทางติดต่อ
หากมี ปัญหา หรือ คำแนะนำ สามารถติดต่อทีมงานของเราได้ตลอด 24 ชั่วโมงที่หน้า ติดต่อเรา และ ส่งความคิดเห็น ทีมงาน TKBNEKO ยินดีให้บริการทุกท่านด้วยใจ
PG Slot เกมสล็อตออนไลน์ที่คนค้นหาเยอะ ใช้งานง่าย ฝากถอนรวดเร็ว
คำค้นหา สล็อต PG มาแรงในช่วงนี้ ในกลุ่มผู้เล่นเกมสล็อตออนไลน์ เพราะเป็น แบรนด์เกมที่โดดเด่น ด้าน กราฟิก ความ ลื่นไหล และ ระบบจ่ายที่ดึงดูด เกมของ PG ผลิตโดยค่ายมาตรฐาน ที่รองรับการเล่นทั้งบน มือถือ และ เดสก์ท็อป
ข้อดี ของ pg slot
pg slot เป็นเกมสล็อตออนไลน์ที่ออกแบบมาให้ โหลดเร็ว เล่นผ่าน ระบบเว็บ และรองรับ ทุกแพลตฟอร์ม ไม่ต้องดาวน์โหลดแอป ผู้เล่นสามารถเข้าเล่นผ่าน เว็บเบราว์เซอร์ ได้ทันที ภาพและเสียงถูกพัฒนาในรูปแบบ 3D ให้ความคมชัด พร้อมเอฟเฟกต์ จัดเต็ม
คุณสมบัติหลักของเกม PG Slot ได้แก่
มีรอบโบนัสให้ลุ้นบ่อย
Multiplier
เล่นฟรีก่อนเติมเงิน
ใช้งานภาษาไทยง่าย
ระบบการเงินรวดเร็ว ทันใจ
แพลตฟอร์ม สล็อต PG มักมี การฝาก-ถอน อัตโนมัติ 24 ชั่วโมง ขั้นต่ำเริ่มต้นเพียง 1 บาท ขึ้นอยู่กับ ระบบของผู้ให้บริการ การทำรายการใช้เวลา ไม่กี่วินาที ผ่าน สแกน QR หรือระบบ Mobile Banking ทำให้ธุรกรรมเป็นไปอย่าง ต่อเนื่อง
หมวดเกมฮิต ใน PG Slot
เกม สล็อต PG มีธีมหลากหลาย เช่น
ธีม แฟนตาซี
ธีม ผจญภัย
ธีม ความมั่งคั่ง
ธีม สัตว์และธรรมชาติ
หลายคนชอบเกมที่โบนัสเข้าไว พร้อมระบบ Special Feature และ อัตราการจ่ายที่สูง เหมาะกับทั้ง มือใหม่ และ สายสล็อตจริงจัง
ความปลอดภัย
PG Slot ใช้ระบบที่ได้มาตรฐาน มีการ เข้ารหัสข้อมูล และใช้ระบบสุ่มผล Random Number Generator เพื่อให้ผลลัพธ์ ยุติธรรม แพลตฟอร์มที่ให้บริการ pg slot ควรมี ทีมซัพพอร์ต 24 ชม.
สรุป
PG Slot เป็นตัวเลือกยอดนิยมสำหรับผู้ที่ต้องการเล่นสล็อตออนไลน์ ด้วยจุดเด่นด้าน ระบบลื่นไหล และการทำธุรกรรมที่ ไว ผู้เล่นสามารถเริ่มต้นได้ ทันที ฝากถอนสะดวก และเลือกเกมได้ ครบทุกหมวด เหมาะสำหรับ ผู้เล่นทุกสไตล์ ในโลกของเกมสล็อตออนไลน์
สล็อต
แพลตฟอร์ม TKBNEKO มอบมิติใหม่ของเกมออนไลน์ ฝาก-ถอนไว ด้วยระบบสแกน คิวอาร์โค้ด
ในยุคดิจิทัลที่ เทคโนโลยีพัฒนาอย่างรวดเร็ว TKBNEKO พร้อมยกระดับการให้บริการ ด้วยระบบที่ ทันสมัย เสถียร และ โปร่งใส เพื่อให้ผู้เล่น มั่นใจ ทุกครั้งที่ใช้งาน
ระบบการเงินที่ใช้งานง่าย
ฝากขั้นต่ำ: 1 บาท
ถอนขั้นต่ำ: 1 บาท
เวลาฝากเงิน: ใช้เวลาเพียง 3 วินาที
ยอดถอน: ไม่จำกัดต่อวัน
เติมเงินง่าย แค่สแกน
สแกน QR Code ระบบจะ โอนเงินเข้าทันที ขั้นต่ำ 100 บาท สูงสุด ไม่เกิน 500,000 บาทต่อครั้ง
หมวดหมู่เกม
สล็อต: ธีมหลากหลาย
เกมสด: ดีลเลอร์สด
กีฬา: แมตช์ทั่วโลก
ยิงปลา: สนุกได้เงินจริง
โปรโมชั่นและสิทธิพิเศษ
ติดตามหน้า โบนัส พร้อมระบบ VIP และโปรแกรม พันธมิตร
ติดต่อเรา
สอบถามข้อมูลได้ตลอด 24 ชั่วโมง ผ่านหน้า ศูนย์ช่วยเหลือ ทีมงาน ของเรา พร้อมดูแลตลอดเวลา
ทดลองเล่นสล็อต pg ซื้อฟรีสปิน
PG Slot แพลตฟอร์มเกมสล็อตยอดนิยม เล่นง่าย ฝากถอนเร็ว
คำค้นหา PG Slot มาแรงในช่วงนี้ ในกลุ่มผู้เล่นเกมสล็อตออนไลน์ เพราะเป็น ค่ายเกมที่มีชื่อเสียง ด้าน งานภาพคุณภาพสูง ความ ลื่นไหล และ ระบบจ่ายที่ดึงดูด เกมของ PG พัฒนาโดยผู้ให้บริการชั้นนำ ที่รองรับการเล่นทั้งบน มือถือ และ คอมพิวเตอร์
ข้อดี ของ PG Slot
PG Slot เป็นเกมสล็อตออนไลน์ที่ออกแบบมาให้ เปิดเกมได้ทันที เล่นผ่าน ระบบออนไลน์ และรองรับ ทุกแพลตฟอร์ม ไม่ต้องติดตั้งเพิ่มเติม ผู้เล่นสามารถเข้าเล่นผ่าน เว็บเบราว์เซอร์ ได้ทันที ภาพและเสียงถูกพัฒนาในรูปแบบ 3D ให้ความคมชัด พร้อมเอฟเฟกต์ จัดเต็ม
คุณสมบัติหลักของเกม PG Slot ได้แก่
โบนัสและฟรีสปินหลายแบบ
Multiplier
เล่นฟรีก่อนเติมเงิน
รองรับภาษาไทยเต็มรูปแบบ
ฝากถอนง่าย ไม่ต้องรอนาน
แพลตฟอร์ม PG Slot โดยทั่วไปให้บริการ การฝาก-ถอน ออโต้ตลอด 24 ชม. ขั้นต่ำเริ่มต้นเพียง 10 บาท ขึ้นอยู่กับ ระบบของผู้ให้บริการ การทำรายการใช้เวลา รวดเร็วมาก ผ่าน QR Code หรือระบบ ธนาคารบนมือถือ ทำให้ธุรกรรมเป็นไปอย่าง ไม่สะดุด
แนวเกมที่คนเล่นเยอะ ใน pg slot
เกม pg slot มีธีมหลากหลาย เช่น
ธีม เทพเจ้าและแฟนตาซี
ธีม ผจญภัย
ธีม โชคลาภ
ธีม ธรรมชาติ
เกมยอดนิยมมักเป็นเกมที่แตกง่าย พร้อมระบบ Special Feature และ โอกาสทำกำไรสูง เหมาะกับทั้ง ผู้เล่นเริ่มต้น และ ผู้เล่นมือโปร
ความปลอดภัย
PG Slot ใช้ระบบที่ได้มาตรฐาน มีการ รักษาความปลอดภัย และใช้ระบบสุ่มผล ระบบสุ่มมาตรฐาน เพื่อให้ผลลัพธ์ ตรวจสอบได้ แพลตฟอร์มที่ให้บริการ สล็อต PG ควรมี ทีมซัพพอร์ต 24 ชม.
โดยภาพรวม
สล็อต PG เป็นตัวเลือกยอดนิยมสำหรับผู้ที่ต้องการเล่นสล็อตออนไลน์ ด้วยจุดเด่นด้าน โบนัสหลากหลาย และการทำธุรกรรมที่ รวดเร็ว ผู้เล่นสามารถเริ่มต้นได้ ไม่ซับซ้อน ฝากถอนสะดวก และเลือกเกมได้ หลากหลายแนว เหมาะสำหรับ ผู้เล่นทุกสไตล์ ในโลกของเกมสล็อตออนไลน์
https://medium.com/@ratypw/ทดลองเล่นสล็อต-pg-70cdb1132344
ทดลองเล่นสล็อต pg ฟรี สล็อต PG แพลตฟอร์มเกมสล็อตยอดนิยม เข้าเล่นไว ฝากถอนออโต้
คำค้นหา pg slot กำลังได้รับความนิยมอย่างต่อเนื่อง ในกลุ่มผู้เล่นเกมสล็อตออนไลน์ เพราะเป็น ค่ายเกมที่มีชื่อเสียง ด้าน งานภาพคุณภาพสูง ความ ลื่นไหล และ โอกาสรับกำไรที่ดี เกมของ PG พัฒนาโดยผู้ให้บริการชั้นนำ ที่รองรับการเล่นทั้งบน โทรศัพท์มือถือ และ คอมพิวเตอร์
ความโดดเด่น ของ pg slot
สล็อต PG เป็นเกมสล็อตออนไลน์ที่ออกแบบมาให้ เข้าเกมไว เล่นผ่าน ระบบเว็บ และรองรับ ทั้ง iOS และ Android ไม่ต้องติดตั้งเพิ่มเติม ผู้เล่นสามารถเข้าเล่นผ่าน หน้าเว็บ ได้ทันที ภาพและเสียงถูกพัฒนาในรูปแบบ 3D ให้ความคมชัด พร้อมเอฟเฟกต์ จัดเต็ม
คุณสมบัติหลักของเกม PG Slot ได้แก่
โบนัสและฟรีสปินหลายแบบ
ฟีเจอร์ตัวคูณรางวัล
โหมดทดลองเล่นฟรี
มีเมนูภาษาไทย
ฝากถอนง่าย ไม่ต้องรอนาน
แพลตฟอร์ม pg slot ส่วนใหญ่รองรับ การฝาก-ถอน อัตโนมัติ 24 ชั่วโมง ขั้นต่ำเริ่มต้นเพียง หลักหน่วย ขึ้นอยู่กับ ระบบของผู้ให้บริการ การทำรายการใช้เวลา เพียงไม่กี่วินาที ผ่าน QR Code หรือระบบ แอปธนาคาร ทำให้ธุรกรรมเป็นไปอย่าง ต่อเนื่อง
หมวดเกมฮิต ใน PG Slot
เกม pg slot มีธีมหลากหลาย เช่น
ธีม แฟนตาซี
ธีม ลุยด่าน
ธีม ความมั่งคั่ง
ธีม สัตว์และธรรมชาติ
หลายคนชอบเกมที่โบนัสเข้าไว พร้อมระบบ โบนัสรอบพิเศษ และ โอกาสทำกำไรสูง เหมาะกับทั้ง มือใหม่ และ ผู้เล่นมือโปร
มาตรฐานระบบ
pg slot ใช้ระบบที่ได้มาตรฐาน มีการ ปกป้องข้อมูลผู้เล่น และใช้ระบบสุ่มผล ระบบสุ่มมาตรฐาน เพื่อให้ผลลัพธ์ ตรวจสอบได้ แพลตฟอร์มที่ให้บริการ pg slot ควรมี ระบบดูแลข้อมูล
บทสรุปท้ายบท
PG Slot เป็นตัวเลือกยอดนิยมสำหรับผู้ที่ต้องการเล่นสล็อตออนไลน์ ด้วยจุดเด่นด้าน โบนัสหลากหลาย และการทำธุรกรรมที่ ไว ผู้เล่นสามารถเริ่มต้นได้ ไม่ซับซ้อน ฝากถอนสะดวก และเลือกเกมได้ จำนวนมาก เหมาะสำหรับ ทุกระดับประสบการณ์ ในโลกของเกมสล็อตออนไลน์
PG Slot สล็อตยอดฮิต เข้าเล่นไว ฝากถอนออโต้
คำค้นหา pg slot มาแรงในช่วงนี้ ในกลุ่มผู้เล่นเกมสล็อตออนไลน์ เพราะเป็น ค่ายเกมที่มีชื่อเสียง ด้าน งานภาพคุณภาพสูง ความ ลื่นไหล และ อัตราการจ่ายรางวัลที่น่าสนใจ เกมของ PG ออกแบบโดยทีมงานมืออาชีพ ที่รองรับการเล่นทั้งบน สมาร์ทโฟน และ คอมพิวเตอร์
ข้อดี ของ pg slot
PG Slot เป็นเกมสล็อตออนไลน์ที่ออกแบบมาให้ เข้าเกมไว เล่นผ่าน ระบบออนไลน์ และรองรับ ทุกอุปกรณ์ เข้าเล่นผ่านเว็บได้เลย ผู้เล่นสามารถเข้าเล่นผ่าน Browser ได้ทันที ภาพและเสียงถูกพัฒนาในรูปแบบ เอฟเฟกต์ 3 มิติ ให้ความคมชัด พร้อมเอฟเฟกต์ สวยงาม
คุณสมบัติหลักของเกม สล็อต PG ได้แก่
โบนัสและฟรีสปินหลายแบบ
Multiplier
โหมดทดลองเล่นฟรี
รองรับภาษาไทยเต็มรูปแบบ
ระบบการเงินรวดเร็ว ทำรายการไว
แพลตฟอร์ม สล็อต PG มักมี การฝาก-ถอน ออโต้ตลอด 24 ชม. ขั้นต่ำเริ่มต้นเพียง หลักหน่วย ขึ้นอยู่กับ กติกาแต่ละแพลตฟอร์ม การทำรายการใช้เวลา ไม่กี่วินาที ผ่าน QR Code หรือระบบ ธนาคารบนมือถือ ทำให้ธุรกรรมเป็นไปอย่าง ลื่นไหล
ประเภทเกมยอดนิยม ใน PG Slot
เกม PG Slot มีธีมหลากหลาย เช่น
ธีม เทพเจ้าและแฟนตาซี
ธีม ลุยด่าน
ธีม โชคลาภ
ธีม สัตว์และธรรมชาติ
เกมยอดนิยมมักเป็นเกมที่แตกง่าย พร้อมระบบ ฟีเจอร์พิเศษ และ อัตราการจ่ายที่สูง เหมาะกับทั้ง ผู้เล่นเริ่มต้น และ สายสล็อตจริงจัง
ความน่าเชื่อถือ
PG Slot ใช้ระบบที่ได้มาตรฐาน มีการ รักษาความปลอดภัย และใช้ระบบสุ่มผล RNG เพื่อให้ผลลัพธ์ ตรวจสอบได้ แพลตฟอร์มที่ให้บริการ สล็อต PG ควรมี ความปลอดภัยสูง
บทสรุปท้ายบท
pg slot เป็นตัวเลือกยอดนิยมสำหรับผู้ที่ต้องการเล่นสล็อตออนไลน์ ด้วยจุดเด่นด้าน กราฟิกคุณภาพ และการทำธุรกรรมที่ ทันใจ ผู้เล่นสามารถเริ่มต้นได้ ทันที ฝากถอนสะดวก และเลือกเกมได้ จำนวนมาก เหมาะสำหรับ ทั้งมือใหม่และมือโปร ในโลกของเกมสล็อตออนไลน์
ทดลองเล่นสล็อต pg ไม่ เด้ง
pg
แพลตฟอร์ม TKBNEKO พาคุณสู่โลกใหม่ของเกมเดิมพันออนไลน์ ฝาก-ถอนไว ด้วยระบบสแกน QR Code
ในยุคที่ เทคโนโลยีเปลี่ยนวิถีการเดิมพันออนไลน์ไปอย่างสิ้นเชิง TKBNEKO ขอเป็นส่วนหนึ่งในการปฏิวัติวงการเกม ด้วยระบบการให้บริการที่ อัปเดตตลอดเวลา รวดเร็ว และ ชัดเจน พร้อมต้อนรับสมาชิกทุกท่านสู่ โลกแห่งเกมที่เหนือกว่าเดิม ที่ ใครๆ ก็เป็นเถ้าแก่ได้
ทำไมต้อง TKBNEKO?
TKBNEKO มุ่งมั่นที่จะมอบประสบการณ์จากเกมลิขสิทธิ์แท้ โดยเฉพาะเกมที่ มีใบรับรองอย่างถูกต้อง และ เป็นที่นิยมในระดับสากล เพื่อให้ผู้เล่นทุกคน สบายใจ ได้ว่า จะได้รับความเพลิดเพลินกับเกมที่ ยุติธรรม ปลอดภัย และ ตอบโจทย์ผู้เล่นยุคใหม่
ระบบการเงินที่เหนือกว่า
ระบบฝากถอนถูกพัฒนาให้ใช้งานง่าย เพื่อให้คุณ เพลิดเพลินกับการเดิมพันอย่างต่อเนื่อง
ฝากขั้นต่ำ: ขั้นต่ำแค่ 1 บาท
ถอนขั้นต่ำ: เพียง 1 บาท
เวลาฝากเงิน: ใช้เวลาเพียง 3 วินาที
ยอดจำกัดการถอน: ไม่มีลิมิตการถอนรายวัน
ฝากง่าย เพียงสแกน QR Code
เพียงคุณสแกน โค้ดคิวอาร์ ระบบของเราจะ ประมวลผลอย่างรวดเร็ว ขั้นต่ำเพียง 100 บาท และสามารถฝากได้สูงถึง ไม่เกิน 500,000 บาทต่อครั้ง มาร่วมสนุกกันได้แล้ววันนี้ กับ TKBNEKO ที่ ใช้งานง่าย ทำกำไรได้รวดเร็ว
เกมยอดนิยมรวมไว้ในที่เดียว
TKBNEKO รวมเกมสุดฮิตไว้ในที่เดียว รองรับทุกความชอบของผู้เล่น
สล็อต: แจ็คพอตแตกง่าย ลุ้นได้ทุกวัน
เกมสด: ดีลเลอร์ถ่ายทอดสดตลอดเวลา
กีฬา: เดิมพันกับแมตช์การแข่งขันจากทั่วโลก
ยิงปลา: สนุกกับการยิงปลาแบบได้เงิน
รับโบนัสและข้อเสนอสุดคุ้ม
อย่าลืมแวะมาเยี่ยมชมที่หน้า โบนัส เพื่อรับ โบนัสสุดคุ้ม ที่เรามอบให้สมาชิกทุกท่าน นอกจากนี้ยังมีระบบ สมาชิกวีไอพี สำหรับลูกค้าคนสำคัญ และช่องทาง แอฟฟิลิเอต สำหรับผู้ที่สนใจสร้างรายได้ร่วมกับเรา
ติดต่อเรา
หากมี ข้อสงสัย หรือ ความคิดเห็น สามารถติดต่อทีมงานของเราได้ตลอด 24 ชั่วโมงที่หน้า ฝ่ายสนับสนุน และ ส่งความคิดเห็น ทีมงาน TKBNEKO ยินดีให้บริการทุกท่านด้วยใจ
สล็อต
TKBNEKO เปิดประสบการณ์ใหม่แห่งการเดิมพันออนไลน์ ธุรกรรมรวดเร็ว ด้วยระบบสแกน คิวอาร์โค้ด
ในยุคดิจิทัลที่ โลกออนไลน์เติบโตต่อเนื่อง เรามุ่งเน้นมาตรฐานใหม่ของการเดิมพัน ด้วยระบบที่ ล้ำสมัย รวดเร็ว และ โปร่งใส เพื่อให้ผู้เล่น อุ่นใจ ทุกครั้งที่ใช้งาน
ระบบการเงินที่ใช้งานง่าย
ฝากขั้นต่ำ: 1 บาท
ถอนขั้นต่ำ: ขั้นต่ำ 1 บาท
เวลาฝากเงิน: ภายใน 3 วินาที
ยอดถอน: ไม่จำกัดต่อวัน
เติมเงินง่าย แค่สแกน
สแกน คิวอาร์ ระบบจะ ประมวลผลอัตโนมัติ ขั้นต่ำ เริ่ม 100 บาท สูงสุด ไม่เกิน 500,000 บาทต่อครั้ง
เกมยอดนิยม
สล็อต: ธีมหลากหลาย
เกมสด: คาสิโนเรียลไทม์
กีฬา: เดิมพันลีกดัง
ยิงปลา: สนุกได้เงินจริง
โบนัสและโปรโมชัน
ติดตามหน้า โปรโมชั่น พร้อมระบบ VIP และโปรแกรม พันธมิตร
ฝ่ายบริการลูกค้า
สอบถามข้อมูลได้ตลอด 24 ชั่วโมง ผ่านหน้า ติดต่อเรา ทีมงาน ของเรา พร้อมดูแลตลอดเวลา
สล็อต PG เกมสล็อตออนไลน์ที่คนค้นหาเยอะ เข้าเล่นไว ฝากถอนออโต้
คำค้นหา pg slot มาแรงในช่วงนี้ ในกลุ่มผู้เล่นเกมสล็อตออนไลน์ เพราะเป็น แบรนด์เกมที่โดดเด่น ด้าน งานภาพคุณภาพสูง ความ เสถียร และ อัตราการจ่ายรางวัลที่น่าสนใจ เกมของ PG ผลิตโดยค่ายมาตรฐาน ที่รองรับการเล่นทั้งบน โทรศัพท์มือถือ และ พีซี
จุดเด่น ของ สล็อต PG
pg slot เป็นเกมสล็อตออนไลน์ที่ออกแบบมาให้ โหลดเร็ว เล่นผ่าน ระบบออนไลน์ และรองรับ ทุกแพลตฟอร์ม ไม่ต้องดาวน์โหลดแอป ผู้เล่นสามารถเข้าเล่นผ่าน หน้าเว็บ ได้ทันที ภาพและเสียงถูกพัฒนาในรูปแบบ สามมิติ ให้ความคมชัด พร้อมเอฟเฟกต์ สวยงาม
คุณสมบัติหลักของเกม สล็อต PG ได้แก่
มีรอบโบนัสให้ลุ้นบ่อย
ระบบตัวคูณ
เล่นฟรีก่อนเติมเงิน
รองรับภาษาไทยเต็มรูปแบบ
ระบบฝากถอนสะดวก ทำรายการไว
แพลตฟอร์ม สล็อต PG โดยทั่วไปให้บริการ การฝาก-ถอน ฝากถอนตลอดเวลา ขั้นต่ำเริ่มต้นเพียง 1 บาท ขึ้นอยู่กับ เงื่อนไขของเว็บไซต์ การทำรายการใช้เวลา เพียงไม่กี่วินาที ผ่าน คิวอาร์โค้ด หรือระบบ Mobile Banking ทำให้ธุรกรรมเป็นไปอย่าง ลื่นไหล
ประเภทเกมยอดนิยม ใน pg slot
เกม pg slot มีธีมหลากหลาย เช่น
ธีม เทพเจ้าและแฟนตาซี
ธีม Adventure
ธีม ความมั่งคั่ง
ธีม Animal
ผู้เล่นนิยมเกมที่มีรอบพิเศษบ่อย พร้อมระบบ โบนัสรอบพิเศษ และ โอกาสทำกำไรสูง เหมาะกับทั้ง ผู้เล่นเริ่มต้น และ ผู้เล่นมือโปร
ความปลอดภัย
pg slot ใช้ระบบที่ได้มาตรฐาน มีการ ปกป้องข้อมูลผู้เล่น และใช้ระบบสุ่มผล RNG เพื่อให้ผลลัพธ์ โปร่งใส แพลตฟอร์มที่ให้บริการ PG Slot ควรมี ความปลอดภัยสูง
โดยภาพรวม
PG Slot เป็นตัวเลือกยอดนิยมสำหรับผู้ที่ต้องการเล่นสล็อตออนไลน์ ด้วยจุดเด่นด้าน ระบบลื่นไหล และการทำธุรกรรมที่ ทันใจ ผู้เล่นสามารถเริ่มต้นได้ ง่าย ฝากถอนสะดวก และเลือกเกมได้ ครบทุกหมวด เหมาะสำหรับ ทั้งมือใหม่และมือโปร ในโลกของเกมสล็อตออนไลน์
ทดลองเล่นสล็อต pg ซื้อฟรีสปิน
Автозайм
Кредит под залог ПТС в Самаре — представляет собой способ взять деньги под машину без продажи транспорта и без долгих проверок банка. Ключевая особенность автозайма — автомобиль остаётся у владельца у собственника, а в залог оформляется лишь ПТС. Это позволяет использовать транспортом, на протяжении договор займа.
Выдача средств возможна в день подачи заявки. Обращение проверяется около 15 мин, затем выносится ответ по сумме займа и условиям оформления. Сумма займа может достигать до 5 000 000 ?, а ставка начинается от 2% в месяц. Срок кредитования обычно составляет до 60 мес., по этой причине заёмщик может подобрать удобный план платежей.
Система оформления заявки доступна онлайн. Клиент заполняет онлайн-форму, указывает данные автомобиля и желаемую сумму. После анализа документов приходит предварительное одобрение. В большинстве случаев средства выдаются в тот же день, после подписания договор.
Для оценки условий используется калькулятор займа. Например, если взять 300 000 ? на период 12 мес. ежемесячный платёж будет примерно 33 057 ?. Общая переплата по такому займу будет примерно 96 684 ?. Итоговые условия могут изменяться в зависимости от стоимости автомобиля и установленного срока займа.
На сайтах автокредитования часто показывается онлайн-лента заявок. Она демонстрирует активность системы и образцы обработанных заявок по разным городам. К примеру, заявки на сумму 1 840 000 ? из Тулы, 1 890 000 ? город Москва или 1 470 000 ? из Челябинска могут получать метку «Одобрено». Часть заявок находятся на этапе проверки — например, 290 000 ? из Сочи или 720 000 ? город Екатеринбург. Такие блоки отображают текущую активность сервиса и количество обработанных заявок за день и за месяц.
Займ под залог ПТС может подойти тем, кому нужно оперативно получить значительную сумму без продажи машины. Базовые условия таких займов — ставка от 2% в месяц, рассмотрение примерно 15 минут, размер займа до 5 млн ? и возможность подать заявку онлайн. После подачи заявки клиент может дождаться решения, связаться через мессенджер или обратиться к менеджеру для уточнения деталей процедуры.
ทดลองเล่นสล็อต pg ฟรี PG Slot แพลตฟอร์มเกมสล็อตยอดนิยม เข้าเล่นไว ฝากถอนออโต้
คำค้นหา สล็อต PG มาแรงในช่วงนี้ ในกลุ่มผู้เล่นเกมสล็อตออนไลน์ เพราะเป็น ผู้ให้บริการเกมสล็อตที่มาแรง ด้าน ภาพและเอฟเฟกต์ ความ เสถียร และ โอกาสรับกำไรที่ดี เกมของ PG ออกแบบโดยทีมงานมืออาชีพ ที่รองรับการเล่นทั้งบน สมาร์ทโฟน และ พีซี
ความโดดเด่น ของ PG Slot
PG Slot เป็นเกมสล็อตออนไลน์ที่ออกแบบมาให้ เข้าเกมไว เล่นผ่าน ระบบเว็บ และรองรับ ทุกอุปกรณ์ เข้าเล่นผ่านเว็บได้เลย ผู้เล่นสามารถเข้าเล่นผ่าน เว็บเบราว์เซอร์ ได้ทันที ภาพและเสียงถูกพัฒนาในรูปแบบ สามมิติ ให้ความคมชัด พร้อมเอฟเฟกต์ สวยงาม
คุณสมบัติหลักของเกม สล็อต PG ได้แก่
ระบบโบนัสและฟรีสปินหลากหลายรูปแบบ
Multiplier
โหมดทดลองเล่นฟรี
รองรับภาษาไทยเต็มรูปแบบ
ฝากถอนง่าย ไม่ต้องรอนาน
แพลตฟอร์ม สล็อต PG ส่วนใหญ่รองรับ การฝาก-ถอน ออโต้ตลอด 24 ชม. ขั้นต่ำเริ่มต้นเพียง 10 บาท ขึ้นอยู่กับ เงื่อนไขของเว็บไซต์ การทำรายการใช้เวลา รวดเร็วมาก ผ่าน สแกน QR หรือระบบ แอปธนาคาร ทำให้ธุรกรรมเป็นไปอย่าง ต่อเนื่อง
หมวดเกมฮิต ใน pg slot
เกม PG Slot มีธีมหลากหลาย เช่น
ธีม เทพเจ้าและแฟนตาซี
ธีม ลุยด่าน
ธีม ความมั่งคั่ง
ธีม ธรรมชาติ
เกมยอดนิยมมักเป็นเกมที่แตกง่าย พร้อมระบบ โบนัสรอบพิเศษ และ ระบบจ่ายคุ้มค่า เหมาะกับทั้ง คนเพิ่งเล่น และ ผู้เล่นที่มีประสบการณ์
ความน่าเชื่อถือ
สล็อต PG ใช้ระบบที่ได้มาตรฐาน มีการ รักษาความปลอดภัย และใช้ระบบสุ่มผล Random Number Generator เพื่อให้ผลลัพธ์ โปร่งใส แพลตฟอร์มที่ให้บริการ สล็อต PG ควรมี ความปลอดภัยสูง
โดยภาพรวม
pg slot เป็นตัวเลือกยอดนิยมสำหรับผู้ที่ต้องการเล่นสล็อตออนไลน์ ด้วยจุดเด่นด้าน โบนัสหลากหลาย และการทำธุรกรรมที่ ไว ผู้เล่นสามารถเริ่มต้นได้ ง่าย ฝากถอนสะดวก และเลือกเกมได้ ครบทุกหมวด เหมาะสำหรับ ผู้เล่นทุกสไตล์ ในโลกของเกมสล็อตออนไลน์
ทดลองเล่นสล็อต pg ไม่ เด้ง
ทดลองเล่นสล็อต pg เว็บ ตรง”
pg slot แพลตฟอร์มเกมสล็อตยอดนิยม เล่นง่าย ฝากถอนเร็ว
คำค้นหา PG Slot กำลังได้รับความนิยมอย่างต่อเนื่อง ในกลุ่มผู้เล่นเกมสล็อตออนไลน์ เพราะเป็น ผู้ให้บริการเกมสล็อตที่มาแรง ด้าน งานภาพคุณภาพสูง ความ เสถียร และ ระบบจ่ายที่ดึงดูด เกมของ PG ออกแบบโดยทีมงานมืออาชีพ ที่รองรับการเล่นทั้งบน มือถือ และ เดสก์ท็อป
ความโดดเด่น ของ สล็อต PG
pg slot เป็นเกมสล็อตออนไลน์ที่ออกแบบมาให้ เปิดเกมได้ทันที เล่นผ่าน ระบบออนไลน์ และรองรับ ทุกแพลตฟอร์ม เข้าเล่นผ่านเว็บได้เลย ผู้เล่นสามารถเข้าเล่นผ่าน หน้าเว็บ ได้ทันที ภาพและเสียงถูกพัฒนาในรูปแบบ 3D ให้ความคมชัด พร้อมเอฟเฟกต์ สมจริง
คุณสมบัติหลักของเกม PG Slot ได้แก่
มีรอบโบนัสให้ลุ้นบ่อย
ฟีเจอร์ตัวคูณรางวัล
โหมดทดลองเล่นฟรี
มีเมนูภาษาไทย
ระบบการเงินรวดเร็ว ไม่ต้องรอนาน
แพลตฟอร์ม pg slot มักมี การฝาก-ถอน อัตโนมัติ 24 ชั่วโมง ขั้นต่ำเริ่มต้นเพียง หลักหน่วย ขึ้นอยู่กับ ระบบของผู้ให้บริการ การทำรายการใช้เวลา เพียงไม่กี่วินาที ผ่าน คิวอาร์โค้ด หรือระบบ ธนาคารบนมือถือ ทำให้ธุรกรรมเป็นไปอย่าง ลื่นไหล
แนวเกมที่คนเล่นเยอะ ใน PG Slot
เกม pg slot มีธีมหลากหลาย เช่น
ธีม แฟนตาซี
ธีม Adventure
ธีม เอเชียและโชคลาภ
ธีม Animal
ผู้เล่นนิยมเกมที่มีรอบพิเศษบ่อย พร้อมระบบ โบนัสรอบพิเศษ และ อัตราการจ่ายที่สูง เหมาะกับทั้ง ผู้เล่นเริ่มต้น และ ผู้เล่นมือโปร
ความน่าเชื่อถือ
pg slot พัฒนาในระบบสากล มีการ เข้ารหัสข้อมูล และใช้ระบบสุ่มผล Random Number Generator เพื่อให้ผลลัพธ์ โปร่งใส แพลตฟอร์มที่ให้บริการ PG Slot ควรมี ความปลอดภัยสูง
บทสรุปท้ายบท
pg slot เป็นตัวเลือกยอดนิยมสำหรับผู้ที่ต้องการเล่นสล็อตออนไลน์ ด้วยจุดเด่นด้าน ระบบลื่นไหล และการทำธุรกรรมที่ ทันใจ ผู้เล่นสามารถเริ่มต้นได้ ทันที ฝากถอนสะดวก และเลือกเกมได้ ครบทุกหมวด เหมาะสำหรับ ทุกระดับประสบการณ์ ในโลกของเกมสล็อตออนไลน์
ทดลองเล่นสล็อต pg ไม่ เด้ง
ทดลองเล่นสล็อต pg ไม่ เด้ง
melbet казино слоты скачать
Скачать Melbet: Android, iPhone и ПК
Приложение Melbet включает ставки и казино в одном интерфейсе. Пользователю доступны live-ставки, слоты, онлайн-трансляции, аналитика и операции по счёту. Загрузка занимает 1–2 минуты.
Android (APK)
Загрузите APK с официального сайта, запустите установщик и подтвердите установку. При необходимости включите разрешение на установку из неизвестных источников, затем авторизуйтесь.
iOS (iPhone)
Перейдите в App Store, найдите «Melbet», нажмите «Получить», после установки выполните вход.
ПК
Перейдите официальный сайт, авторизуйтесь и добавьте ярлык на рабочий стол. Браузерная версия функционирует как полноценное приложение.
Функционал
Live-ставки с мгновенным обновлением линии, игровой раздел с тысячами игр, прямые трансляции, подробная статистика, push-оповещения, быстрая регистрация и поддержка 24/7.
Бонусы
После загрузки доступны приветственный бонус, акционные коды и фрибеты. Правила начисления определяются регионом.
Безопасность
Загружайте только с официального сайта, проверяйте домен, не сообщайте данные доступа третьим лицам и активируйте двухфакторную аутентификацию.
Загрузка выполняется быстро, после чего открывается полный доступ Melbet.
bidik88
melbet казино слоты скачать на андроид
Скачать приложение Melbet: Android, iPhone и ПК
Мобильная версия Melbet включает букмекерскую контору и казино в едином приложении. Доступны live-ставки, казино-игры, онлайн-трансляции, статистика и операции по счёту. Установка занимает 1–2 минуты.
Android (APK)
Скачайте APK с официального источника, откройте файл и завершите установку. Если требуется включите разрешение на установку из неизвестных источников, затем войдите в аккаунт.
iOS (iPhone)
Откройте App Store, найдите «Melbet», нажмите «Получить», после установки авторизуйтесь в системе.
ПК
Перейдите официальный сайт, авторизуйтесь и добавьте ярлык на рабочий стол. Браузерная версия функционирует как отдельное приложение.
Функционал
Live-ставки с обновлением коэффициентов, казино и слоты, прямые трансляции, аналитические данные, push-оповещения, быстрая регистрация и круглосуточная служба поддержки.
Бонусы
После установки доступны приветственный бонус, промокоды и фрибеты. Правила начисления определяются регионом.
Безопасность
Загружайте только с официальных источников, контролируйте адрес сайта, не передавайте пароль третьим лицам и активируйте двухфакторную аутентификацию.
Установка занимает несколько минут, после чего открывается полный доступ Melbet.
yo dude seriously check out heaps of wins my buddy showed me this thing last week and its actually insane, like the whole vibe is just different man no cap
https://www.fellowshipalliancechurch.com/question/waterless-diffuser/
леонбетс рабочее зеркало на сегодня
игровые автоматы джойказино
Honestly, 777bet beats most others I’ve tried 🙂
рейтинг казино на деньги
hey guys, just wanna say, ipl live 2026 slaps. 10/10 would use again lol
sapporo88 login
yo ngl free rummy card games hits different lowkey fr fr the mechanics are clean tbh and i been playing it way too much imo its just addictive without being annoying lol definitely worth checking out if u like card stuff
sapporo88 login
… [Trackback]
[…] Read More on to that Topic: coinchapter.com/cryptocurrency-prices-today-zil-1inch-ada-hot-matic-vet/ […]