

Key Takeaways:
- Aave DeFi protocol’s native token gained over 50% in a 24-hour rally, only to decline back to $374.
- The AAVE/BTC chart also showed a rapid uptrend.
- The technicals suggest another leg up for the digital asset.
YEREVAN (CoinChapter.com) – AAVE, the native token of the same-named DeFi protocol, rose over 50% on Oct 27, briefly peaking at a five-month high of $478 before dropping back to $374 in the early European session Wednesday. The digital asset now eyes additional gains ahead, thanks to bullish technicals on the weekly charts.
AAVE/USD chart
AAVE surged by over 1,440% between Oct 26, 2020, and Feb 1, 2021. Later, the cryptocurrency entered a sideways consolidation period spanning seven months. During the time, its price action formed a bullish Pennant, best visible on the weekly chart.
In detail, Bullish Pennants appear when the price fluctuates within a range established by two converging trendlines, specifically after a strong upside move. Meanwhile, a Pennant’s bull target is at length equal to the size of the previous uptrend, i.e., flagpole, measured from the breakout level.
Once the formation is exhausted, it promises an uptrend equal to the height of the Pennant. If AAVE complies, it could rally further towards $1,000 by the end of Q4 2021.
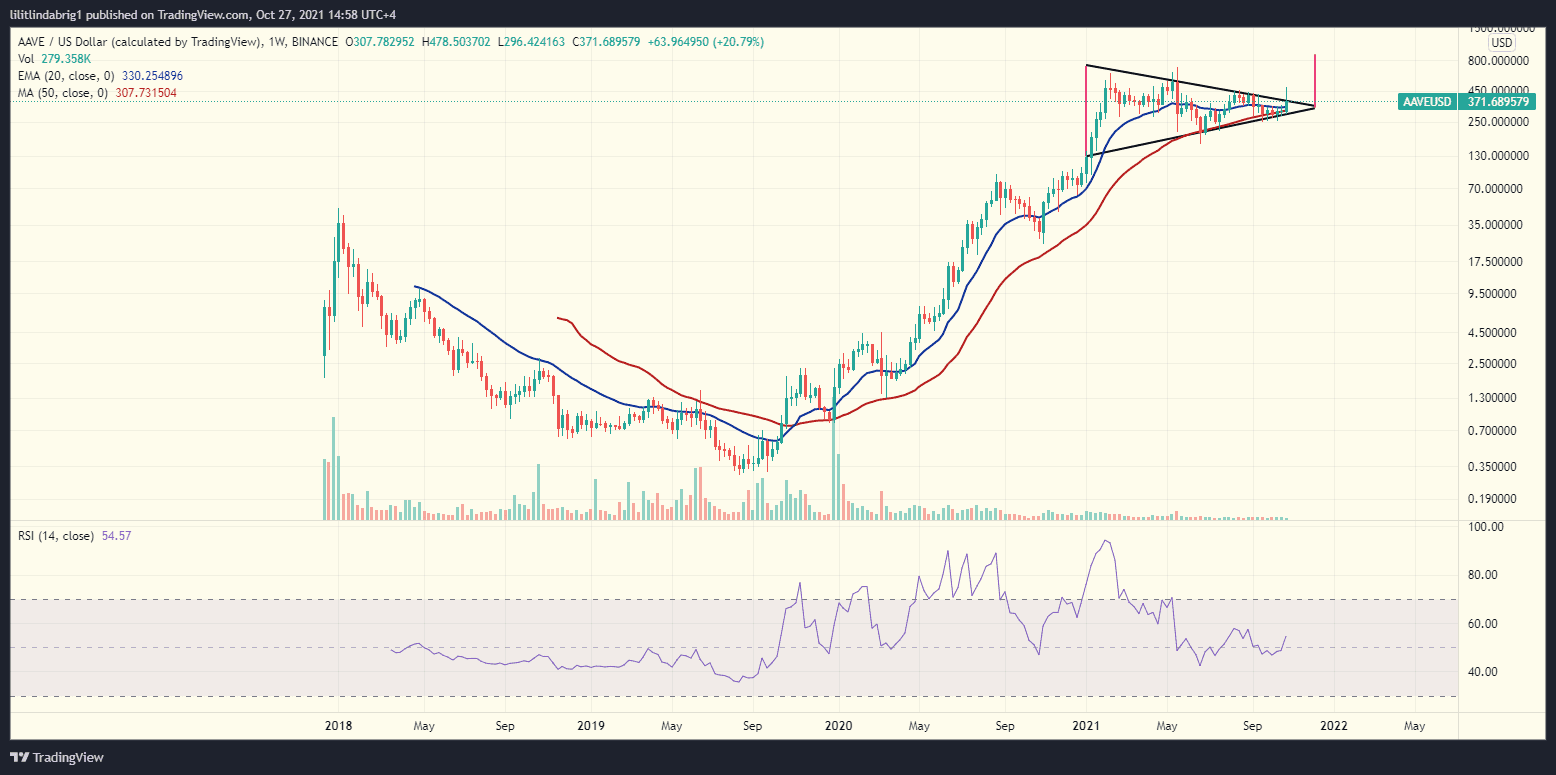
Moreover, the relative strength index (RSI; momentum indicator at the bottom of the graph) recovered to 53 after the Q1 and Q2 declines. In hindsight, the RSI indicates the traders’ confidence in an asset. Thus, when the RSI is between 50 and 70, they might expect further gains and invest, raising the price.
Also read: FTM jumps 16% as Fantom shares Aave launch governance proposalAave also gained value against Bitcoin in a similar pattern, dubbed the Falling Wedge.
AAVE/BTC chart
The Falling Wedge is also bullish, and it predicts gains equal to the highest distance between the trendlines. However, unlike the Pennant, the Falling Wedge drives the price action down for the duration of the pattern.

After a 60% soar (Sep 29-Oct 20), Bitcoin’s cool-off might explain AAVE’s uptrend against BTC. However, the alpha crypto does not offer gains now, and bitcoin price entered a consolidation phase, making way for smaller digital assets. However, the altcoin season is not in action, as many other coins followed the consolidation pattern (ETH lost 5.39% in 24h, XRP shed 8.7%, SOL followed with an 8.5% loss).
Also read: Tesla and Bitcoin are bubbles, says top Wall Street analyst as TSLA and BTC soars to record highs.If the predictions pan out, AAVE could see more gains in the upcoming sessions, possibly doubling in value by the end of the year.

… [Trackback]
[…] Read More to that Topic: coinchapter.com/defi-token-aave-to-hit-1k-this-bullish-formation-says-yay/ […]