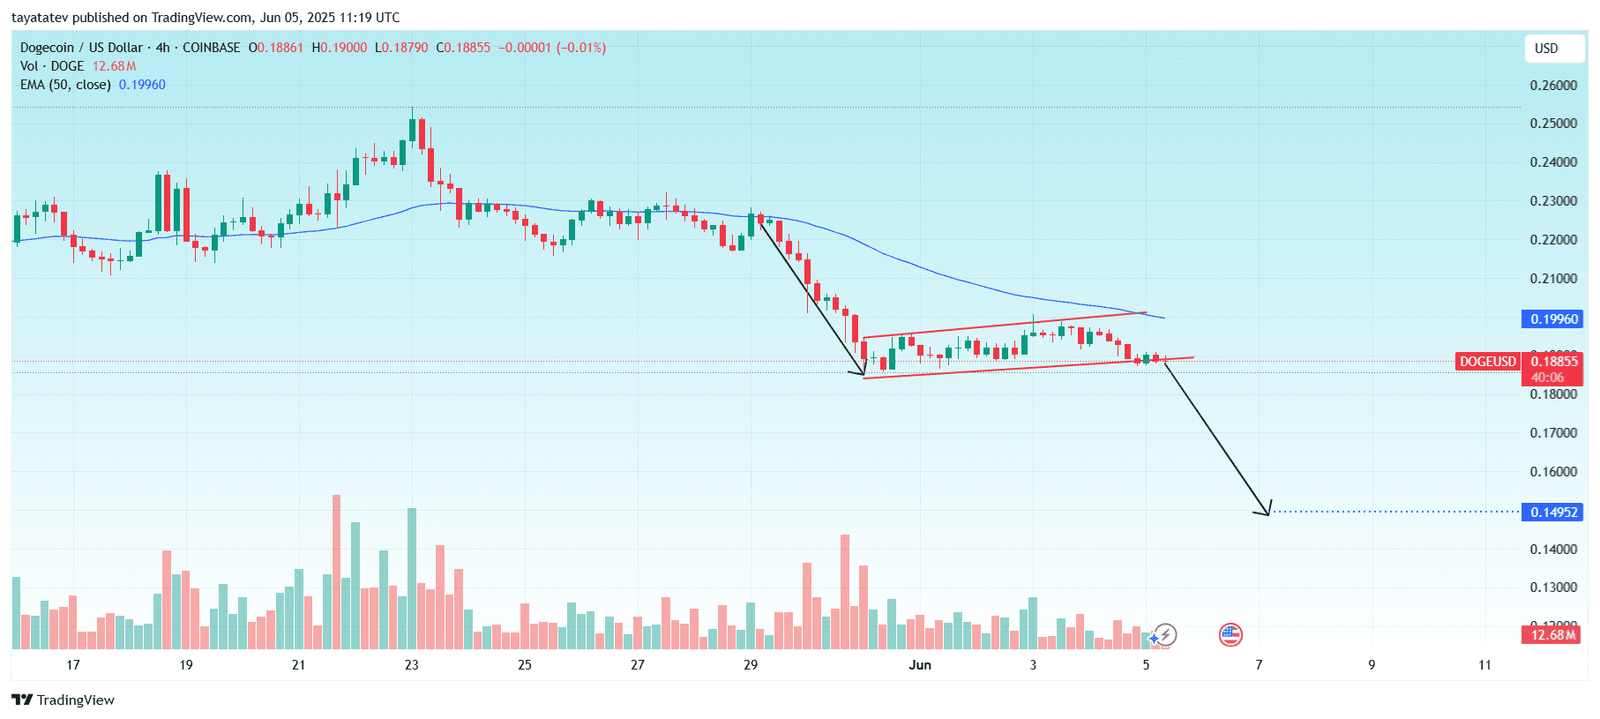
Dogecoin / US Dollar – 4h – COINBASE. Source: TradingView.com
A bearish flag pattern appears after a strong downward move, followed by a short consolidation inside a rising channel, and it typically signals the continuation of the downtrend.
- Advertisement -
If the pattern confirms with a breakdown below the lower boundary, DOGE/USD may fall nearly 20 percent from the current price of $0.18855 to the projected target of approximately $0.14952.
Currently, the price trades below the 50-period Exponential Moving Average (EMA), which is at $0.19960. This moving average acts as dynamic resistance and reinforces bearish momentum. Volume has stayed relatively low during the consolidation phase, which aligns with a textbook bearish flag setup.
As long as DOGE/USD remains under both the EMA and the flag resistance, and volume rises on breakdown, the structure favors continued downside pressure.
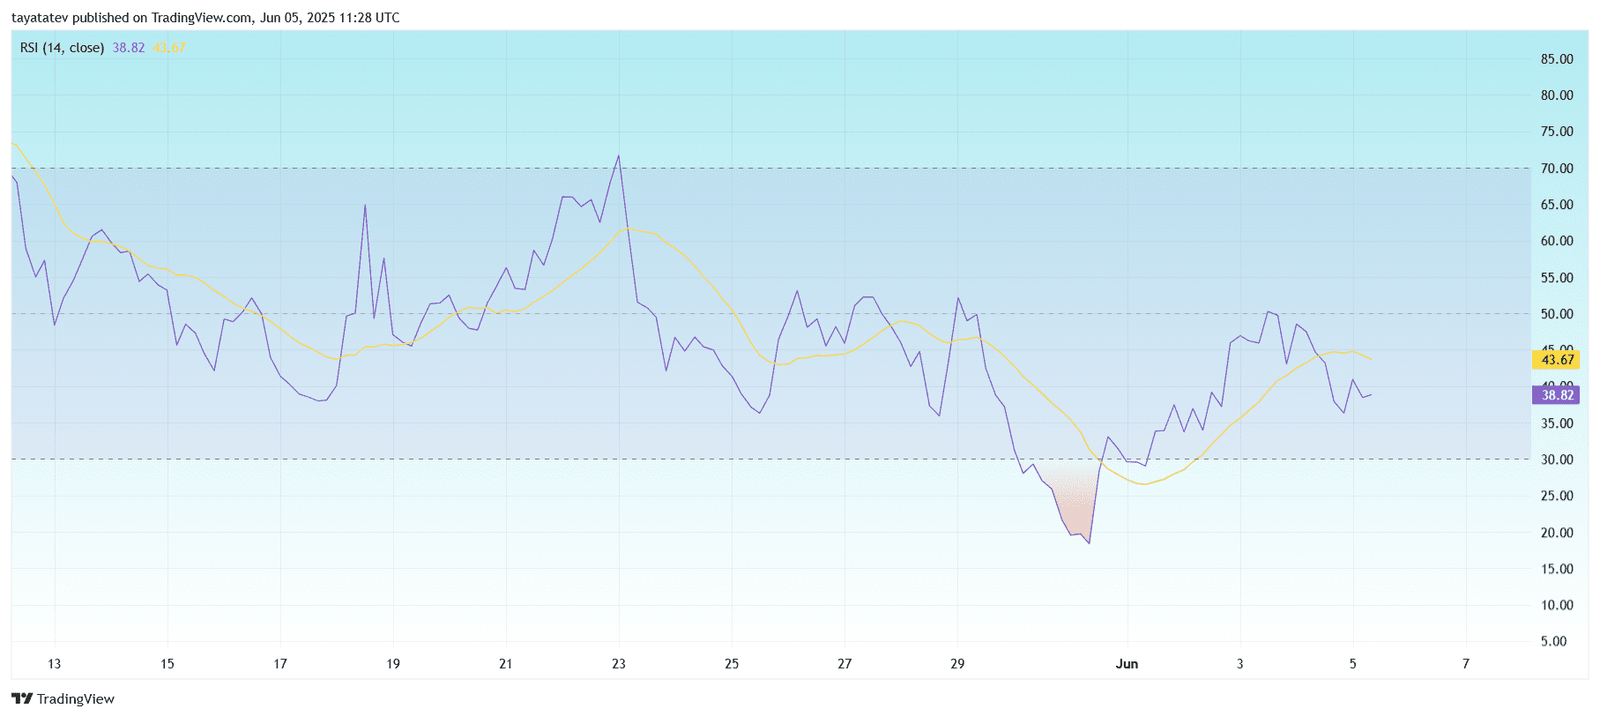
On June 5, 2025, the Relative Strength Index (RSI) for Dogecoin (DOGE/USD) showed a reading of 38.82 on the 4-hour chart, with the 14-period RSI moving average at 43.67.
DOGE/USD RSI (14) – 4h. Source: TradingView.com
The RSI is a momentum oscillator that measures the speed and change of price movements. A reading below 50 signals bearish momentum, while levels below 30 indicate oversold conditions.
Currently, the RSI line trades below its moving average and remains under the neutral 50 level, showing sustained bearish pressure. The bounce from sub-30 levels near June 1 failed to carry momentum above 45, suggesting weak buyer strength.
Additionally, the RSI failed to break above its signal line, which adds further bearish weight. Unless the RSI crosses back above the moving average with strength, downside risk remains elevated.
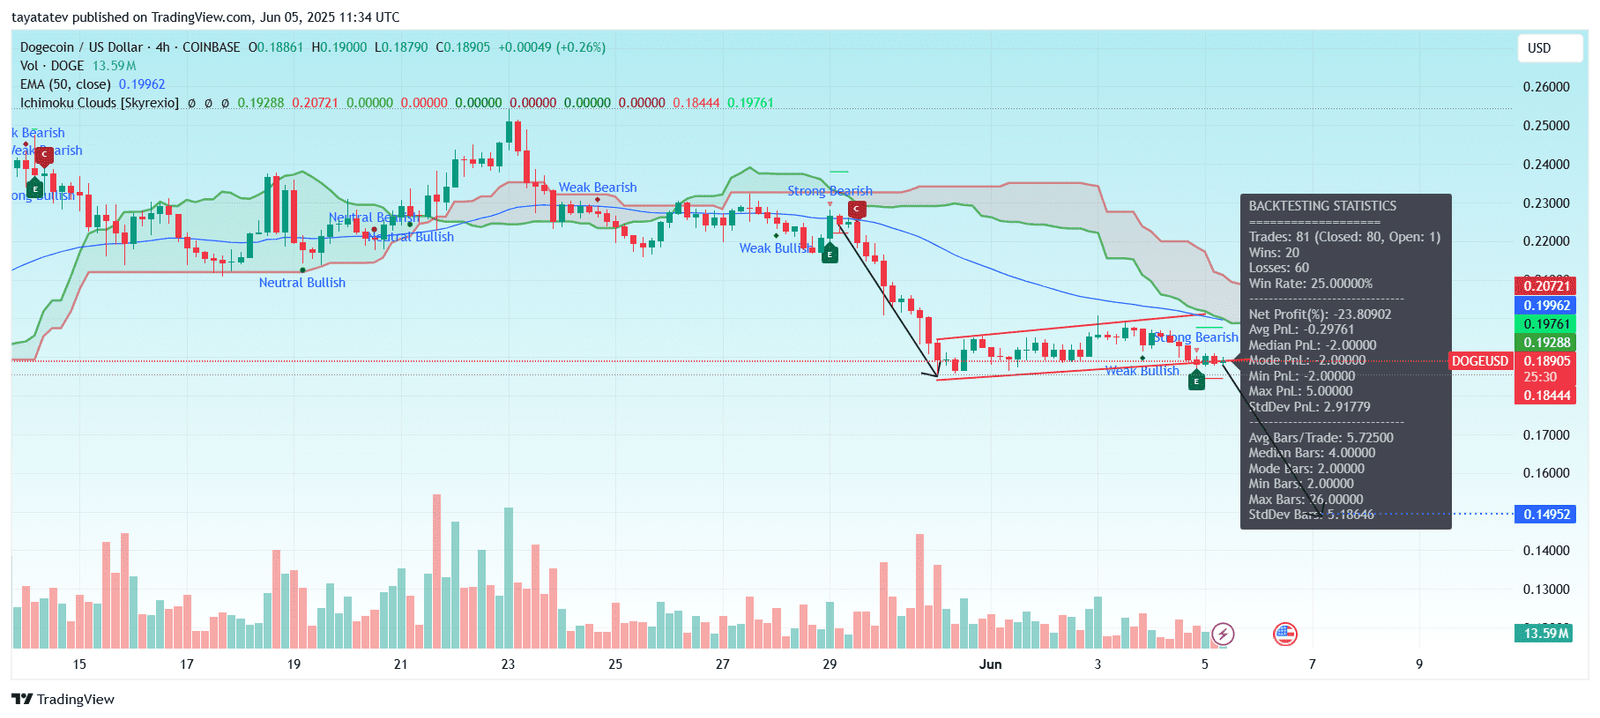
Meanwhile, the Dogecoin to United States Dollar (DOGE/USD) 4-hour chart showed strong bearish signals based on the Ichimoku Cloud system.
DOGE/USD – Ichimoku Cloud and EMA (50) – 4h. Source: TradingView.com
The price traded below the Ichimoku Cloud, indicating a bearish trend. The cloud itself (Kumo) is red and expanding, which signals increasing bearish pressure. The current candle sits under both the cloud and the 50-period Exponential Moving Average (EMA), reinforcing the downward bias.
Moreover, Ichimoku labels like “Strong Bearish” and “Weak Bullish” during the consolidation suggest that bullish momentum lacked follow-through. The Kijun-sen (baseline) and Tenkan-sen (conversion line) are also trending downward, confirming the selling pressure.
The backtesting data panel shows a win rate of just 25%, with a net profit of –23.81%, which supports the bearish outlook on this setup.
Unless DOGE/USD breaks back above the cloud and clears the EMA at $0.19962, bears remain in control.
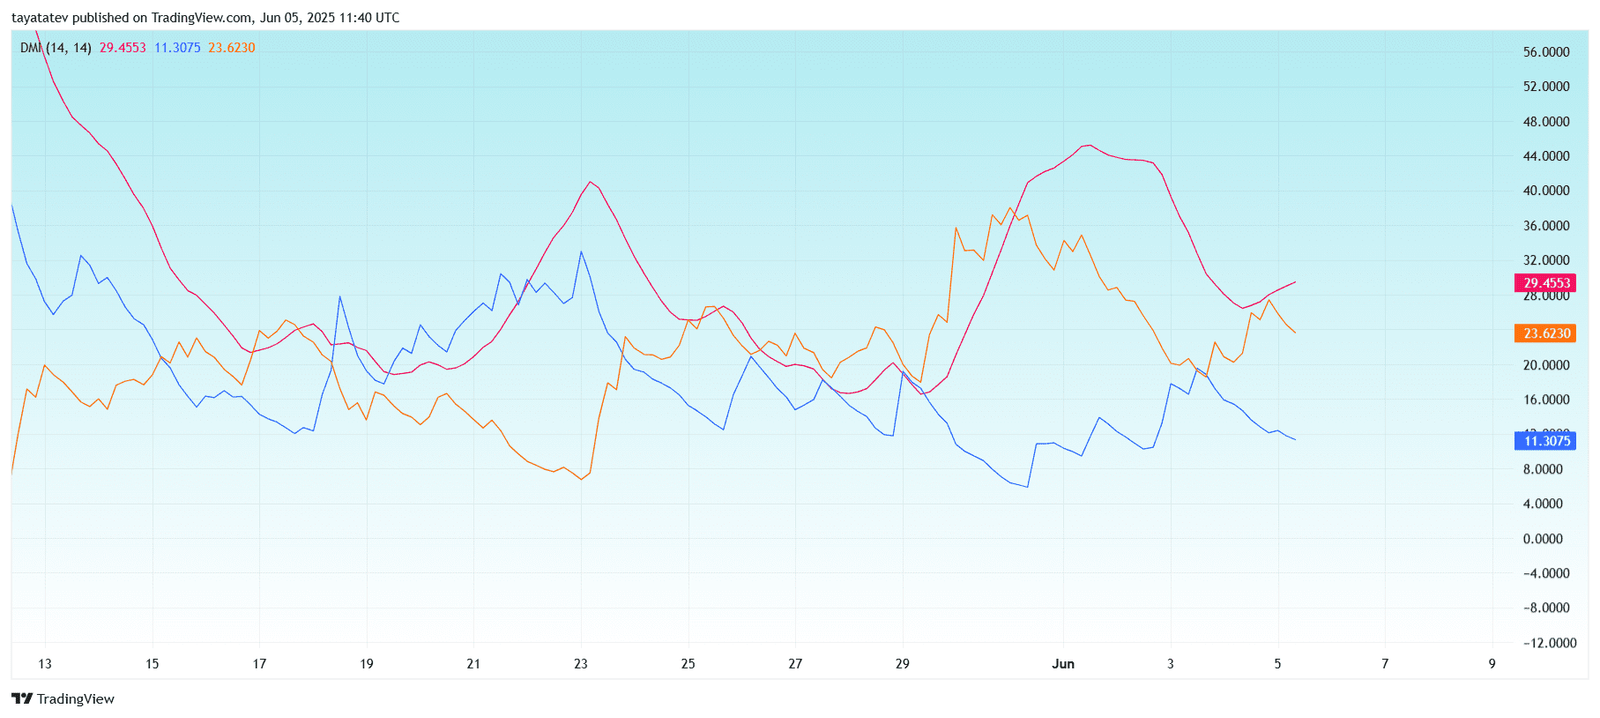
The Negative Directional Indicator (–DI) in red stands at 29.45, which is significantly higher than the Positive Directional Indicator (+DI) in orange at 23.62. The Average Directional Index (ADX) in blue measures trend strength and sits at 11.30, indicating a weak but developing trend.
Since the –DI remains above the +DI, sellers are in control. However, the ADX remains below 20, which shows that the bearish trend is still weak or not fully established yet. If ADX rises above 20 while –DI continues to lead, it would confirm stronger downward momentum.
Previously, the +DI briefly overtook –DI between May 30 and June 2, but the shift failed to sustain. The return of the –DI to dominance, paired with flat ADX, suggests a cautious bearish bias with room to strengthen if momentum picks up.
DOGE/USD MACD Crossover Stalls Near Zero Line, Momentum Weakens
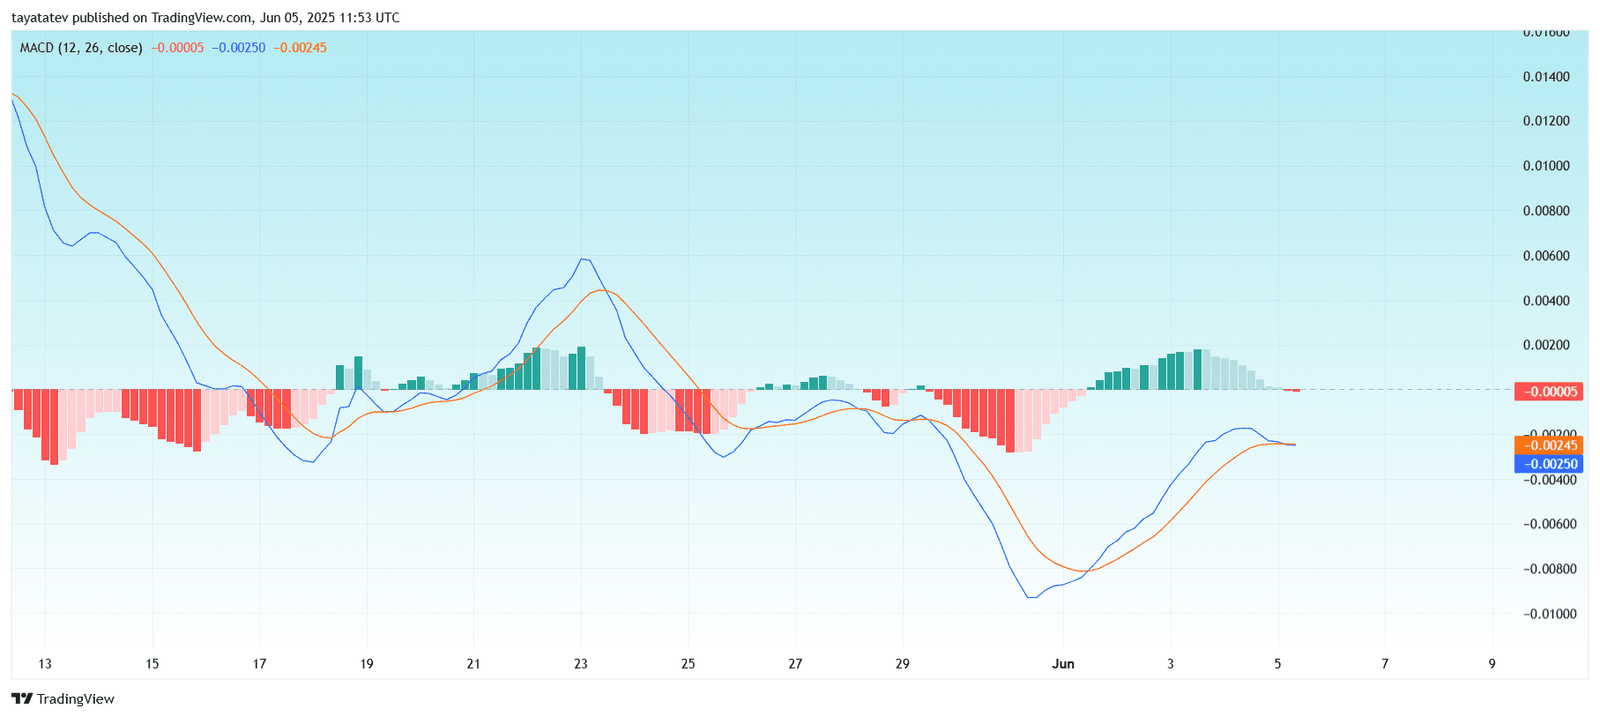
The Moving Average Convergence Divergence (MACD) indicator for Dogecoin (DOGE/USD) on the 4-hour chart showed signs of momentum exhaustion.
The MACD line (blue) stands at –0.00250, just below the signal line (orange) at –0.00245. The slight bearish crossover at the zero line suggests the recent upside may be fading. Additionally, the histogram shows a red bar close to zero (–0.00005), indicating weakening bullish momentum.
Earlier this week, the MACD line crossed above the signal line, generating a short-lived bullish wave visible in the rising green histogram bars. However, the current flattening of both lines and fading histogram bars point to market indecision and potential consolidation.
If the MACD line dips further below the signal line, DOGE/USD may face renewed selling pressure. Conversely, a strong bounce back above the signal line would be needed to restart bullish momentum. As of now, the MACD suggests a neutral to slightly bearish shift.
MEME Coins Inc. Acquires 1 Billion Dogecoin Cash Tokens from Tipestry
June 5, 2025 – Mesquite, NV — MEME Coins Inc., a wholly owned subsidiary of Dogecoin Cash Inc. (OTC: CBDS), has completed the acquisition of 1 billion Dogecoin Cash (DOG) tokens from Tipestry Inc., a social blockchain company. The deal closed on June 4, 2025.
The transaction was finalized through the issuance of 125,000 preferred shares of MEME Coins Inc., a revision from the originally proposed 500,000 shares. On-chain records confirm the token transfer on the Binance Smart Chain, and verification is available at BSCScan.
A CBDS company representative stated, “This marks a major milestone in MEME Coins Inc.’s strategy to secure high-value digital assets as we build out our blockchain-based ecosystem.” The firm emphasized the DOG token’s potential as a utility and community-driven asset.
Following this acquisition, MEME Coins Inc. now holds a total of 1.6 billion DOG tokens. The company underlined its long-term commitment to digital asset value and transparent token management.
Dogecoin Cash Inc. operates PrestoDoctor, a leader in medical cannabis telemedicine. In addition to its blockchain efforts, CBDS holds patents for the cannabis strain Ecuadorian Sativa (also known as “CTA”) and a cannabis lozenge for hypertension treatment. MEME Coins Inc., its blockchain-focused unit, is building a platform centered on meme-based cryptocurrency innovation, token utility, and social crypto applications.
Tatev Avetisyan is a Markets Writer and Analyst at CoinChapter, covering cryptocurrency markets, policy, and regulation. With over seven years of experience in business and marketing development, she has spent the past two years specializing in digital assets and has authored more than 2,000 articles on crypto markets and regulatory developments.She contributes as a guest writer to leading industry publications and is a prominent Web3 advocate in Armenia through Web3Armenia. Her work reflects a broader focus on artificial intelligence and Web3 technologies.
Tatev maintains a diversified crypto portfolio, with Bitcoin as her primary holding above CoinChapter’s $1,000 disclosure threshold.