
Dogecoin (DOGE/USD) Builds Bullish Pressure in Ascending Triangle
On April 29, 2025, Dogecoin (DOGE to US. Dollar) formed an ascending triangle on the 4-hour chart. An ascending triangle is a bullish chart pattern created when price holds a horizontal resistance level while forming higher lows below it.
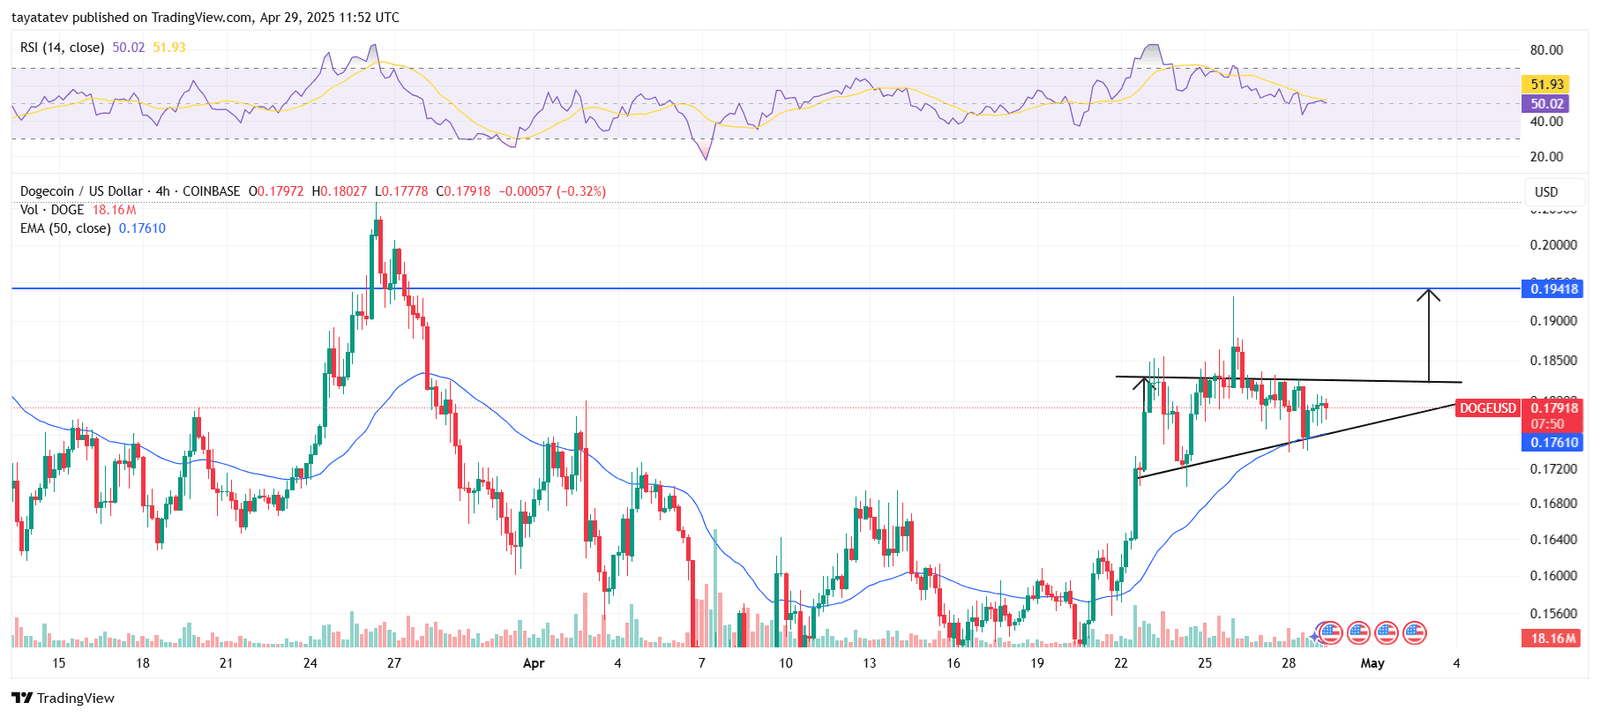
In the chart, Dogecoin trades near $0.179, with horizontal resistance sitting around $0.185. At the same time, the rising trendline from April 22 shows higher lows forming consistently. This setup indicates growing buying pressure and reduced selling strength.
Volume remains steady, and the price is hovering just above the 50-period Exponential Moving Average (EMA), currently at $0.1761. This EMA helps identify short-term trend direction, and in this case, it supports the bullish structure.
The Relative Strength Index (RSI) is now around 51.93, which is slightly above the neutral 50 mark. This suggests there’s room for further upside without being overbought. A breakout would likely push RSI higher, confirming momentum.
If Dogecoin breaks above $0.185, the ascending triangle pattern suggests a measured move of about 7 % , reaching a potential target near $0.194. This target is calculated using the height of the triangle added to the breakout point.
To confirm the breakout, the price must close above $0.185 on strong volume. Until then, the pattern remains valid but unconfirmed.
Dogecoin Eyes $0.20 Breakout as Monthly Chart Holds Ascending Channel Support
On April 29, 2025, analyst Ali Martinez shared a new update on X about Dogecoin’s long-term technical pattern. He pointed out that the coin has followed an ascending channel on its 1-month chart for several years.
To clarify, an ascending channel forms when price moves upward between two rising, parallel trendlines. The upper trendline acts as resistance, while the lower one offers support.
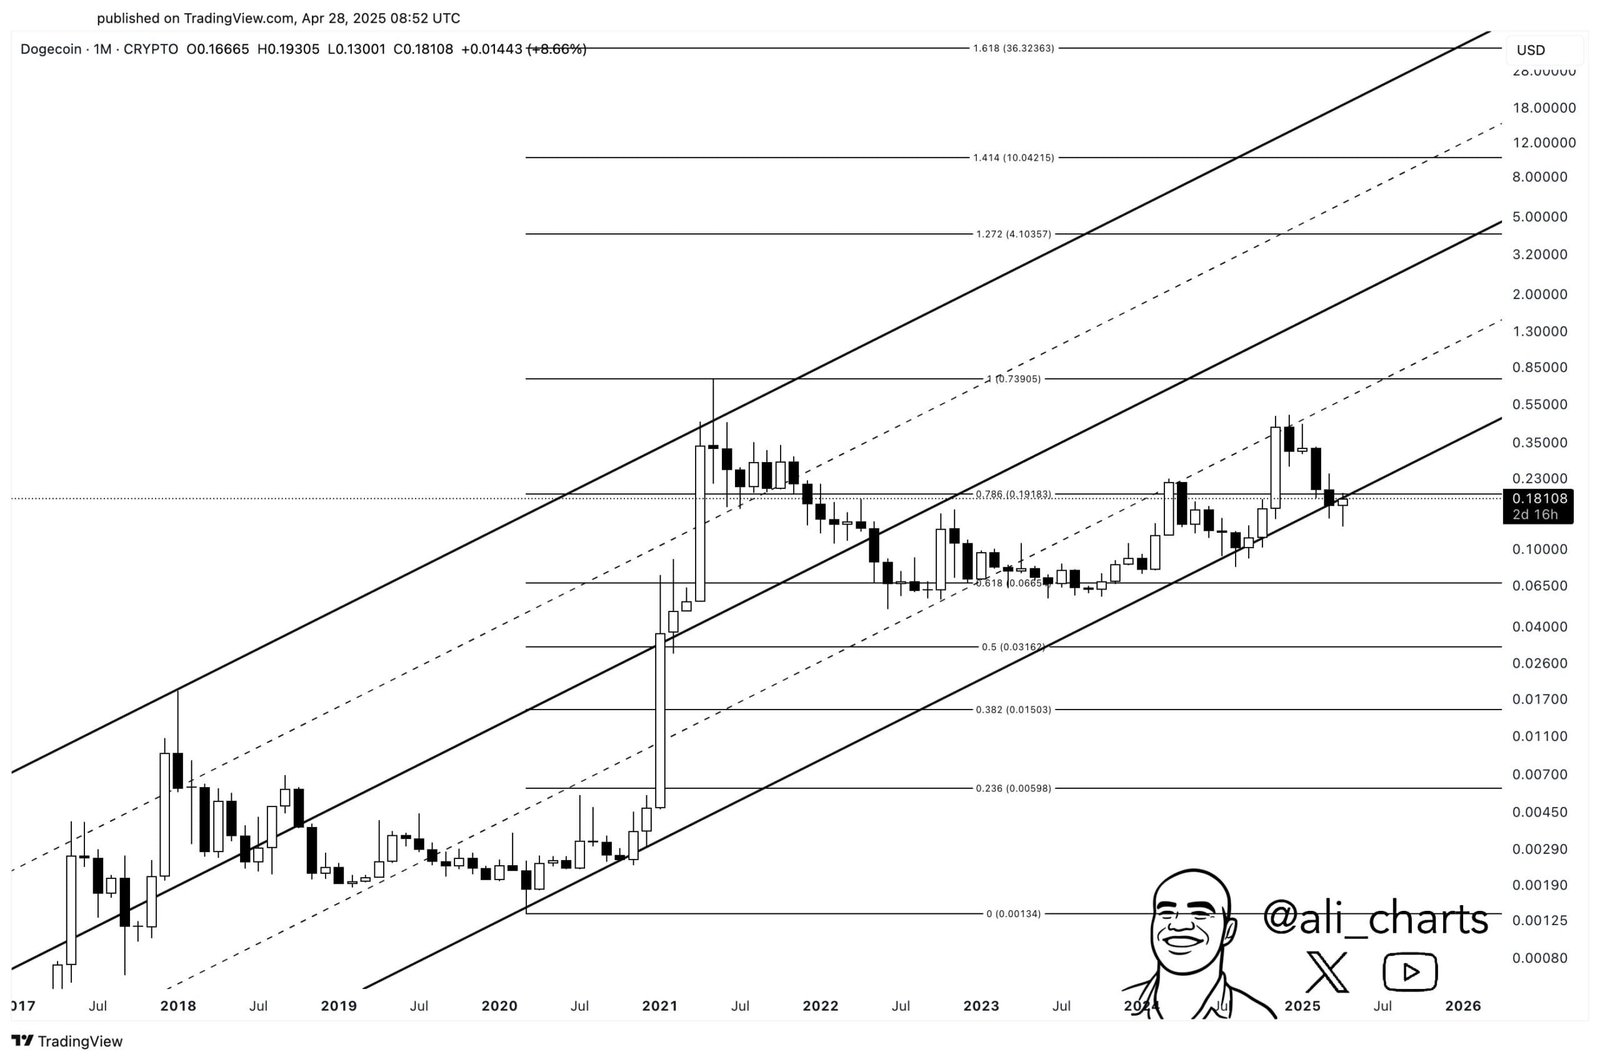
As of now, Dogecoin is testing the lower boundary of this channel. The monthly candle appears to be slipping just under the support. If this move continues and closes below the channel, the structure may break, and bearish momentum could increase.
Meanwhile, Dogecoin is also near a key technical level — the 0.786 Fibonacci retracement, which sits close to $0.20. Fibonacci retracement levels are horizontal markers used to identify areas where price might pause or reverse. These levels come from ratios in the Fibonacci sequence.
In this case, the next major Fibonacci line is the 1.000 level, which matches Dogecoin’s all-time high of around $0.74. If the price manages to close the month above $0.20, it would reclaim both the channel and the Fibonacci line.
According to Martinez, such a close could trigger a new wave of bullish momentum. It may also attract investor interest, as it would confirm strength on the monthly timeframe.
The next few days remain critical. A bounce above $0.20 could reopen the path toward the channel’s upper boundary — and possibly the previous high near $0.74.
