
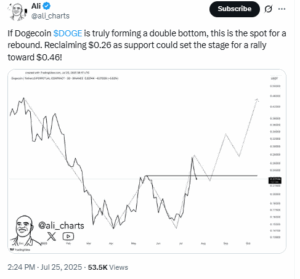
Dogecoin (DOGE) may be preparing for a breakout, according to market analyst Ali Martinez (@ali_charts). He noted that the token is forming a double bottom pattern, with $0.26 identified as the key support level. If reclaimed, he believes the move could extend to $0.46. On‑chain data shows whales have accumulated 130 million DOGE in the past 24 hours, adding weight to his bullish outlook.
Analyst Flags Double Bottom Setup on DOGE Chart
Martinez explained that Dogecoin’s price structure shows signs of a double bottom pattern. This formation occurs when an asset touches the same low twice before rebounding, often signaling the end of a downtrend. He pointed to $0.26 as the decisive level. If Dogecoin climbs above it and holds, the pattern would be confirmed. Martinez projected that the next leg higher could extend to $0.46, representing nearly a 90% gain from current prices near $0.23. Without a successful reclaim of $0.26, however, the setup would remain unconfirmed, leaving the token vulnerable to further declines.
The analyst also shared on‑chain data that shows whales purchased 130 million DOGE in the last 24 hours. Whales, investors with large holdings, are often seen as influential players in the market. Instead of selling during the dip, they added to their positions, signaling confidence in a potential rebound.

Dogecoin’s circulating supply is about 150 billion coins, meaning this purchase represents a small share of the total supply. However, the buying was concentrated among large wallets, reinforcing the analyst’s view that institutional‑sized investors expect higher prices ahead.
Technical Indicators Point to Neutral Momentum
On the 4‑hour chart, Dogecoin trades around $0.229, holding just below the $0.26 resistance zone. The Relative Strength Index (RSI) is hovering between 43 and 45, which places it in neutral territory. Values below 30 indicate an asset may be oversold, while those above 70 suggest overbought conditions. A reading near the middle shows DOGE has room to move in either direction.
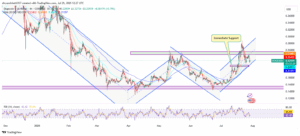
Moving averages on the 20‑, 50‑, 100‑ and 200‑period scales are clustering close to the current price. This alignment reflects indecision in the market. A clear move above the shorter‑term averages could provide the strength needed to challenge $0.26 again.
The MACD indicator, which tracks momentum, is flattening after recent gains. It has yet to show a convincing crossover into positive territory, which would normally confirm stronger buying momentum. The Stochastic Oscillator, currently around 26, leans toward oversold territory. This suggests DOGE could attract buyers if market sentiment improves, though confirmation is still needed.
Trading volume remains lighter compared to earlier surges this month. For a breakout above $0.26 to hold, analysts typically look for volume expansion, which would confirm broader participation from traders and investors.
On‑Chain Data For Dogecoin Reveals Reduced Selling Pressure
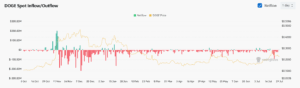
Beyond chart signals, on‑chain data adds context to Martinez’s outlook. Dogecoin’s Market Value to Realized Value ratio, or MVRV, stands near 51 percent. This indicates holders are on average sitting on profits, but not at levels that typically spark mass profit‑taking. Exchange data shows a steady pattern of net outflows, meaning more DOGE is being moved into private wallets than onto exchanges. This trend often signals reduced selling pressure.
Network activity shows around 1.8 million active addresses over the past 30 days, suggesting continued usage. Daily activity, however, is lower than during peak cycles, hinting at weaker participation from retail traders. Funding rates for DOGE futures are close to neutral, showing that leveraged traders are neither heavily long nor short. Finally, Dogecoin’s correlation with Bitcoin remains high at 0.82, which means the broader trend of Bitcoin is likely to influence DOGE’s direction in the near term.

An Extended Decline Possible if $0.26 Fails
While Martinez remains optimistic, the bullish scenario depends entirely on Dogecoin reclaiming and holding $0.26. If it fails, the next support zones lie near $0.21 and $0.20, levels where buyers have previously stepped in. A breakdown below those marks could invalidate the double bottom pattern and extend the decline.
Historically, Dogecoin has shown mixed results with double bottom patterns. A confirmed setup in mid‑2021 preceded a sharp rally, while an unconfirmed attempt in 2022 failed, leading to deeper losses at the time.
