

NAIROBI (Coinchapter.com) – The U.S. Dollar Index (DXY) is currently trading around 106.19, showcasing a breakout from a potential giant diamond bottom formation. This technical pattern suggests a strong bullish sentiment surrounding the greenback, as the index continues to maintain its upward momentum.
First-quarter growth figures for the US economy suggest a resilient trajectory, with rising consumer spending rooted in solid labor demand. The Federal Reserve, encouraged by continued growth and sustained inflation, signals a shift. The anticipated ease in policy rates seems to be on hold, reflecting a bias towards maintaining the current stance longer than previously thought.
Retail Sales Soar, Reflecting Economic Momentum
In March 2024, U.S. retail sales increased by 0.7% month-over-month, eclipsing the 0.3% forecast and signaling continued consumer confidence. This follows February’s revised rise of 0.9%. The data, showcasing strength in eight out of thirteen categories, suggests a sustained momentum in consumer spending.
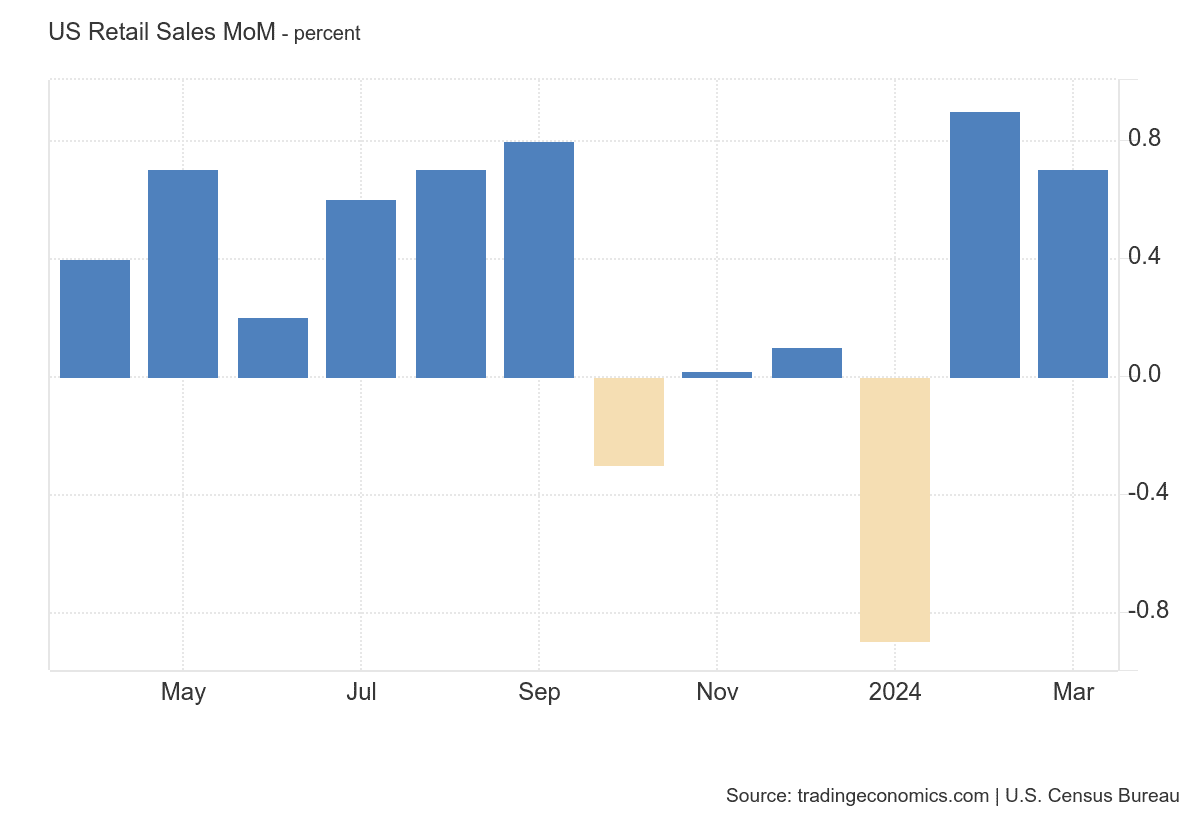
Major increases were seen in sales at nonstore retailers (2.7%), gasoline stations (2.1%), miscellaneous store retailers (2.1%), and building materials and garden equipment (0.7%). Gains were also recorded at food and beverages stores (0.5%), health and personal care stores (0.4%), and food services and drinking places (0.4%). On the other hand, sales were down for sporting goods, hobby, musical instrument, & book stores (-1.8%), clothing (-1.6%), electronics and appliances (-1.2%), general merchandise stores (-1.1%), autos (-0.9%) and furniture (-0.3%).
Core retail sales unexpectedly jumped 1.1%, signaling strong consumer confidence despite economic worries. This outpaces January’s growth and could boost GDP forecasts. Even without volatile sectors, sales grew 1%, indicating a resilient market.
DXY Technical Point to Overbought Conditions
The US Dollar Index (DXY) presents an intriguing picture for technical analysts as it approaches a critical resistance zone. On the weekly timeframe, a diamond bottom pattern appears to be forming, a technical formation that can often signal a trend reversal to the upside.
The U.S. Dollar Index (DXY) is currently trading around 106.19, showcasing a breakout from a potential giant diamond bottom formation. This technical pattern suggests a strong bullish sentiment surrounding the greenback as the index continues to maintain its upward momentum.
The Relative Strength Index (RSI) on the daily chart indicates overbought conditions for DXY, suggesting recent strong buying activity. This trend may lead to a correction if buyers lose momentum. Concurrently, the Moving Average Convergence Divergence (MACD) shows increasing green bars, affirming strong buyer momentum. This pattern often precedes continued upward movement, yet it warrants caution for potential pullbacks.

… [Trackback]
[…] Here you can find 81366 additional Information to that Topic: coinchapter.com/dxy-breaks-out-of-diamond-bottom-signals-bullish-momentum/ […]
… [Trackback]
[…] Here you can find 16723 more Info on that Topic: coinchapter.com/dxy-breaks-out-of-diamond-bottom-signals-bullish-momentum/ […]
… [Trackback]
[…] Find More to that Topic: coinchapter.com/dxy-breaks-out-of-diamond-bottom-signals-bullish-momentum/ […]