

Ethereum’s ETH started a fresh surge above 0.065BTC. It is now correcting gains and trading above a major support at 0.0740BTC.
Ethereum (ETH) Price Outpaces Bitcoin
In the last ethereum vs bitcoin analysis, we discussed a possible sharp increase above the 0.065BTC. ETH/BTC did gain bullish momentum above 0.065 level.
The price jumped above the 0.070 and 0.072 resistance levels. It opened the doors for a move towards the 0.080 resistance zone. The price traded to a new multi-week high at 0.0816 and settled nicely above the 50-day simple moving average (blue).
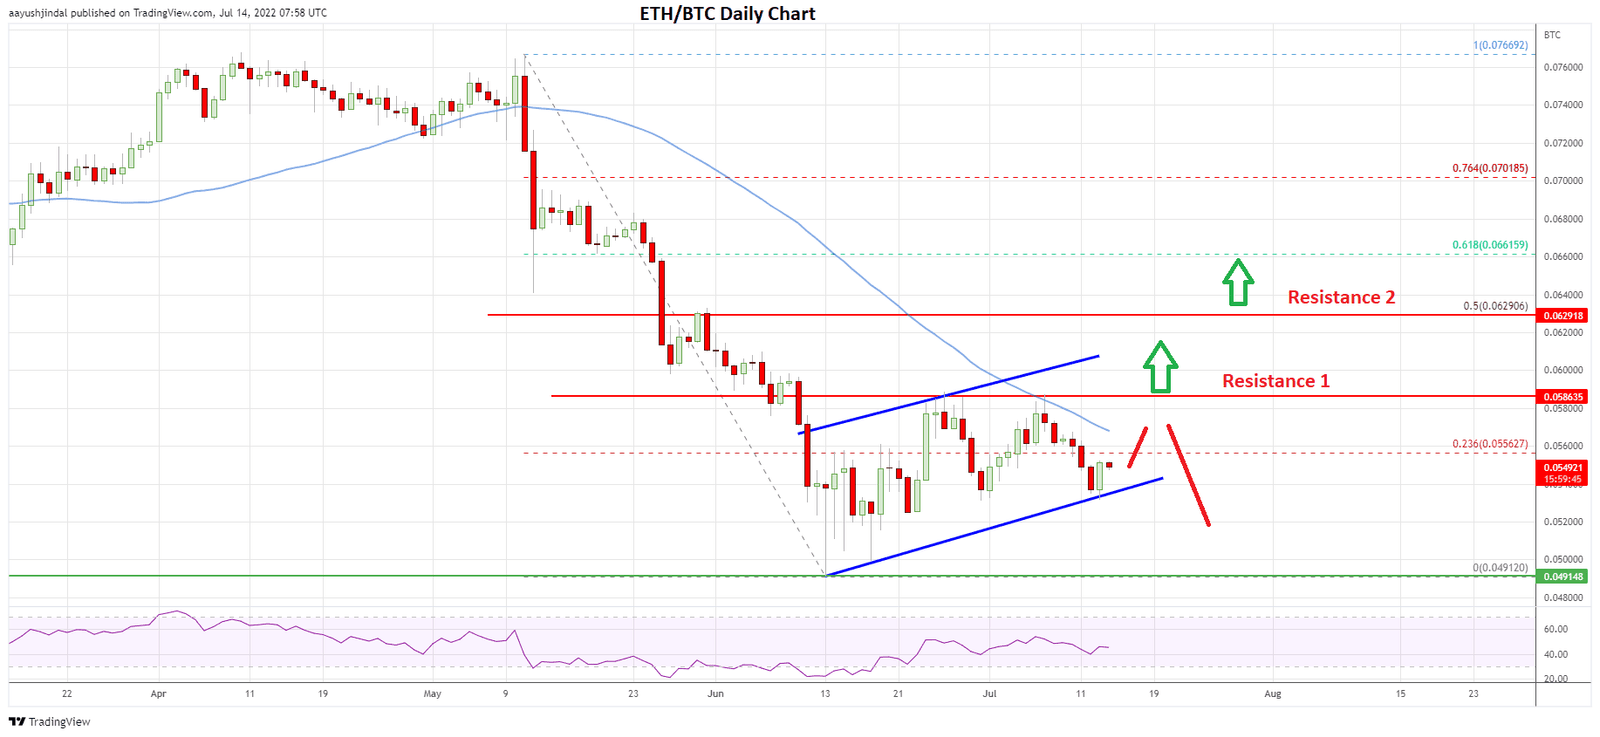
Etheruem’s daily price chart | Source: ETHBTC on TradingView.comRecently, there was a downside correction from the 0.0816 high. The price traded below the 0.0800 and 0.078 support levels. However, it found support near the 0.0740 zone.
There is also a major bullish trend line in place with support at 0.0740BTC on the daily chart. The trend line is near the 23.6% Fib retracement level of the upward move from the 0.0491 swing low to 0.0816 high.
Ether is now consolidating gains above 0.0740 vs bitcoin. On the upside, ETH is facing resistance the 0.0766 level. A clear move above the 0.0766 resistance could send the price towards the 0.0800 resistance.
The next major resistance is near the 0.0816 high, above which the price could rise to 0.0835. Any more gains might open the doors for a move towards the 0.085 resistance.
If there is a downside correction, the price might find support near the 0.0725 level. The next major support is near 0.0700 or the 50-day simple moving average (blue). A downside break below the 0.0700 level might send the price towards 0.065.
The 50% Fib retracement level of the upward move from the 0.0491 swing low to 0.0816 high is also near the 0.0650 zone. Any more losses may perhaps send the price to 0.0600.
Overall, ether price rally could continue higher if it stays above the 0.0720 support zone. In the stated case, the bulls might aim a move towards the 0.085 level in the coming days. Conversely, there might be a downside correction towards 0.0650 or even 0.0600.

… [Trackback]
[…] Read More here on that Topic: coinchapter.com/eth-btc-ethereum-holds-key-support-vs-bitcoin-can-it-rally-again/ […]
… [Trackback]
[…] Find More on to that Topic: coinchapter.com/eth-btc-ethereum-holds-key-support-vs-bitcoin-can-it-rally-again/ […]
… [Trackback]
[…] Read More to that Topic: coinchapter.com/eth-btc-ethereum-holds-key-support-vs-bitcoin-can-it-rally-again/ […]