
Key Takeaways:
- Ethereum price started consolidating after an 11-day downtrend.
- ETH investment products attracted $6.6 million in inflows.
- A technical indicator flashed a buy signal for Ether.

NEW DELHI (CoinChapter.com) — Ethereum (ETH) price has started consolidating after an 11-day-long downtrend that saw Ether’s price drop by more than 8% from July 14’s high of $2,028.
However, investor sentiment for the prime altcoin, which has been poor for ETH in 2023, is slowly improving. Coinshares’ Digital Asset Fund Flows Report noted that Ethereum was the center of investors’ attention in the week beginning July 17.
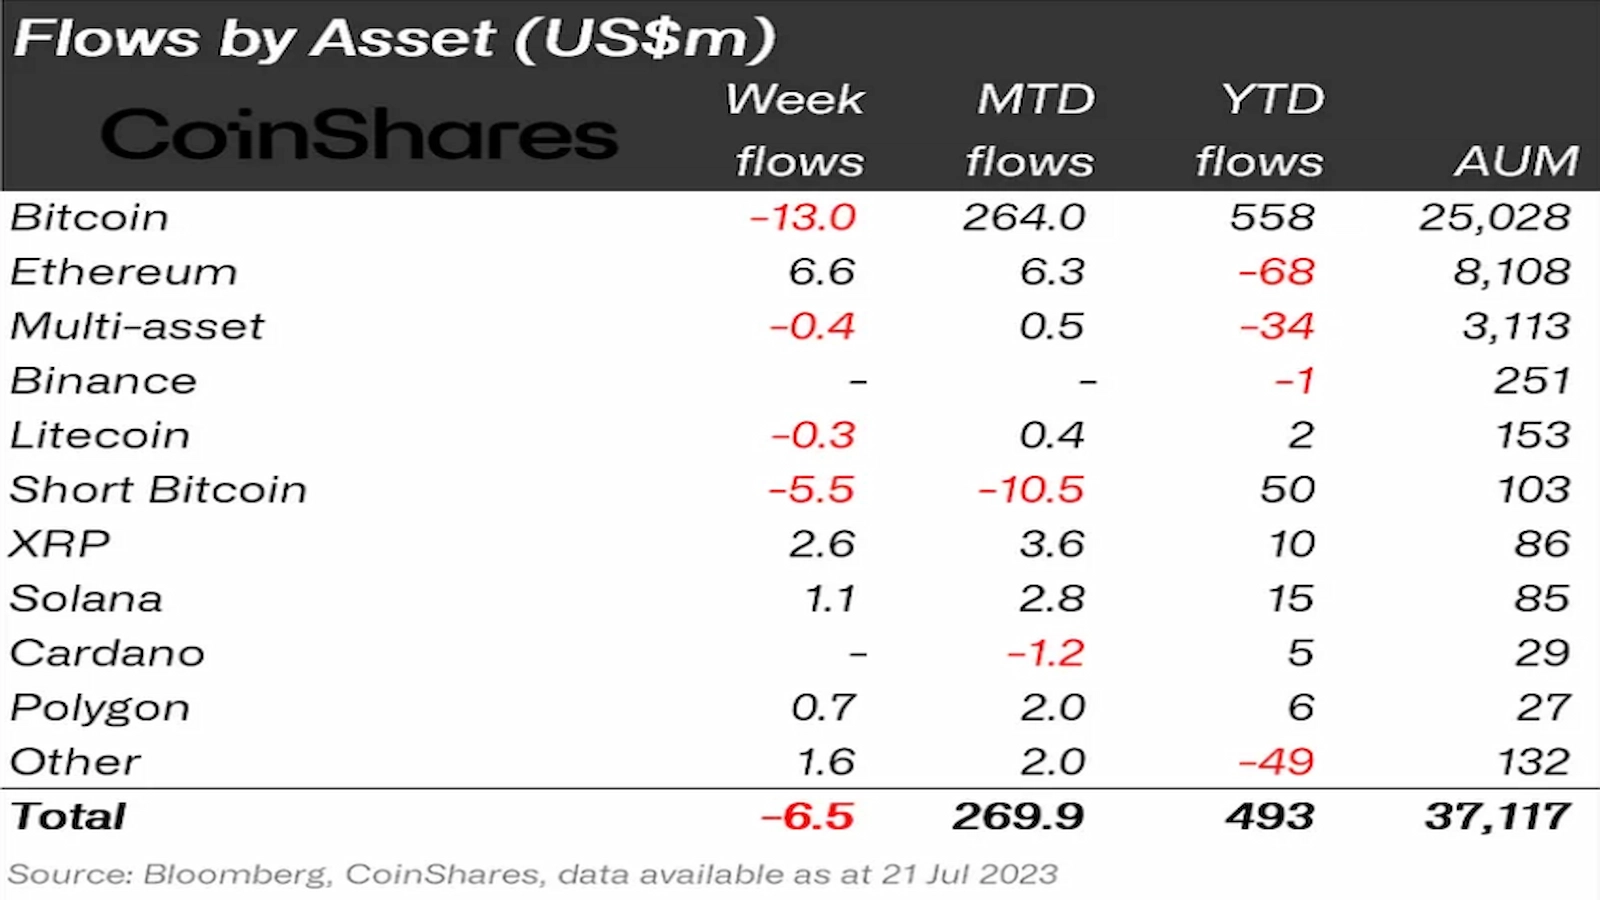
ETH investment products topped the table with $6.6 million in inflows, followed by XRP investment products with $2.6 million. On the other hand, Bitcoin investment products saw outflows of $13 million, while short Bitcoin investment products outflows continued for the 13th consecutive week.
Moreover, a technical indicator called the Tom Demark Sequential, or TD 9, has flashed a bullish signal for the Ethereum token. The core function of the indicator is to find the inflection point of the current asset price trend to improve a trader’s success rate.
Joe McCann, the founder of Asymmetric, noted that the TD 9 indicator was flashing a buy signal for ETH.

Historically, the indicator has a “rather high win rate” for the ETH/USD trading pair, nearly 78%, with an “average 7-day forward return of +2.65%.”
Moreover, McCann noted that from 2019, the success rate spikes to 90%, with an average return of over 7%. The indicator could attract buyers to the market.
ETH Price Forms Bullish Technical Pattern
Another bullish cue for the Ethereum token comes from ETH price forming a bullish technical pattern called the ‘Ascending Triangle.‘
A horizontal trendline that connects swing highs and an ascending trendline connecting swing lows forms an ascending triangle pattern. Volume helps determine if a breakout is strong.

Under ideal conditions, buyers would enter the market as the trendlines close the gap. As a result, the toke’s price would push above the horizontal resistance with heavy volumes. Unfortunately, a low-volume breakout on the upside will likely fail, resulting in a pullback.
Per the rules of technical analysis, the price target for a breakout is equal to the triangle’s height at its thickest point. If the triangle pattern pans out, ETH price could look at a price target near $3,130, a jump of over 68% from current levels.
ETH Price Struggles To Break Above EMA Resistance
Meanwhile, ETH bulls arrested the token’s downtrend on July 25. However, the bearish pressure against the token remained very high, evident from the long upper wicks on recent ETH price daily candles. Ether price registered a minuscule 0.9% to a daily high near $1,867 on July 26.
Bears have aggressively defended the 20-day EMA (red wave) resistance near $1,890. However, if the ETH price breaks above the immediate resistance, the prime altcoin might target the resistance near $1,970 before correcting.
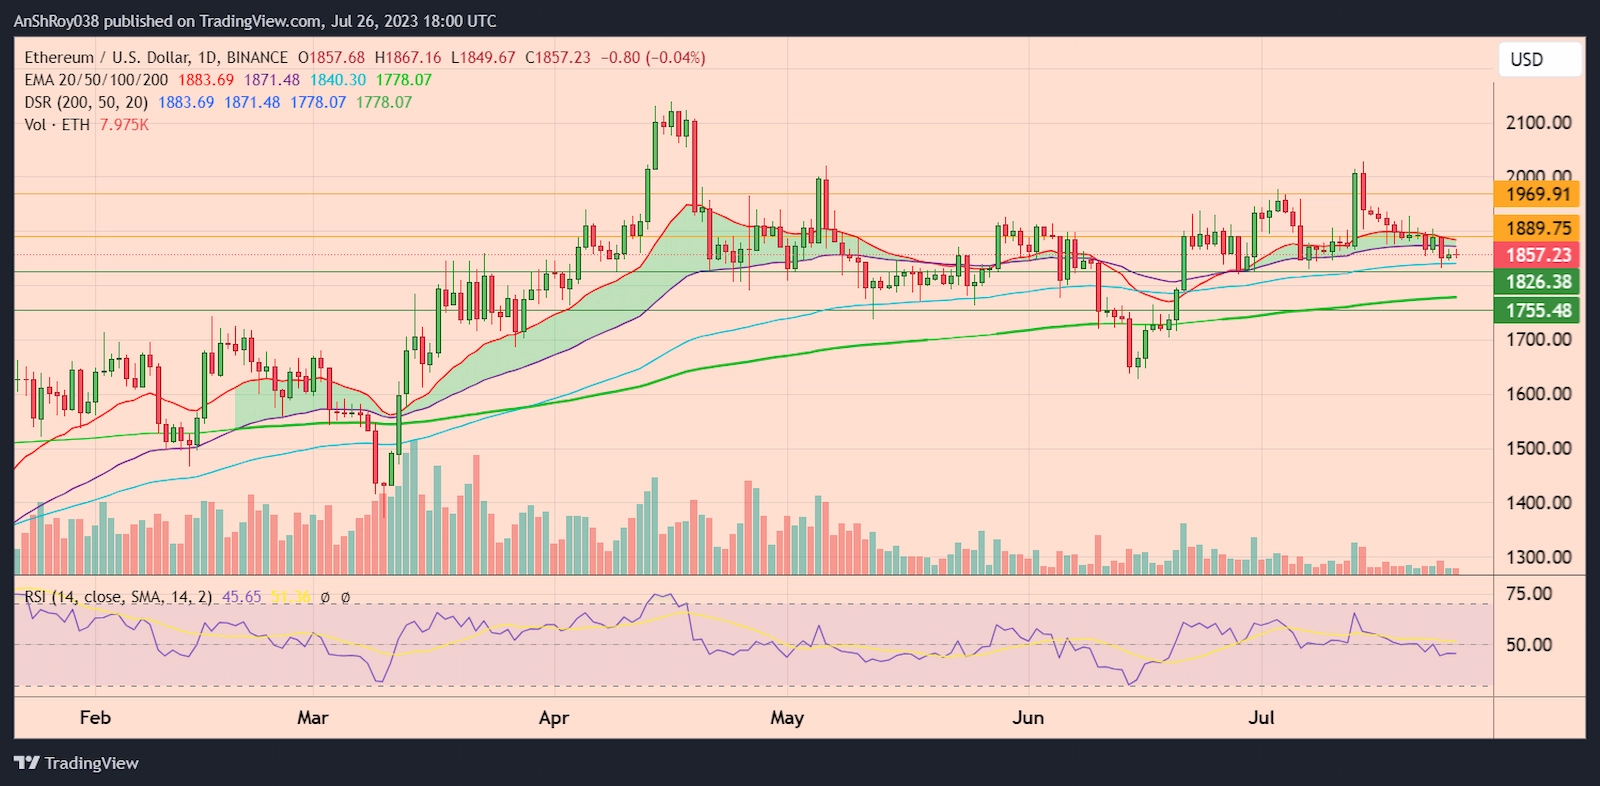
However, should ETH prices fail to rally, the token might drop below the 100-day EMA (blue wave) trendline to the support level near $1,826. Breaching the immediate support level could push the ETH price to test the support near $1,755 before recovering.
The RSI for ETH remained neutral, clocking at 45.65 on the daily timeframe.

… [Trackback]
[…] Read More here to that Topic: coinchapter.com/eth-price-drops-8-in-two-weeks-but-a-buy-signal-flashes-for-ethereum/ […]
… [Trackback]
[…] Read More here on that Topic: coinchapter.com/eth-price-drops-8-in-two-weeks-but-a-buy-signal-flashes-for-ethereum/ […]
… [Trackback]
[…] Here you will find 56374 more Info to that Topic: coinchapter.com/eth-price-drops-8-in-two-weeks-but-a-buy-signal-flashes-for-ethereum/ […]
… [Trackback]
[…] Here you can find 46979 additional Info to that Topic: coinchapter.com/eth-price-drops-8-in-two-weeks-but-a-buy-signal-flashes-for-ethereum/ […]
… [Trackback]
[…] Read More to that Topic: coinchapter.com/eth-price-drops-8-in-two-weeks-but-a-buy-signal-flashes-for-ethereum/ […]