Key Takeaways:
- Memecoin frenzy has benefitted Ethereum as gas burning reduced Ether supply.
- ETH is moving inside a bullish technical pattern.

NEW DELHI (CoinChapter.com) — The recent memecoin frenzy has positively impacted Ethereum. Since most new tokens used the Ethereum network to launch their tokens, the resulting spike in gas fees helped reduce the prime altcoin’s supply.
Following the EIP-1559 upgrade, Ethereum introduced a fee-burning mechanism to make ETH deflationary. With several tokens like Pepe, Wojak, Mong Coin, etc., attracting traders with promises of massive gains, Ethereum fees reached a 12-month high on May 5.
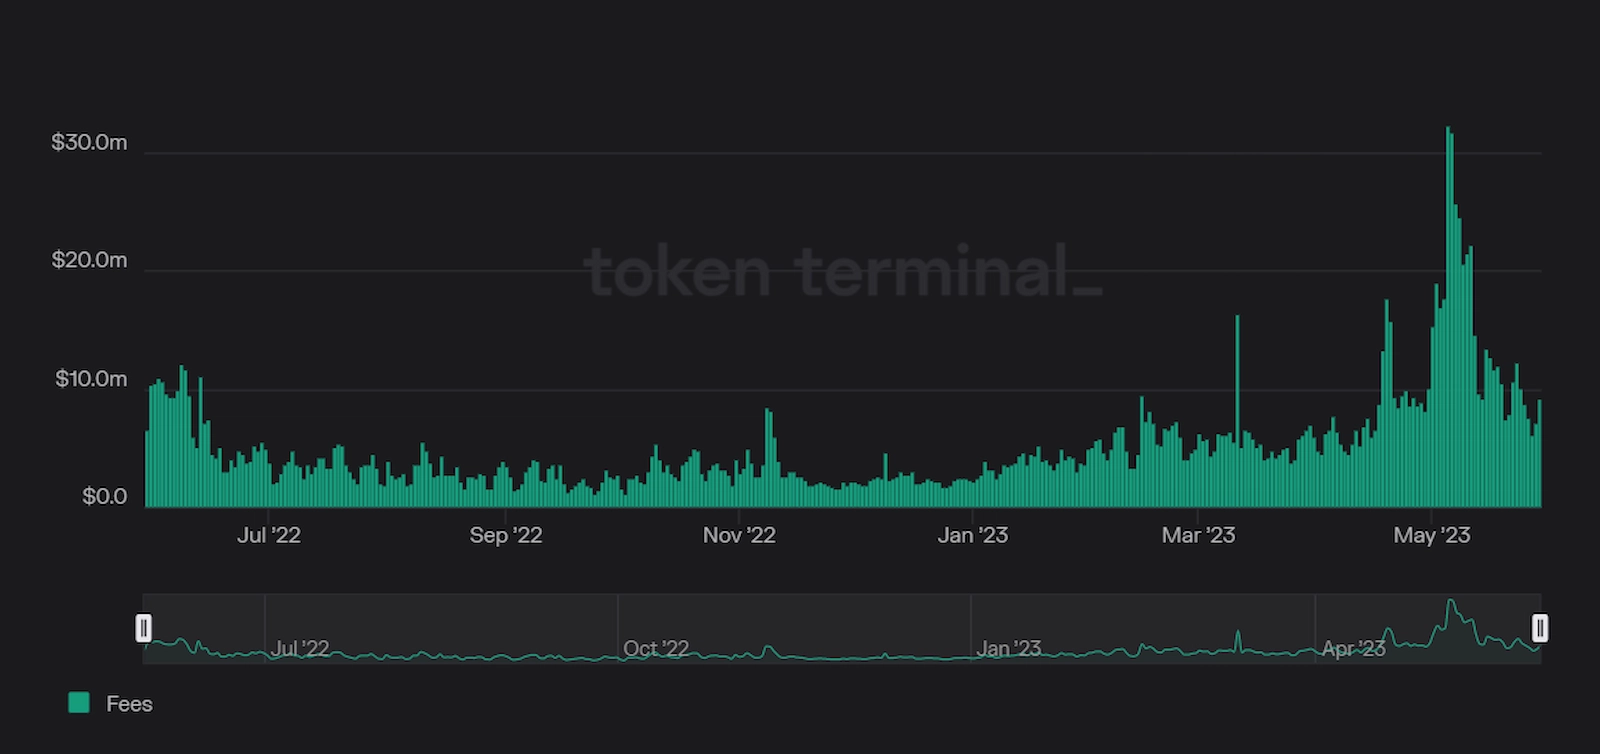
Consequently, the amount of ETH burned as part of the fee grew. Per data from Ultrasound.money, the Ethereum network has burned nearly 144,000 ETH over the past 30 days. At current prices, the total burn amounted to over $274.4 million.
Burning helps remove tokens from the active supply. Theoretically, reduced supply helps spike an asset’s price if demand remains the same or increases. Hence, traders consider burning a bullish cue for a token.
ETH Price Moving Inside A Bullish Technical Pattern
Another bullish cue for ETH price is the token forming a bullish technical pattern called the ‘Ascending Triangle.’
A horizontal trendline that connects swing highs and an ascending trendline connecting swing lows forms an ascending triangle pattern. Volume helps determine if a breakout is strong.
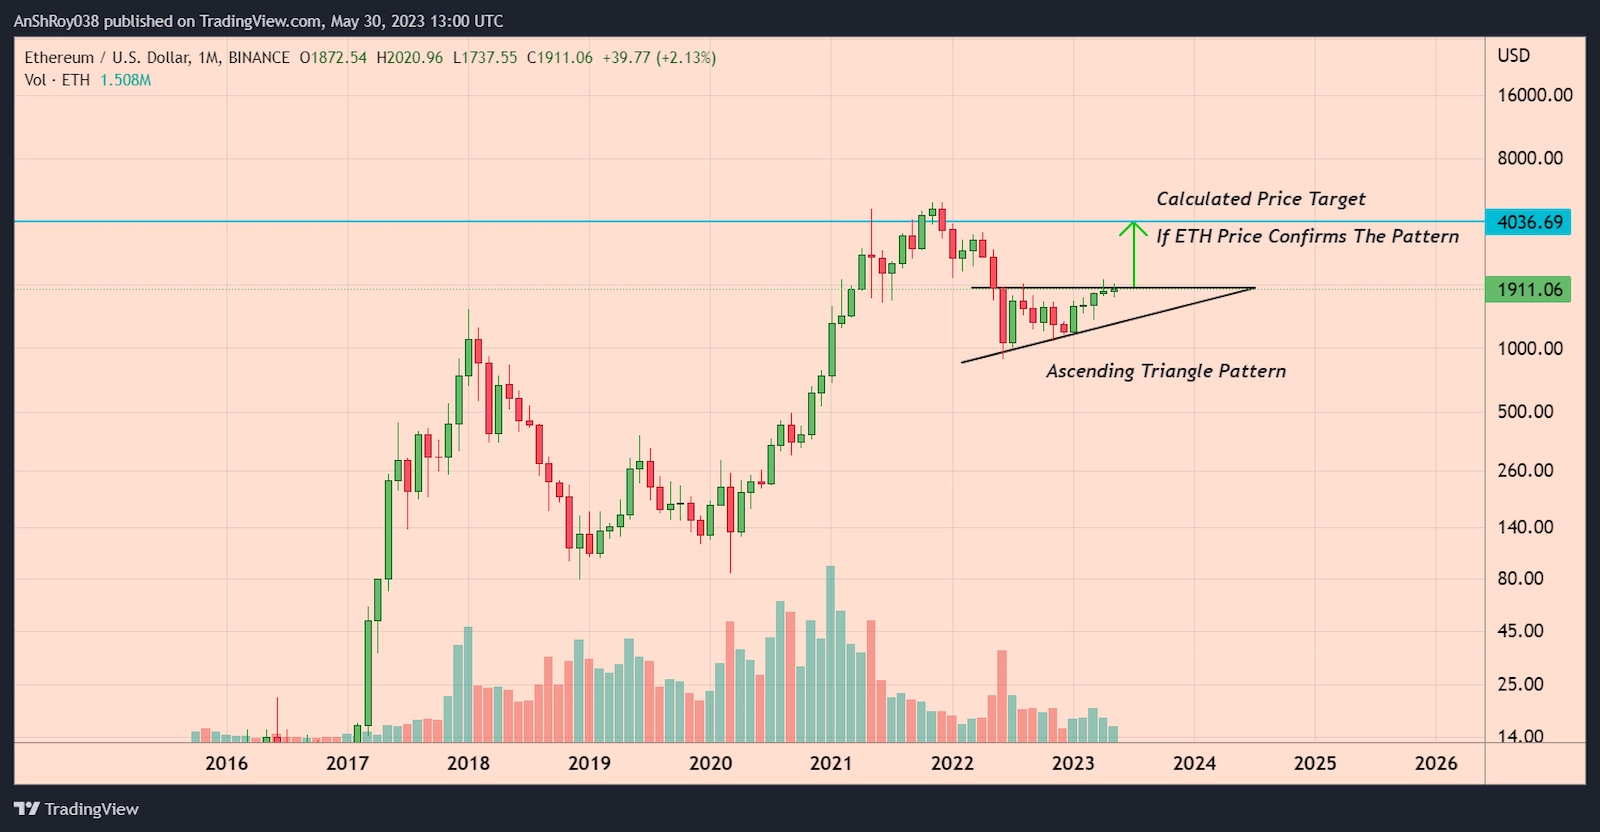
Under ideal conditions, buyers would enter the market as the trendlines close the gap, pushing prices above horizontal resistance with heavy volumes. Unfortunately, a low-volume breakout on the upside will likely fail, resulting in a pullback.
Also Read: Nvidia vs. Coinbase — Did Cathie Wood Miss Out On The Milking Cow?Per the rules of technical analysis, the price target for a breakout is equal to the triangle’s height at its thickest point. Therefore, the Ethereum token could rise 111% to reach a calculated price target near $4,037.
ETH Price Consolidates After Recent Minor Rally
Meanwhile, the ETH price is crabbing after rebinding off the 100-day EMA (blue wave) on May 25. The short-lived rally saw Ether’s price gain nearly 9% to form a daily high near $1,917 on May 28.
However, the Ethereum token has been crabbing since then, hovering above the 20-day EMA (red wave) and 50-day EMA (purple wave) support confluence near $1,844.
Failure of the immediate support level might force the ETH price to test support above the 200-day EMA (green wave) near $1,750 before recovering.
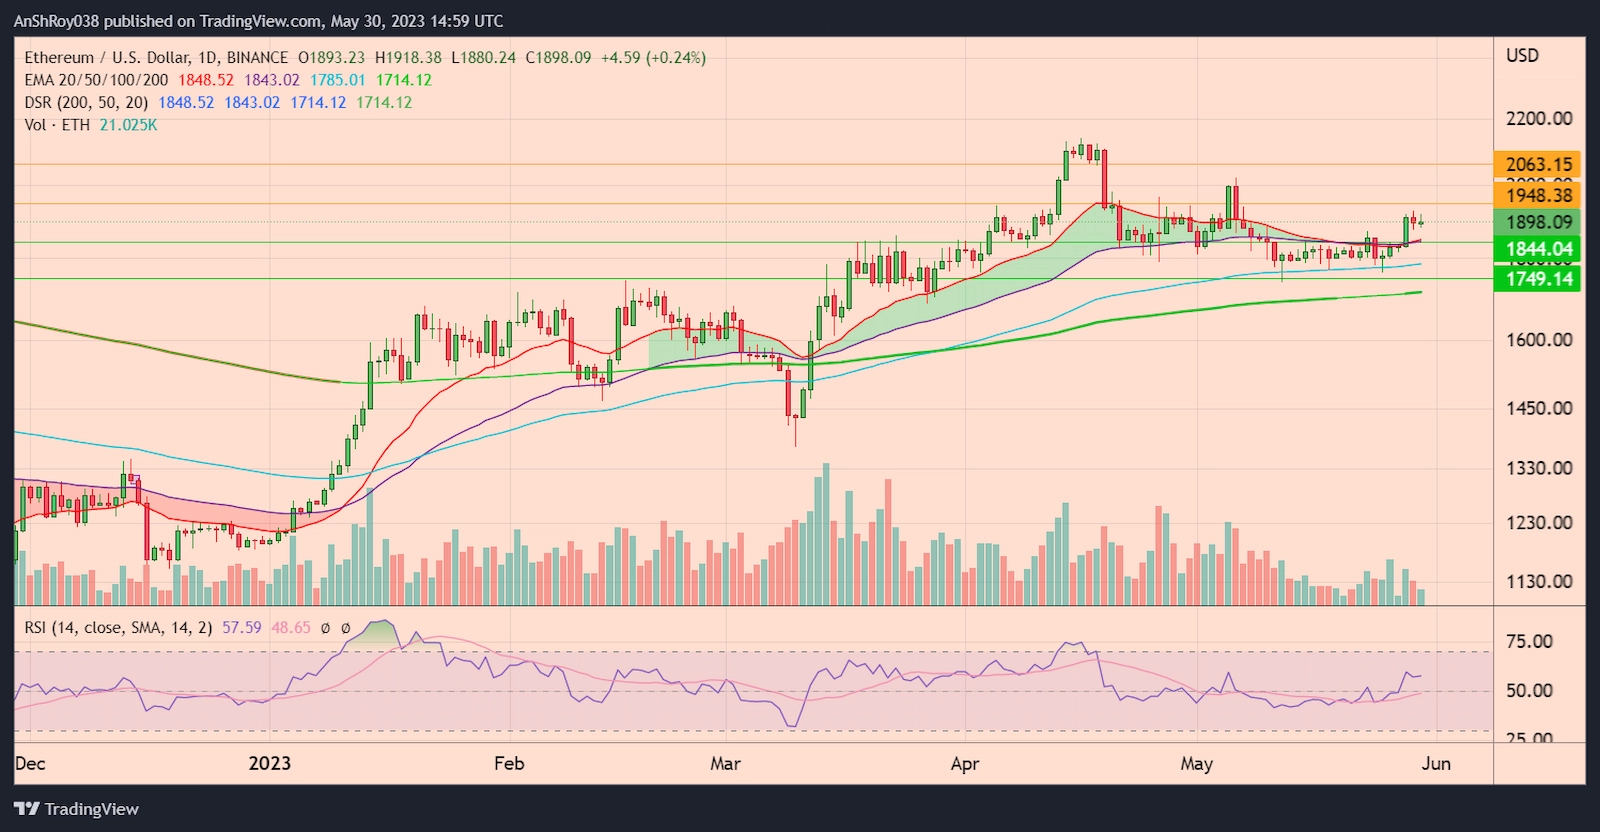
On the other hand, if the token rallies upward after consolidating, the ETH price would likely face resistance near $1,950. Moreover, breaking above the immediate resistance might help the Ethereum token price rise to $2,063 before downside corrections pare gains.
The relative strength index for ETH remained neutral, with a value of 57.59 on the daily charts.

… [Trackback]
[…] Info on that Topic: coinchapter.com/ethereum-burns-144k-eth-amid-memecoin-frenzy/ […]
… [Trackback]
[…] Read More to that Topic: coinchapter.com/ethereum-burns-144k-eth-amid-memecoin-frenzy/ […]