
Key Takeaways:
- Ethereum prices fell 45% since Jan 1.
- ETH is currently moving laterally, unable to move above immediate resistance.
NEW DELHI (CoinChapter.com) — The world’s second-largest cryptocurrency Ethereum (ETH), fell nearly 45% in Jan, reaching a low of $2,160 on Jan 24 from the month’s high of $3,939.
Following the crypto market rout of Jan 21, Ethereum prices continued downwards before recovering slightly in the week beginning Jan 24. However, ETH is still trading near price levels, last seen in Aug 2021.
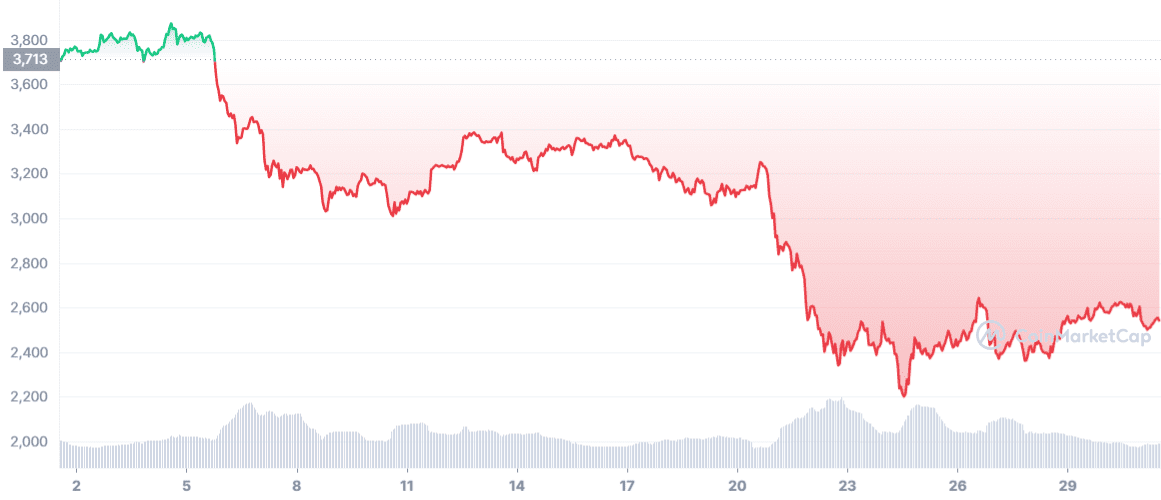
However, long wicks on red and green candles indicate that bears and bulls are aggressively active on either end of the price movement. On Jan 24, ETH’s price fell to $2,160 before bulls started a buying spree that saw Ethereum close the day at $2,442.
Also Read: Will Ethereum recover as FUD turn to FOMO?Ethereum has been trading under a descending trendline resistance since Dec 1. Immediate resistance challenging ETH prices is at $2,650. However, key resistance for the Ethereum token is near $2,866, where ETH’s descending triangle resistance and 26-day exponential MA line form a confluence.
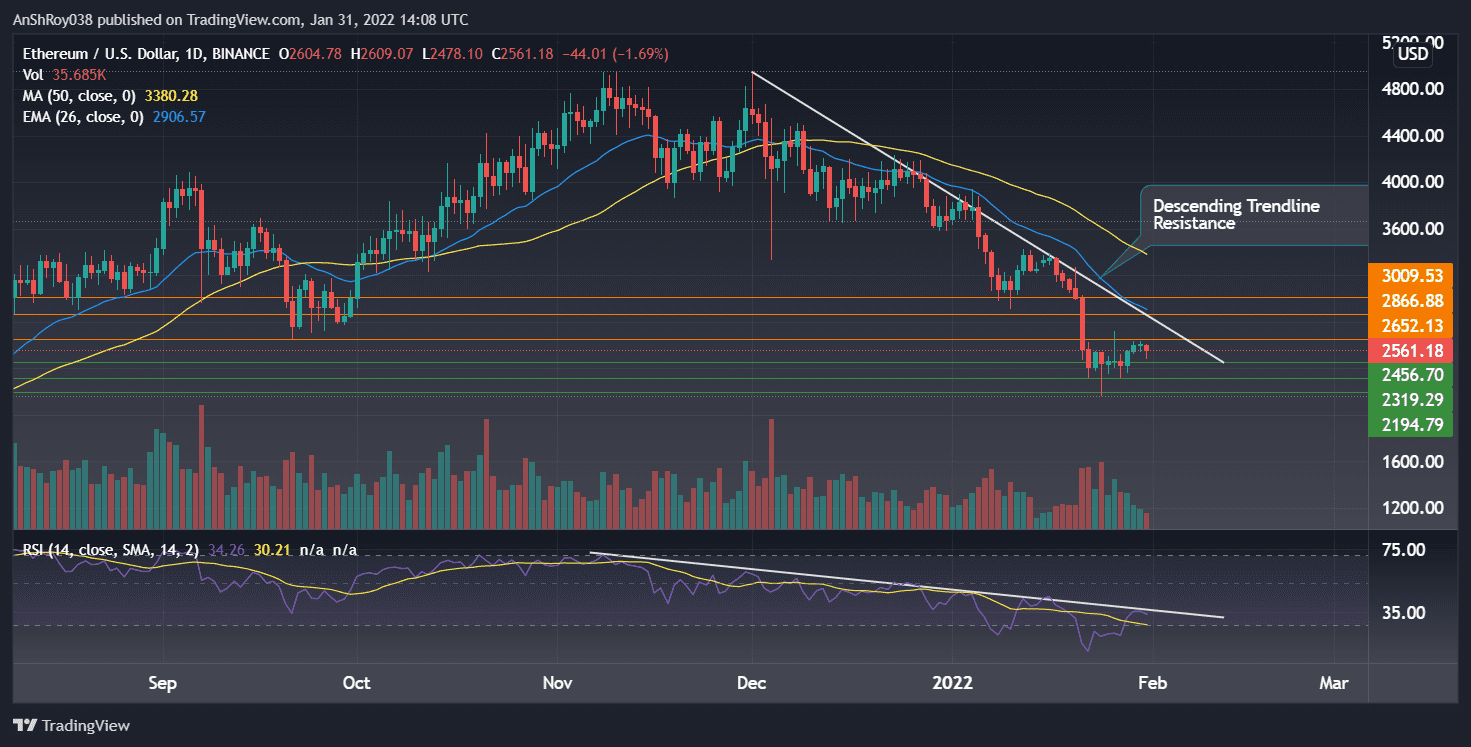
If bulls dominate price movement, ETH could rise to $3,000, which is a psychologically important price level.
Meanwhile, the relative strength index for Ethereum is hugging the oversold region borderline, clocking 33.61 on the daily charts. The RSI trendline needs to chart a higher high to break away from the downtrend that began in Nov last year.
Ethereum MACD Goes Bullish
Trend-based momentum oscillator MACD gave a bullish signal for Ethereum as it painted a bullish crossover on the daily charts. In detail, a bullish crossover means the MACD line (difference between 12-day and 26-day EMA) has moved above the MACD signal line (9-day EMA of MACD).
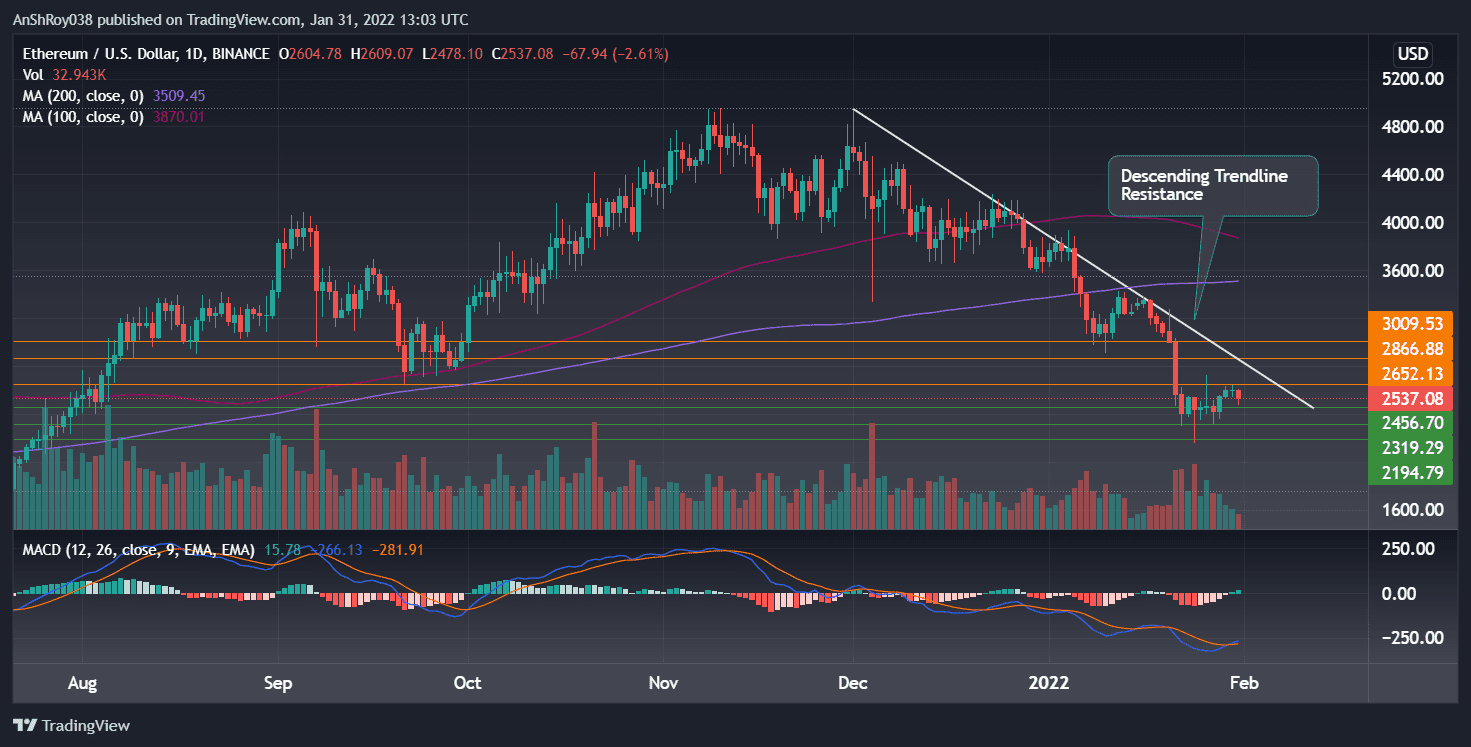
The MACD histogram, which plots the difference between the MACD line and its signal line, painted expanding bars, indicating the bullish momentum is strengthening. On the other hand, if bears begin booking on relief rallies, ETH price could fall to immediate support at $2,456.
Also Read: Ethereum token (ETH) challenges $2.6k level as bearish cross looms.Moreover, a sustained downtrend could bring the support at $2,319 into play. In addition, if ETH fails to break above descending resistance, prices could fall to $2,194. Since Dec, ETH price movement has tested the resistance multiple times, failing to break above and falling lower.
If the trend repeats itself, prices could fall to $2,000 or even lower before recovering.
At the time of writing, ETH was changing hands at $2,594, down 0.50% on the day.

… [Trackback]
[…] Read More on to that Topic: coinchapter.com/ethereum-recovers-some-lost-ground-but-eth-price-struggles-to-move-above-2-7k/ […]
… [Trackback]
[…] Find More on on that Topic: coinchapter.com/ethereum-recovers-some-lost-ground-but-eth-price-struggles-to-move-above-2-7k/ […]