
Key Takeaways:
- More than $1 billion worth of Ether removed from crypto exchanges in 24 hours.
- Last time it happened, ETH jumped 60% within 30 days.
- Meanwhile, ETH charts predict a jump to $6,500.
NEW DELHI (CoinChapter.com) — Ethereum bulls have something to rejoice.
According to a Twitter post shared by crypto analytics provider IntoTheBlock, investors withdrew $1.2 billion worth of Ethereum (ETH) from centralized exchanges on Sept. 16. The transaction also sets a new record for short-term outflows from exchanges.
The analytics provider also highlighted that ETH price went up by 60% the last time centralized exchanges outflow reached $1 billion in April. Exchange outflows create bullish speculations as active supply shrinks on exchanges while demand continues.
In addition, Ether prices have formed a cup and handle pattern on its daily charts, which predicts a boost to $6,500 in the future.
Ethereum Exchange Outflows
Ethereum’s all exchange outflows reached a record $1.2 billion worth on September 16. In detail, it means that investors are moving ETH into their private wallets, suggesting a holding mindset. As such, the decreased active supply in exchanges boosts ETH prices if demand remains constant.
Also Read: Avalanche (AVAX) could continue the bullish streak; 3 reasons why.
As IntoTheBlock pointed out, the outflow has previously led to a price rise. However, Ethereum has changed since then. August’s London Upgrade introduced a burn mechanism that helps adjust gas fees on the blockchain. Ethereum’s transaction fees have been an issue for the network.
At the time of writing, the Ethereum network has burned around 311,587 ETH, worth $1.1 billion, with NFT marketplace OpenSea leading the burn. Ethereum transactions come second on the burn leaderboard, accounting for 8.7% of the total ETH burned. The current burn rate is 5.04 ETH per minute. Burning further decreases Ether supply.
Moreover, BTC exchange balances have returned to levels last seen in February 2018. As such, Bitcoin sees steady outflows from centralized exchanges. However, as analytics firm Glassnode noted, despite the increased volatility, Bitcoin holders remain steadfast.
Price Charts For ETH
Ethereum’s bullish speculations also come from its price charts. The Ethereum token’s daily prices have formed a technical pattern called ‘cup and handle pattern.’ In detail, the pattern resembles a cup and handle with a U-shaped cup and a handle with a downward drift.
Also Read: SHIB shoots up 46% as Shiba Inu scores a listing on Coinbase.
The pattern develops after prices correct from an upside creating a rounding bottom, forming the cup. Prices then rebound towards prior high before failing to break above it and pulling back, including a smaller rounding bottom called the handle.
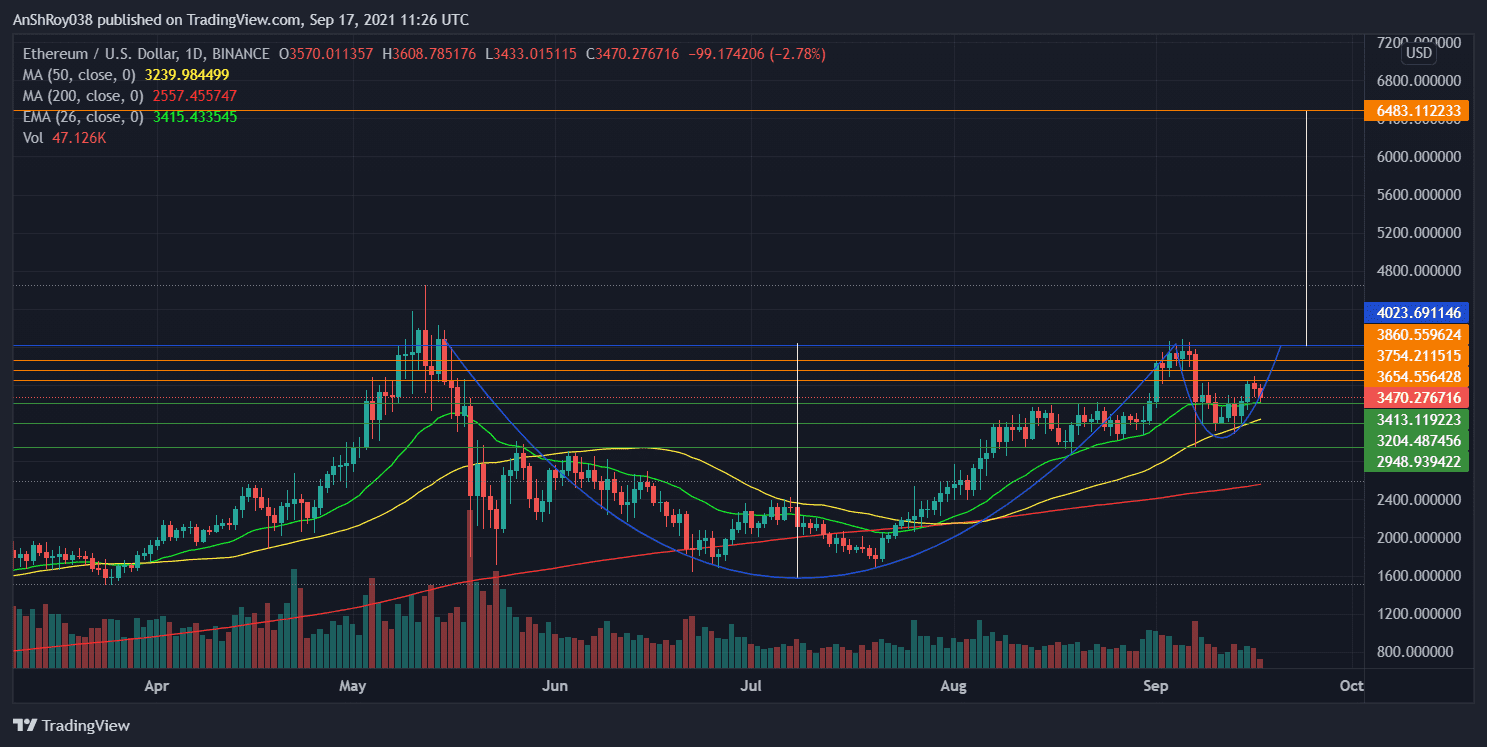
Once the price returns to the prior high again and breaks out successfully, the resulting uptrend raises prices to a level equal to the cup’s depth. Thus, if the pattern holds, ETH may reach nearly $6,500. Meanwhile, ETH charted two consecutive red candles on Thursday and Friday, falling 7% between Sept. 16’s high of $3,692 and Sept. 17’s low of $3,433.01.
For now, the support provided by Ether’s 26-Day (Green) exponential moving average at $3,413.1 holds strong. If ETH bulls fail to rally upwards, Ethereum can find support near its 50-Day (Yellow) MA at $3,204.4 with further help at $2,948.9.
On the other hand, a move upwards would face resistance at $3,654.5, followed by resistance at $3,754.2. Further, resistance at $3,860.5 would cap any sustained upswing in the short term.
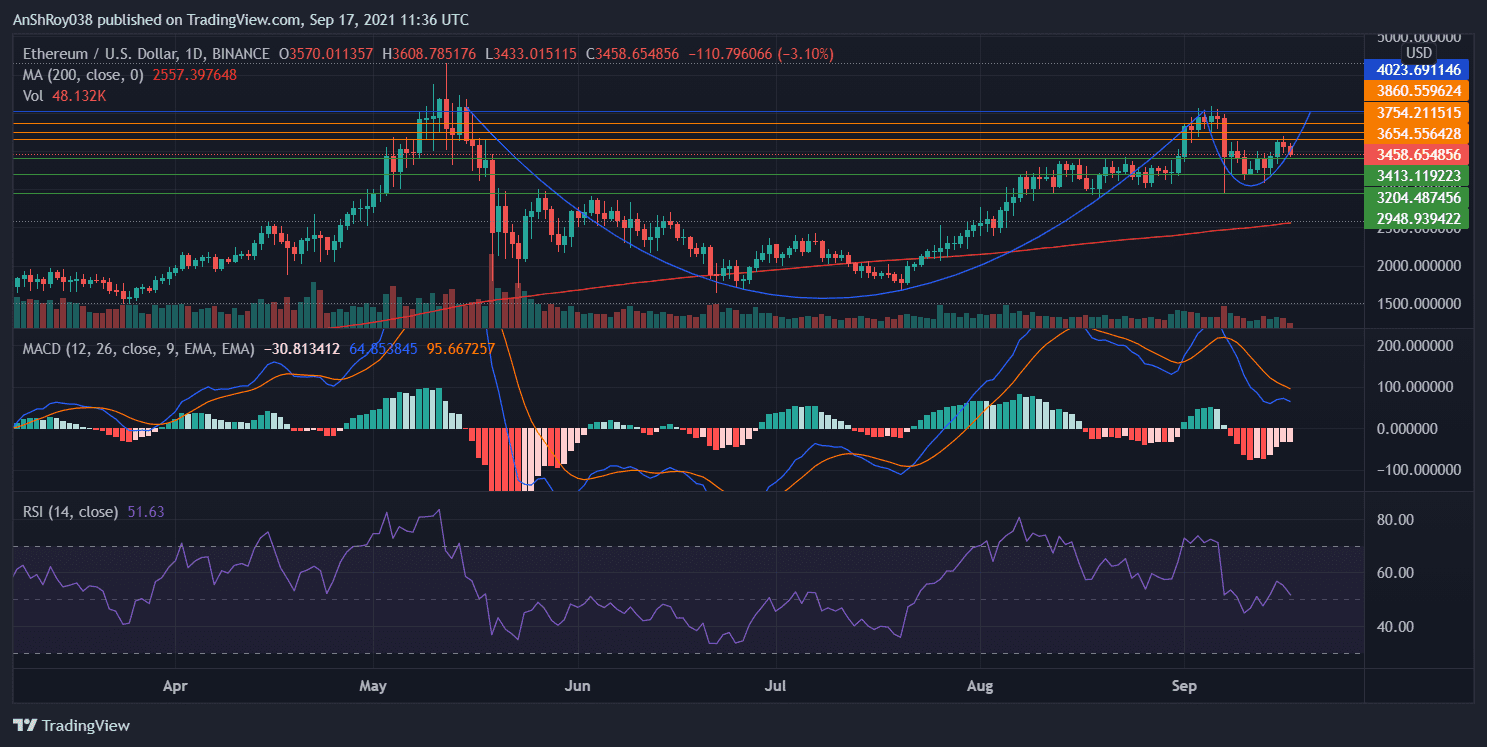
MACD for ETH is currently bearish, as the negative bars on the MACD histogram depict. The histogram plots the difference between the MACD line (difference of 12-Day and 26-Day EMA) and the MACD signal line (9-Day EMA of MACD). The bars are nearly equal in magnitude, indicating the two MACD lines are currently running parallel.
When the MACD line moves above its signal line, it will indicate a bullish crossover. In the meantime, the relative strength index for ETH is neutral, with a value of 51.90.
At the time of writing, ETH was trading at $3,455, down 3.23% on the day.

… [Trackback]
[…] There you will find 63782 additional Info on that Topic: coinchapter.com/ethereum-targets-6-5k-as-exchange-outflows-reaches-record-levels/ […]
… [Trackback]
[…] There you can find 2694 additional Info on that Topic: coinchapter.com/ethereum-targets-6-5k-as-exchange-outflows-reaches-record-levels/ […]
… [Trackback]
[…] Find More Information here to that Topic: coinchapter.com/ethereum-targets-6-5k-as-exchange-outflows-reaches-record-levels/ […]
… [Trackback]
[…] Read More on on that Topic: coinchapter.com/ethereum-targets-6-5k-as-exchange-outflows-reaches-record-levels/ […]
… [Trackback]
[…] Info to that Topic: coinchapter.com/ethereum-targets-6-5k-as-exchange-outflows-reaches-record-levels/ […]