
Key Takeaways:
- A crypto analyst predicts an uptrend for Ethereum, based on a Bull Flag.
- ETH daily and weekly charts could indicate the opposite approach.
YEREVAN (CoinChapter.com) – Ethereum’s native token Ether (ETH) has “good potentials” to extend its yearlong bullish structure, per Vince Prince, an independent market analyst.
Prince spotted Ether inside a “major bull flag” structure in a tweet published Monday. This technical pattern appears when the price consolidates lower after a major move upside, to send it further higher towards a profit target that sits at length equal to the size of the previous uptrend, also called “Flagpole.”
As a result, the ETH price now sees a run-up towards at least $6,500 should it successfully break above the Flag’s upper trendline.
Dissenting technical setup
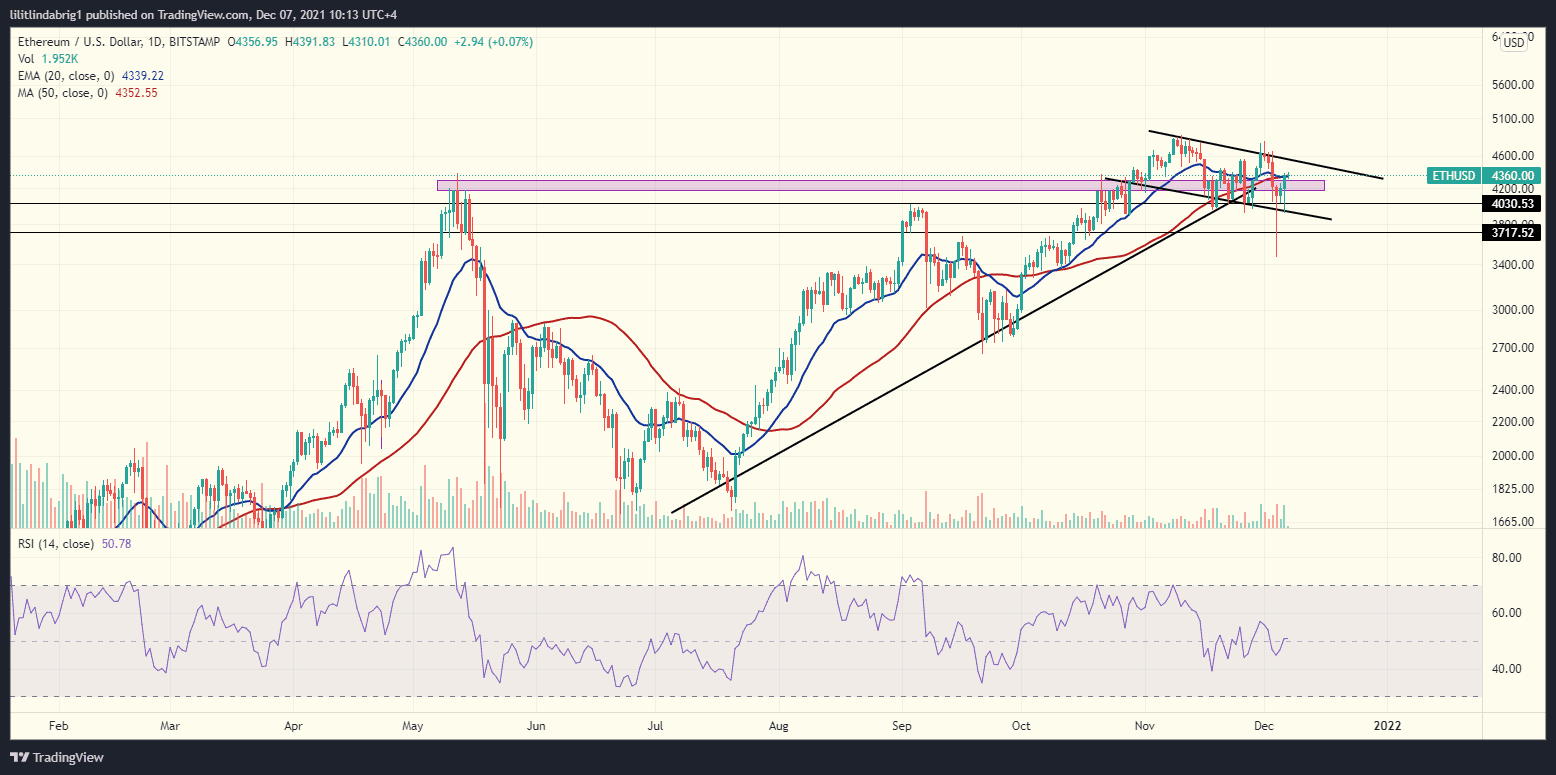
Ether also hinted at painting a Descending Triangle, a bearish formation that could take the price further south in the upcoming sessions. In detail, the structure contains a horizontal support line and a falling resistance trendline. If it pans out, the price could fall instead of following the “Bull Flag” prediction above.
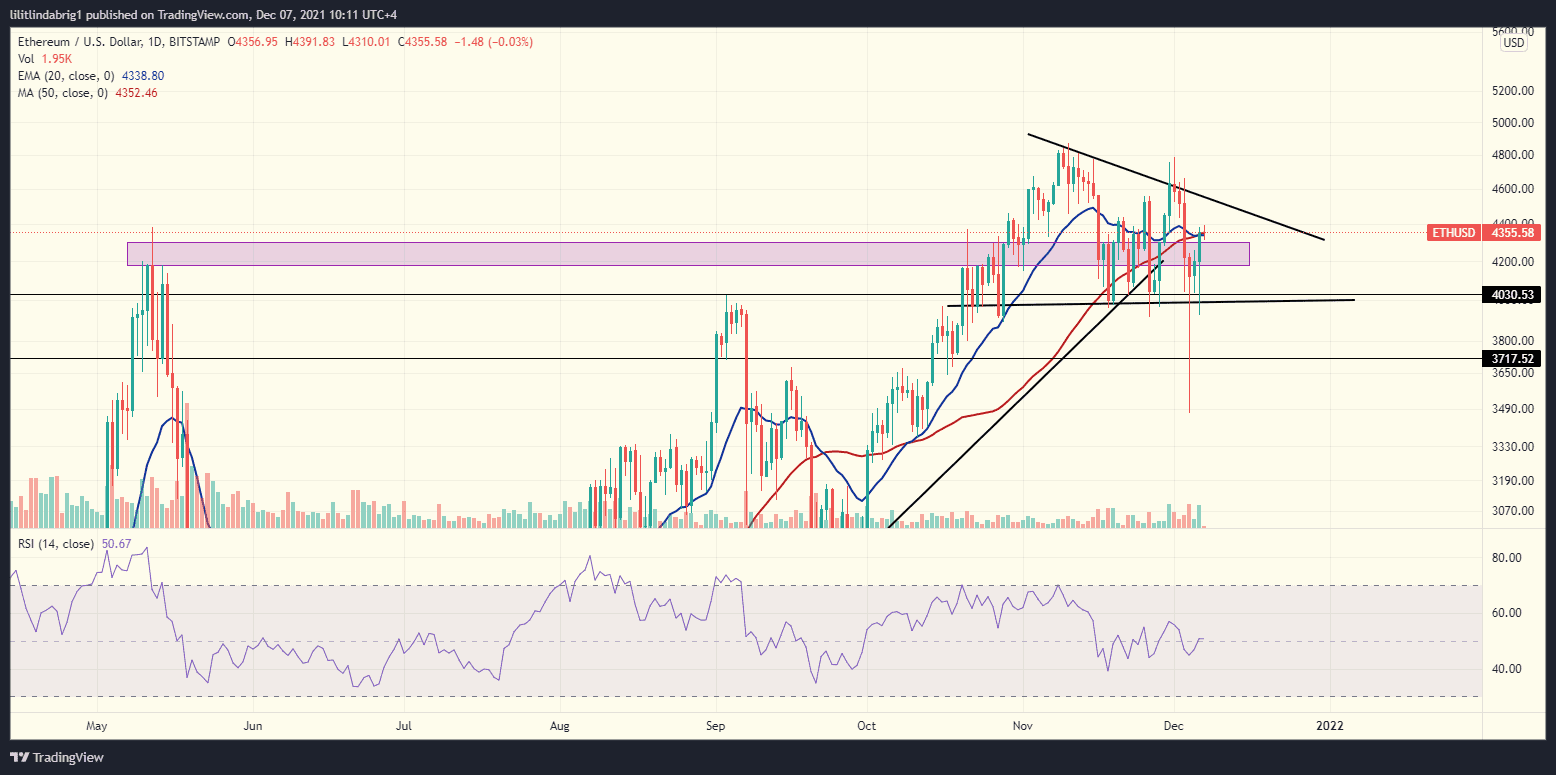
Additionally, the ETH price action arrived at a significant resistance-turned-support bar at $4,300. It has been instrumental in the previous two months and provided the token with assistance. If the bar remains relevant in the upcoming sessions, it could boost Ether enough to reach $4,543, the Triangle’s upper trendline.
Also read: Ethereum user pays more in gas fees than the transaction value itself.ETH weekly chart also bearish
The weekly graph also depicts Ether pursuing a bearish setup as the cryptocurrency paints a Rising Wedge.
In detail, the Rising Wedge consists of two converging trendlines that constrict the price action and lower the price swing. It drives the price up as long as the asset stays in the formation but indicates a looming decline. Ethereum broke south on Dec 4 and left the setup. The upcoming sessions will show if the cryptocurrency will resume the uptrend or comply with the bearish outlook.
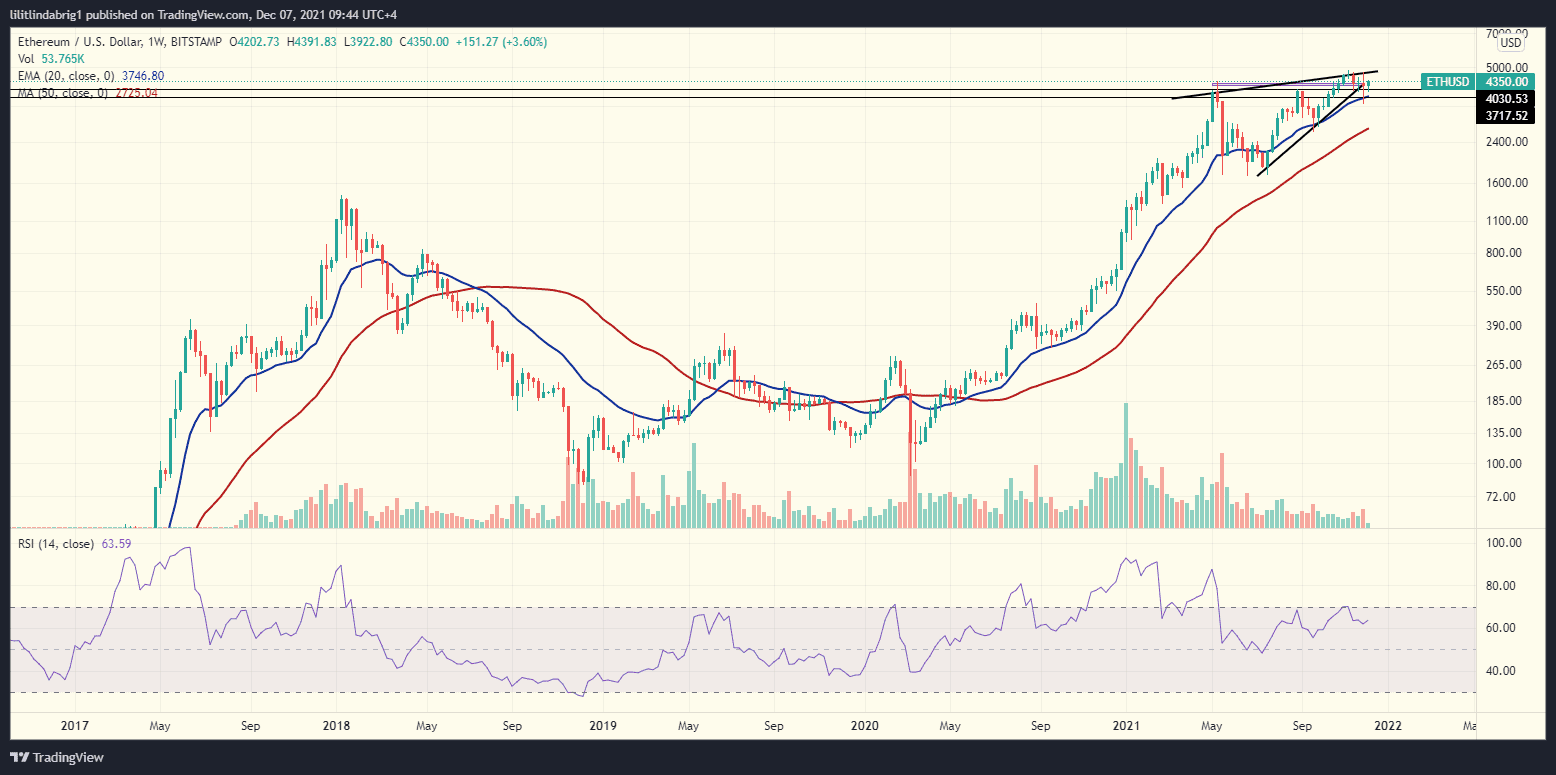
Also read: Ethereum realized market cap hits all-time high amid ETH rebound from $4K-supportThe weekly chart’s relative strength index (RSI) remained strong and charted above 60. The RSI is a momentum indicator that reflects traders’ confidence in an asset. Generally, when the RSI is above 50, it could indicate the traders’ high return expectations.

… [Trackback]
[…] Read More to that Topic: coinchapter.com/ethereums-bull-flag-setup-fights-two-dreaded-selloff-indicators-as-eth-rises-back-above-4-4k/ […]
… [Trackback]
[…] Info to that Topic: coinchapter.com/ethereums-bull-flag-setup-fights-two-dreaded-selloff-indicators-as-eth-rises-back-above-4-4k/ […]
… [Trackback]
[…] Find More Info here on that Topic: coinchapter.com/ethereums-bull-flag-setup-fights-two-dreaded-selloff-indicators-as-eth-rises-back-above-4-4k/ […]
… [Trackback]
[…] Here you can find 89685 additional Info on that Topic: coinchapter.com/ethereums-bull-flag-setup-fights-two-dreaded-selloff-indicators-as-eth-rises-back-above-4-4k/ […]
Provider transparency on Fortune Ox math has improved this year.
A variância do Fortune Tiger bateu diferente depois do patch.
Ninguém fala do Buffalo Win mas a taxa de hit é honestamente decente.
Uma conta que sigo fez um print da banca subindo no Prosperity Gods Book e mandou no grupo. Galera aplaudiu.
PIX ou USDT pra saque rápido? A galera dos dados não decide.
Bônus do Sweet Bonanza bateu mais ou menos a cada 200-300 giros na minha amostra. Pode variar.
Buffalo Win só caiu o bônus no giro 412 — antes disso, nada.
Wizdom Wonders ficou morto a manhã toda, depois do almoço acordou.