
Key Takeaways:
- Fidelity Investments presented one of the most bullish scenarios for Bitcoin, forecasting BTC to reach $100 million a coin.
- However, the scenario seems a bit far fetched.
- BTC prices broke above $50k level on September 2.
NEW DELHI (CoinChapter.com) — Entrepreneur and Investor Anthony Pompliano shared Fidelity Investements’ uber bullish outlook on Bitcoin in his podcast ‘The Best Business Show.’. In addition, the Boston-based investment firm presented its outlook in a webinar called ‘Understanding Bitcoin, What Can History Teach Us?’
As per Fidelity, the flagship crypto is likely to reach an astronomical price of $100 million per coin by 2035. The firm based its forecast on the Stock-to-Flow model. In detail, the S2F model quantifies scarcity by taking the global supply of Bitcoin and dividing it by its annual production.
Meanwhile, BTC prices broke above $50,000 again.
The Fidelity Issue
Mr. Pompliano was enthusiastic about Fidelity’s forecast, presented by Jurrien Timmer, the firm’s Director of Macro. Mr. Timmer has long been a Bitcoin bull and has often compared it with Gold in the 1970s. On August 20, Mr. Timmer shared a chart showing similarities between Bitcoin and Gold.

From this comparison and the growing fundamentals, Fidelity’s Director of Macro believes BTC would begin its upward rally. The Stock-to-Flow model predicts growth in BTC prices due to a reduction in its annual inflation rate. As such, by 2030, when Bitcoin inflation would be 0.5%, Fidelity’s model predicts BTC will reach a price of $1 million.
Moreover, by 2035, Bitcoin’s inflation is predicted to reach 0.2%, raising BTC prices to $100 million.
Fidelity are saying that basically we are in the 1970s of gold but for Bitcoin now, they are calling for a very very material increase in the price of Bitcoin. To see Fidelity, show a chart that says that Bitcoin is going to be at 100 million dollars by 2035 is very incredible
Anthony Pompliano in his podcast. The Stock-to-Flow model has been accurate for Gold, equities, and other assets. Analyst PlanB first highlighted the S2F model’s accuracy for Bitcoin. However, the model has many detractors that believe it would be unsuccessful due to BTC’s characteristics.
Also Read: El Salvador creates a $150 million Bitcoin trust while citizens protest.
However, most investors took Fidelity’s latest forecast with a pinch of salt. If Bitcoin prices reach $100 million, that would mean a market cap of nearly $2 quadrillion. To put things in perspective, the total amount of money in the world, including currencies, bonds, cryptocurrencies, gold, silver, and other things, add up to around $2.7 quadrillion.
If more dollars come into circulation, it would lower the currency’s purchasing power. Currently, the US is facing increased inflation rates, its highest in almost a decade.
As such, BTC prices reaching the price predicted by Fidelity would require minting an insane amount of dollars, which would lead the dollar to inflation levels similar to what Zimbabwe witnessed in 2018 and Germany in 1923.
The total number of Bitcoins is capped at 21 million. As such, with increasing demand and limited supply, BTC prices would surely rise. However, even ardent BTC loyalists find it difficult to believe Fidelity’s forecasts.
Bitcoin Pushes Past $50K again
Bitcoin prices pushed above $50,000 once again on September 2. However, prices failed to hold above $50,000 and pulled back. At present, BTC has support near its 26-Day (Blue) Exponential Moving Average at $47,081.

Bitcoin is still bullish across all time horizons, as its 50-Day (Green) and 200-Day (Red) MA trendlines indicate. However, if prices decline below immediate support, bulls would try to rally at $46,305, near BTC’s 200-Day MA line. Further support is at $45,279.
Also Read: Cardano (ADA) price hits record high at $3 amid altseason.
If bulls manage to consolidate at $50,000, the next target would be resistance at $51,000, followed by resistance at $52,015 and $53,835.
MACD for Bitcoin is still bearish, as the negative bars on the MACD histogram indicate. The histogram charts the difference between the MACD line (difference of 12-Day and 26-Day EMA) and the MACD signal line (9-Day EMA of MACD).
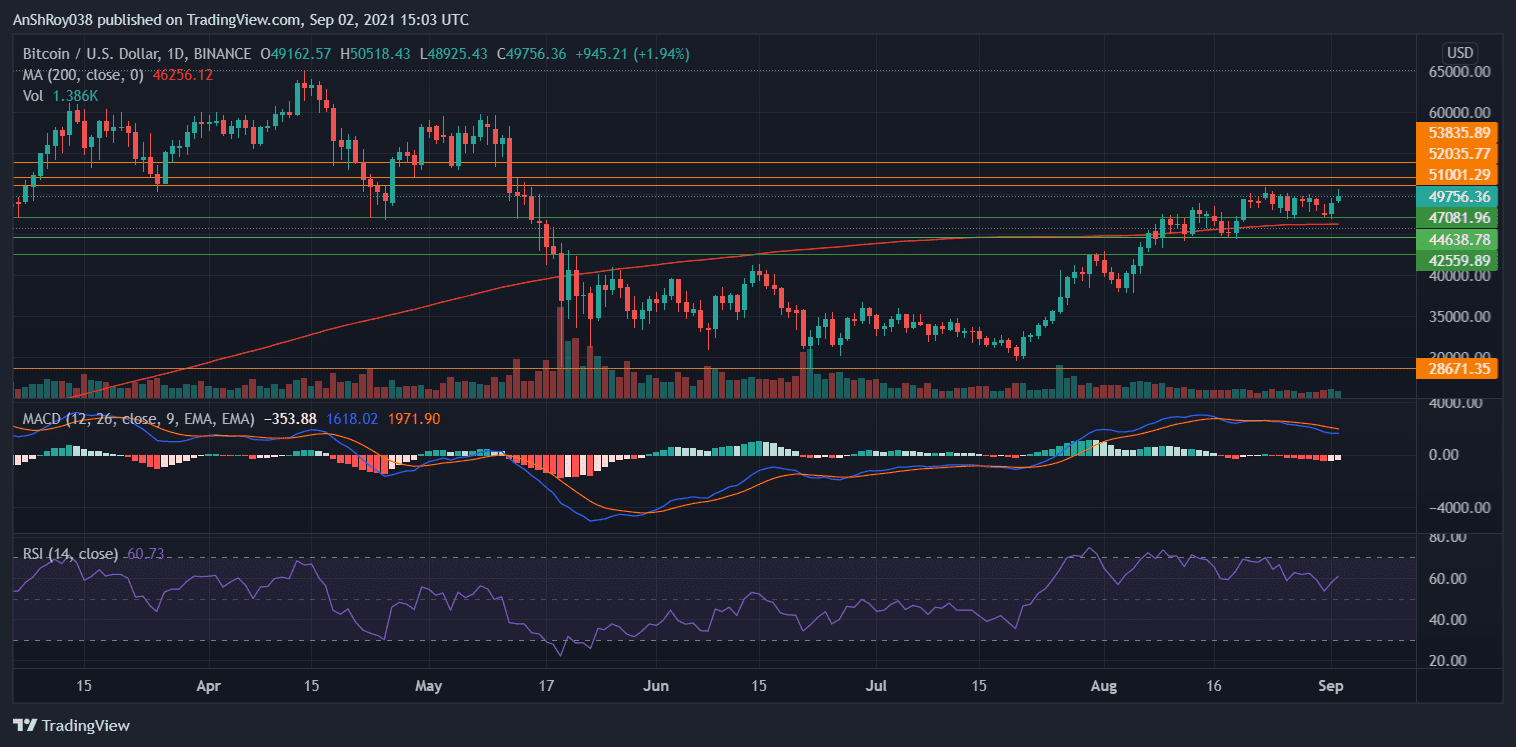
However, the bars decrease in magnitude, indicating that the MACD line moves upwards and may soon become bullish.
The relative strength index is neutral at 60.73.
At the time of writing, BTC was trading at $49,804, up by 2.04% on the day.

… [Trackback]
[…] Read More to that Topic: coinchapter.com/fidelity-forecasts-bitcoin-to-cost-100-million-per-coin/ […]
… [Trackback]
[…] Information to that Topic: coinchapter.com/fidelity-forecasts-bitcoin-to-cost-100-million-per-coin/ […]