

Key Holo Outlook
- Holo (HOT) rebounds wildly after testing its 20-day moving average as support.
- The price jumps more than 30 percent from its week-to-date low established in the previous session.
- A minor sell-off emerges at the local top on profit-taking sentiment.
Yerevan (CoinChapter.com) — Holo prices jumped aggressively during the Asia-Pacific session on Thursday, much in contrast with a major downside correction across top assets, including Bitcoin, suggesting that investors engaged in rotational trading.
Watch the Green Wave
The HOT/USDT exchange rate opened positive on Thursday, building up the rebound that began in the previous session at $0.0162. Traders kept flocking into the Holo market, heading into the Pacific and Asian sessions. As a result, the price jumped to as high as $0.0214.
Looking closely, and as CoinChapter.com had also discussed in its previous Holo price coverages, the HOT/USDT rate rebounded off medium-term support represented via a 21-day moving average wave (the greened price floor in the chart below). The level served traders attractive buying opportunities when others were rotating out of overvalued assets, including Bitcoin.
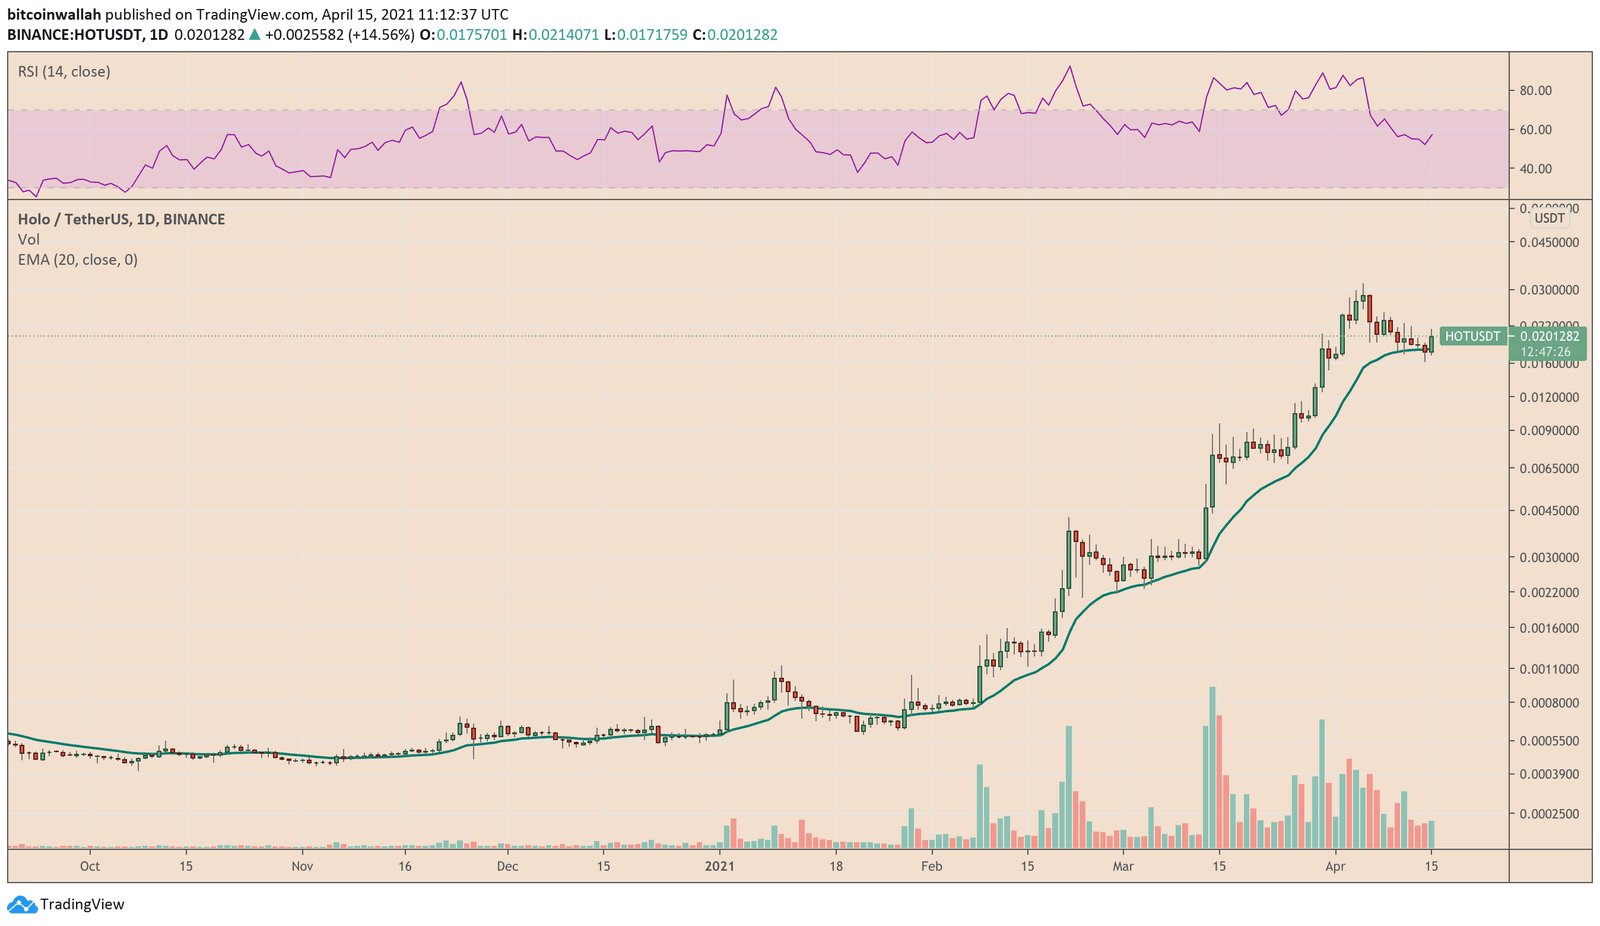
Therefore, the price kept on pumping, turning its intraday profits higher by as much as 31.97 percent. Later, during the European session, the upside bias got exhausted, leading to a minor slip in the Holo market. The HOT/USDT rate fell more than 5 percent as traders with short-term risk appetite decided to book profits.
That Bullish Structure
But what short-term bulls seem to have ignored is a classic Falling Wedge breakout in play. Look again:
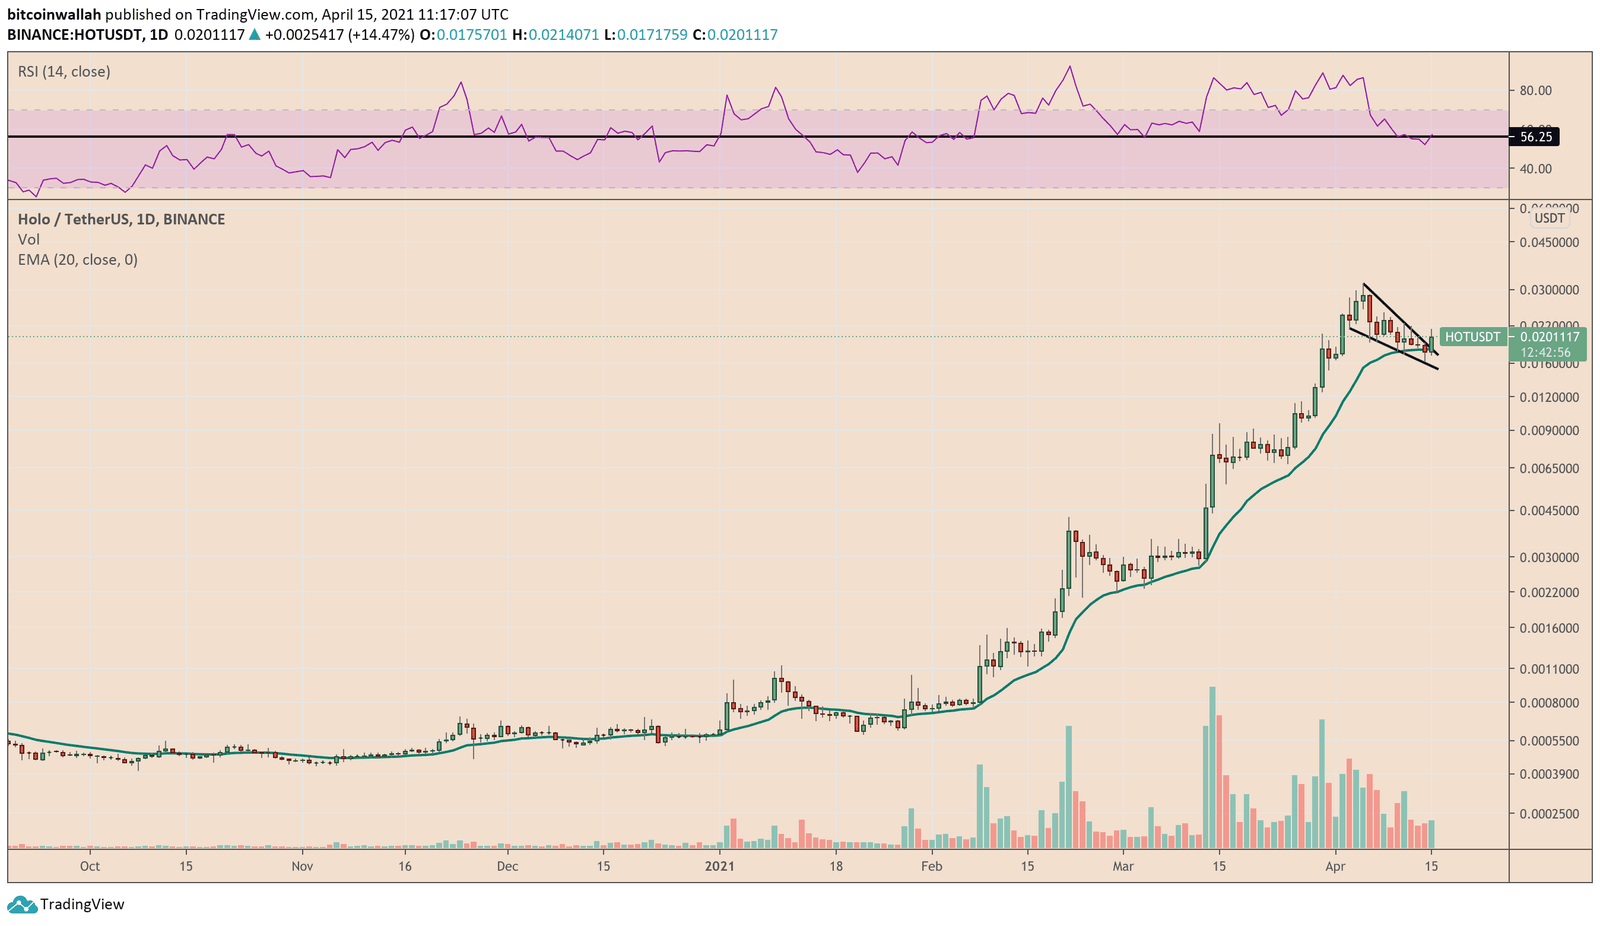
In retrospect, Falling Wedges are bullish reversal patterns. They appear when an asset starts consolidating lower following a strong uptrend. Meanwhile, as it trends downward, it leaves behind a trail of higher lows and lower lows. Typically, such a pattern leads to a breakout move to the upside. And so it appears, the Holo price is going through one, with its next upside target sitting at the Wedge top — $0.0316.
But it remains a risky upward scenario, partially because Holo has climbed too much in too little time; its year-to-date returns sit around 2,930 percent. That increases the probability of massive profit-taking among investors that have been holding HOT for months.
Bulls could play it safe by placing stop losses at places below their entry positions. They expect to at least minimize their losses should there come to a trend reversal. But overall, it appears the next safe target for HOT/USDT is near $0.023, its early April resistance.
Trade safe!
Thank you 2 Bull Photography on Unsplash for the amazing cover image.

… [Trackback]
[…] Info on that Topic: coinchapter.com/holo-hot-follow-up-risky-bullish-breakout-in-play/ […]
… [Trackback]
[…] There you will find 21725 more Information on that Topic: coinchapter.com/holo-hot-follow-up-risky-bullish-breakout-in-play/ […]
… [Trackback]
[…] Information on that Topic: coinchapter.com/holo-hot-follow-up-risky-bullish-breakout-in-play/ […]
… [Trackback]
[…] Find More on that Topic: coinchapter.com/holo-hot-follow-up-risky-bullish-breakout-in-play/ […]