
Yerevan (CoinChapter.com) — Fun fact: “Ki Holo” is a Bengali term, which translates into “what happened?”
What happened with the Holo market since June 22 can be described as ultra-bullish. The blockchain project’s native token, HOT, bounced off its one-month low of $0.0048 and rebounded by as much as 37.67%, hitting an intraday high of $0.006 this Tuesday.
Also read: Holo Price Follow Up 13: Stuck near James Bond-level as crash woes grow
The massive move uphill appeared alongside a market-wide rally, which saw almost every high-cap and low-cap coin rebounding with extremely high volatility. Like Holo, Bitcoin surged by more than 25% while its second-in-command Ethereum surged by 30.84%.
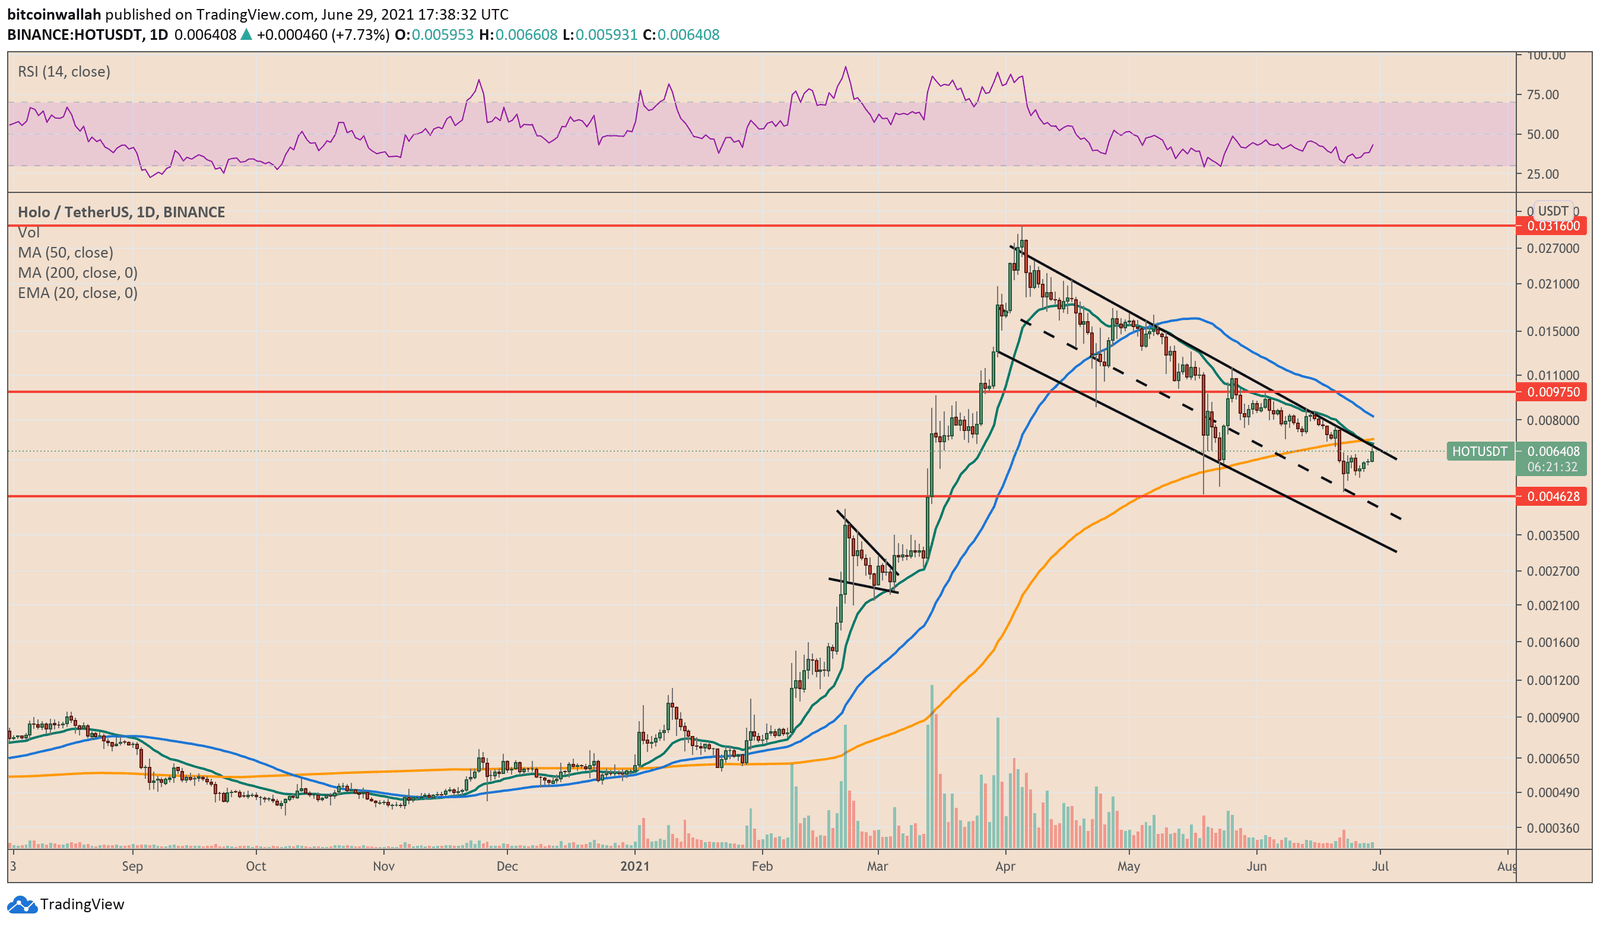
Now, the Holo token has come face to face with its multi-month falling trendline resistance that constitutes a Descending Channel. HOT/USDT majorly fluctuated inside the downward structure after topping out at $0.0316. In many of previous analysis, we discussed the pair’s potential to continue its move lower as long as it stays inside the Descending Channel pattern.
Holo pullback outlook
Meanwhile, the previous outlooks also presented certain interim pullback/bounce back levels marked in red. They almost stood accurate as HOT/USD bounced right off them more than once. For instance, on June 22, the pair rebounded after testing the red horizontal support $0.0046.
Also read: Holo Price Follow Up 14: HOT/USDT charts say it’s a “buy”
Given their historical significance, one can trust them to continue providing traders hints about potential exit/entry levels to make the best out of Holo’s ongoing price trends. For example, the token’s latest pullback from the Channel resistance could have traders open a short position towards $0.004628, while maintaining a stop loss just above the entry position to minimize risk.
Meanwhile, if the HOT/USDT exchange rate did break out above the Channel range, accompanied by a spike in volumes, then the pair could rise to at least its 50-day simple moving average (50-day SMA; the blue wave), currently near $0.008247. Breaking further upward would have traders extend their upside target to $0.009750-resistance in red.
Also read: Holo Price Follow Up 12: HOT/USDT escapes price crash thanks to Bitcoin
But given that Holo is trending lower in context of an overall cryptocurrency market reaction, its sharp rebounds could also be fake-outs. Therefore, it is advisable to keep stop losses in place against the direction of long positions to get out of the market at a smaller loss.

… [Trackback]
[…] Read More Info here on that Topic: coinchapter.com/holo-price-follow-up-14-hot-rebounds-37-67-but-sticks-to-its-bearish-outlook/ […]