
YEREVAN (CoinChapter.com) — A quick look at the Inter Milan token chart can give traders major price manipulation hints.
Inter Milan Witnessed Pump-and-Dump
As of Aug 2, the INTER price was down 2% to $1.97 on Milan day chart. But this little selloff preceded a massive dump just three days ago. Notably, on July 30, the football fan token rallied over 60% to hit $3.12, its highest level in a month, only to wipe those gains off entirely in an immediate selloff afterward.
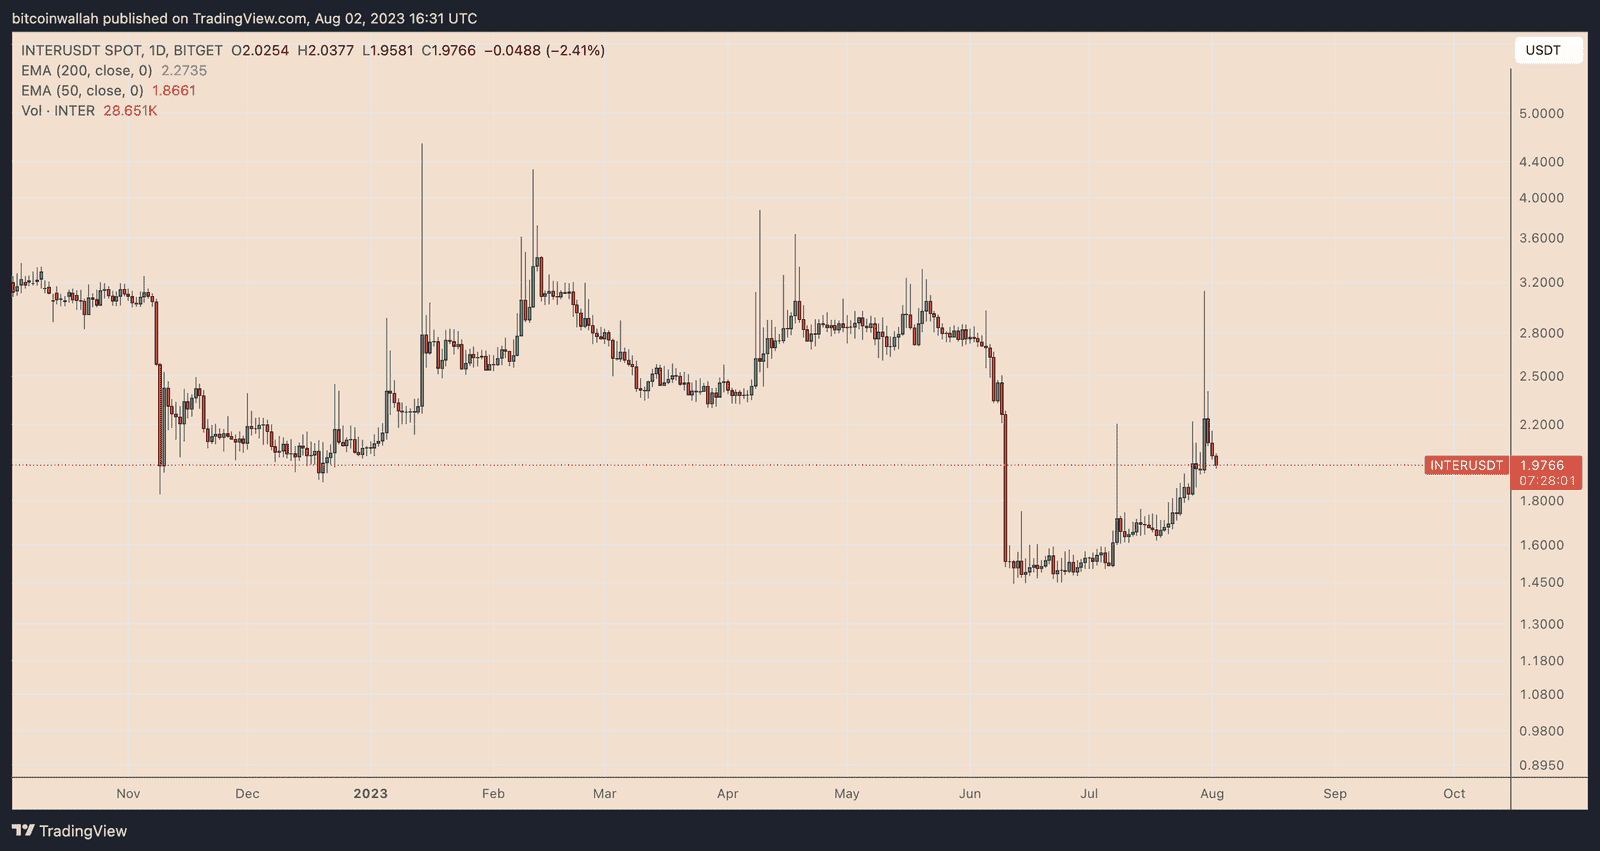
The July 30 candlestick was particularly interesting, displaying a large upside wick while accompanying negligible volumes. It shows that fewer traders participated in the massive pump, raising fears about price manipulation at the hand of some whales.
Since then, the Inter Milan Fan Token price has crashed by nearly 40%.
What Prompted Major INTER Price Pump
The INTER token enables the fans of Inter Milan, an Italian football club, to gain influence on its decisions. Moreover, the token remains open to extreme price speculations due to its listings across major centralized and decentralized crypto exchanges.
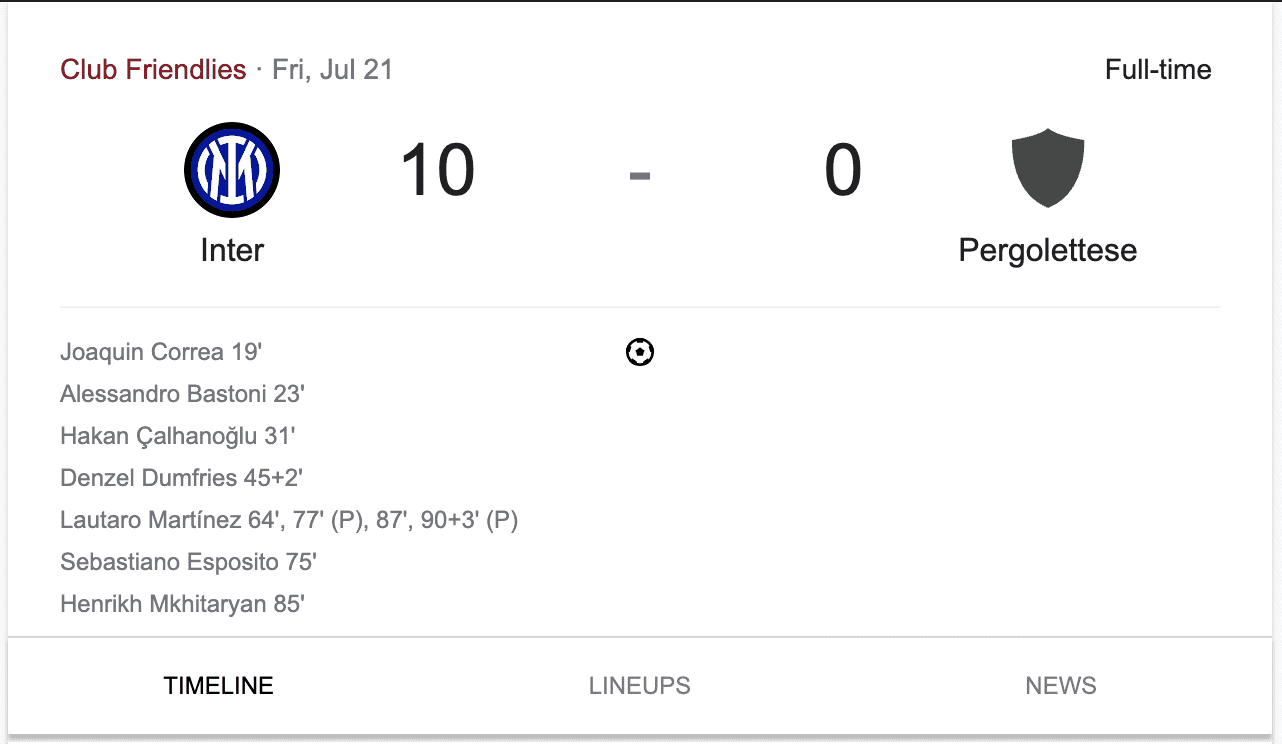
Nothing major happened around the July 30 price rally on the Inter Milan token chart. Except, on July 21, the club won against the US Pergolettese, scoring ten goals versus none. Perhaps the INTER token speculators realized the major win late, causing the price to rally nine days later.
Nonetheless, the price reaction appeared arbitrary — and may remain erratic in the coming days.
Inter Milan Day Chart Analysis
From a technical standpoint, the INTER token price can fall another 10% in August.
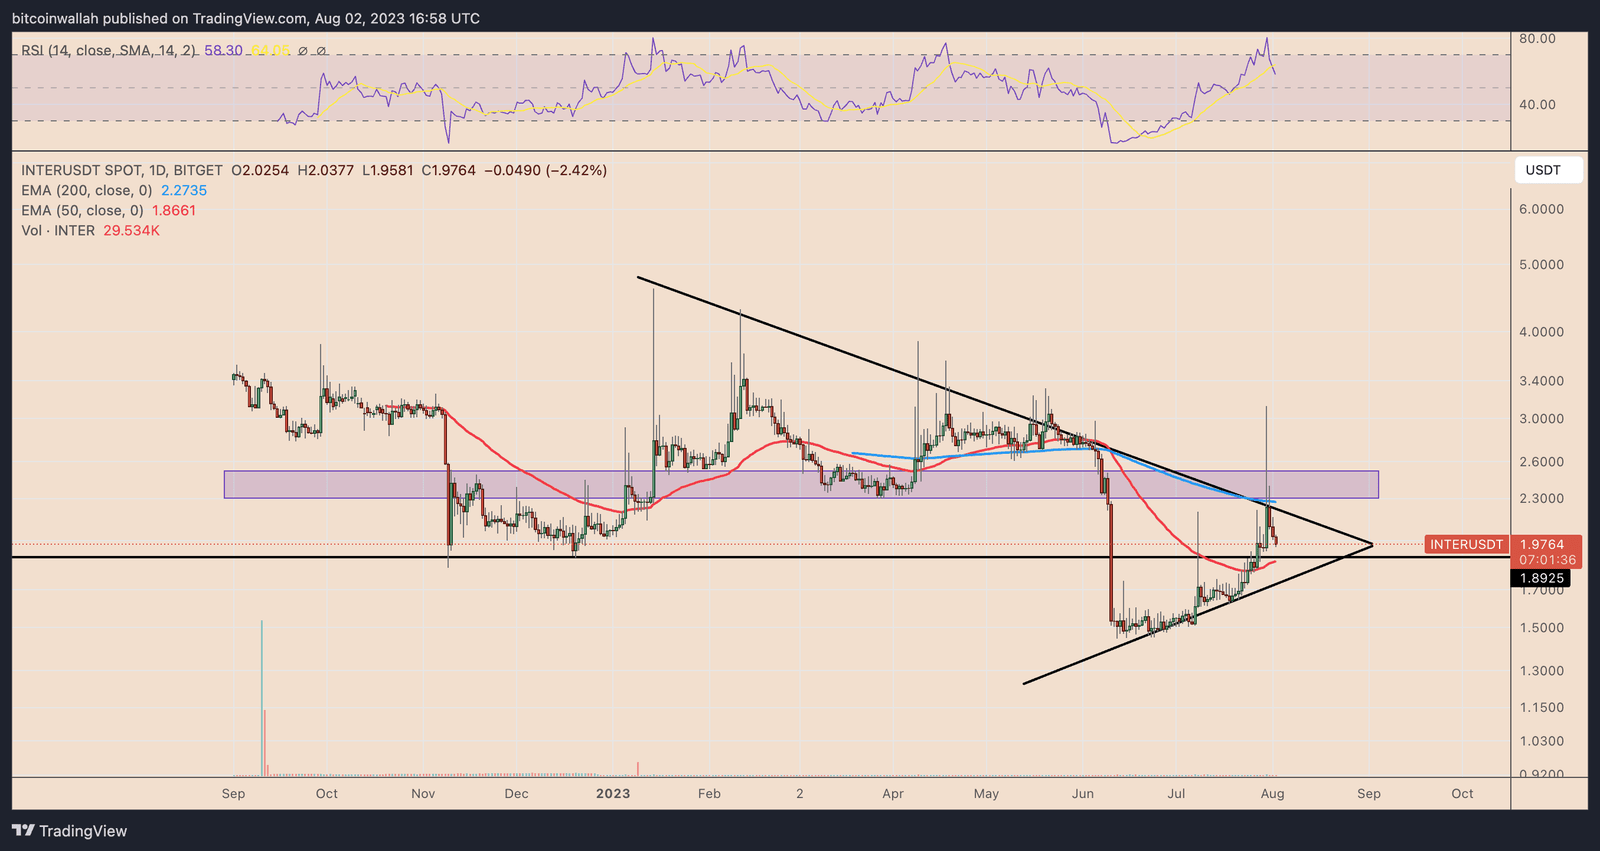
The Inter Milan day chart above shows that the price has reversed its upside course after testing a multi-month descending trendline. Now, the INTER token price eyes a decline toward the ascending trendline support near $1.75, down about 10% from current price levels.
Meanwhile, horizontal trendline support near $1.89 could limit the INTER token’s downside prospects. So, a reversal from the $1.89-support could push the price toward the $2.30-2.50 range (purple in the chart above).

… [Trackback]
[…] Info to that Topic: coinchapter.com/inter-milan-fan-token-day-chart-looks-scary/ […]
… [Trackback]
[…] Find More Information here to that Topic: coinchapter.com/inter-milan-fan-token-day-chart-looks-scary/ […]