

- What’s behind the Internet Computer Protocol rally?
- The 2h chart reveals a possible bull trap in the form of a rising wedge reversal formation
- What is next for the token in the short term?
Yerevan (CoinChapter.com) — Internet Computer Protocol (ICP), a new decentralized computing protocol developed by Zug-based DFinity, has pumped up to 83 percent since Sunday. The token traded at $49.8 in the European session Tuesday.
The ICP rally appeared after Goldman Sachs mentioned Internet Computer in its report published on June 22, rightly alongside Ripple’s XRP, Polkadot, and Ethereum in the list of next-generation decentralized platforms. The report named “The beauty is not in the eyes of the beholder” explores the crypto world and its role in a client’s portfolio.
However, it might be too early to decide on a bullish outfit for the token, even in the light of the recent rally. A closer look at its chart reveals a bearish formation.
Also read: Crypto Traders Pump Internet Computer (ICP) By 56% In A Day; Here’s Why
ICP ascending wedge
Internet Computer Protocol appeared to have been forming a rising wedge formation. In detail, Rising Wedges are bearish reversal patterns that appear after an asset trend upward while fluctuating inside two rising, converging trendlines. The price eventually breaks bearish out of the range, crashing by as much as the maximum Wedge height.
ICP/USD checks all the boxes to confirm a rising wedge setup, which increases the pair’s risks of continuing its decline in the sessions ahead.
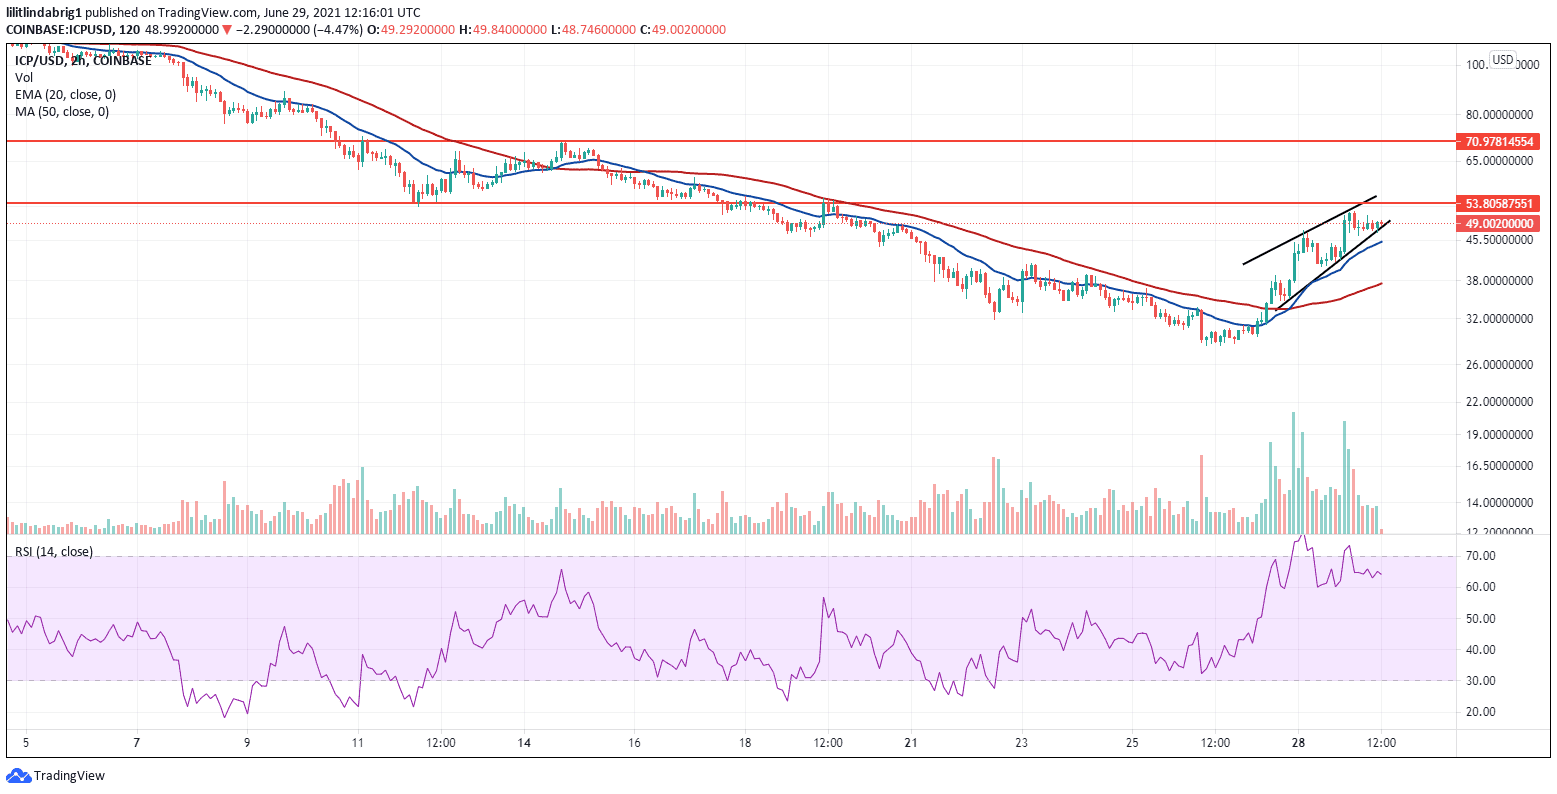
That said, should ICP manage to continue the ascend, it can retest two resistance levels at $53.8 and $70.9 as its primary upside targets.
Meanwhile, The 20-2h exponential moving average wave (EMA-2-0; the blue wave) also assisted the recent rally and formed a golden cross with the 50-day simple moving average (SMA 50: the red wave) Monday promising more gains.
In detail, a golden cross is a bullish formation, consisting of a short-term MA crossing up above a long-term MA.
If the rising wedge formation does fulfill itself as a bearish predictor, ICP would have two additional support margins to retest. Both the $32.1 line and the $28.2 prevented declines during the past week.
Also read: ICP posts 45% rebound after nosediving massively
What to expect?
The ICP token is rather new and was launched on May 7. Internet Protocol took the crypto market by storm, jumping right into the top 10 cryptos by market cap shortly after the launch. It traded at $178 per token at the end of May, but the price has steadily declined since.
It is not yet clear if ICP will hold the rally much longer, given that it was fueled only by the mention in the Goldman Sachs report. The chart showed a bearish rising wedge reversal pattern, which indicates short-term losses. However, the golden cross between the EMA-20 and the SMA-50 might suggest an upcoming bullish continuation.
The sessions ahead will show if ICP continues the bullish rally, or adopts a bearish sentiment.
Also read: Mexico central bank threatens pro-Bitcoin billionaire with sanctions

… [Trackback]
[…] Find More Information here to that Topic: coinchapter.com/internet-protocol-icp-pops-83-in-the-latest-recovery-rally-a-bull-trap/ […]
… [Trackback]
[…] Find More on to that Topic: coinchapter.com/internet-protocol-icp-pops-83-in-the-latest-recovery-rally-a-bull-trap/ […]
… [Trackback]
[…] There you will find 89859 more Information to that Topic: coinchapter.com/internet-protocol-icp-pops-83-in-the-latest-recovery-rally-a-bull-trap/ […]