
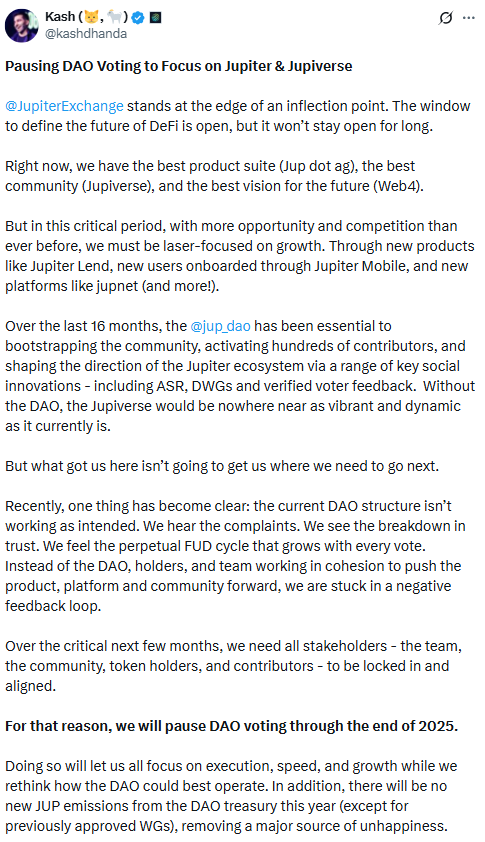
Jupiter, the Solana-based decentralized exchange (DEX) and aggregator, has paused all JUP token voting until the end of 2025. The platform announced the decision, citing community fatigue, rising conflicts, and negativity. As a result, no new governance proposals will be introduced, and the DAO Treasury—called the Litterbox Trust—will remain closed until 2027.
A core team member, @kashdhanda, confirmed that Jupiter will shift its focus toward building products instead of governance. The freeze includes all DAO voting activity and reward emissions. It also ends JUP token minting for governance-related incentives.
DAO Conflict Prompts Pause
Jupiter’s voting system had become a key part of the JUP token’s utility, used for both major and minor decisions. One of the largest events—the Jupuary airdrop—sparked disputes among different user groups. The team acknowledged that the governance model led to divisions between long-time holders and newer participants.
According to the update, the DAO will return in 2026 with a restructured governance model. Until then, no new JUP-based proposals or emissions will take place, except for one final airdrop of 700 million JUP tokens in the second part of the Jupuary event.
With governance paused, Jupiter plans to concentrate on building and improving its DeFi ecosystem. The platform will prioritize trading, swaps, and lending features on Solana. Despite slowing activity earlier this year, Jupiter has seen a slight recovery since June.
Currently, Jupiter holds over $2.27 billion in total value locked (TVL) and produces around $1.6 million in daily fees. In the past month, the DEX generated more than $17 million in revenue. The platform also hosts up to 80,000 daily swaps from about 18,000 traders.
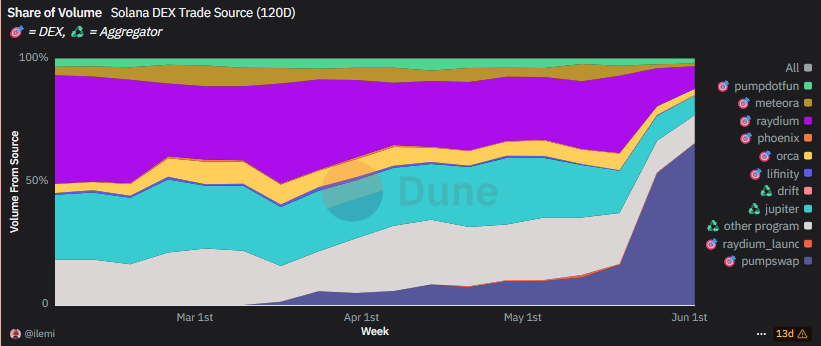
Aggregator Loses Market Share to PumpSwap
Although Jupiter remains a leading Solana DEX, it has lost traffic in recent months. PumpSwap now controls over 65% of meme token trading volume. In contrast, Jupiter’s aggregator handles about 7.8% of Solana DEX traffic.
Data shows a 60% drop in active wallets on the aggregator, largely due to a shift in meme token activity. Platforms like SolFi, OpenBook V2, Orca, and Meteora contribute most of Jupiter’s current traffic, while Pump.fun accounts for just 0.3%.
Jupiter’s staking product, jupSOL, will remain active. The DAO will still distribute 50 million JUP tokens to stakers, even without active voting. However, workgroup budgets are now frozen, and no new token minting will be proposed until governance resumes.
The Jupiter team says its main goal is to rebuild the DAO in 2026 with clearer rules and a more effective structure. Until then, it will focus on strengthening its DeFi offerings across the Solana ecosystem.
Jupiter Forms Rising Wedge Pattern, Signals 23% Drop to $0.36
As of July 3, 2025, the JUP/USDT chart shows a rising wedge formation. This bearish pattern developed after the token rebounded from its June 23 low and rallied along converging trendlines. Currently, Jupiter (JUP) trades at $0.47.
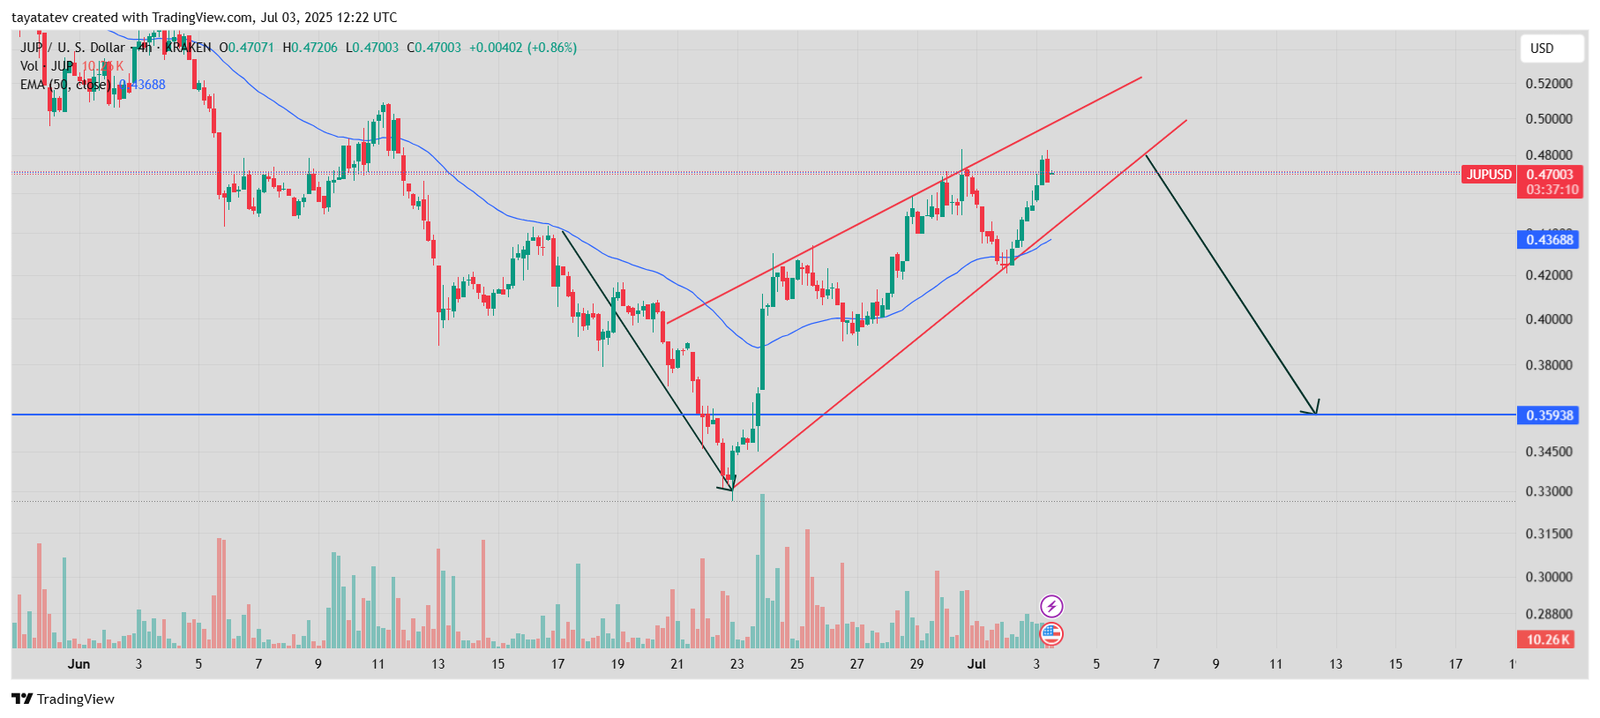
A rising wedge is a technical pattern where price moves upward within narrowing trendlines, often leading to a sharp breakdown.
If this wedge breaks down, the price may fall nearly 23% from the current level, targeting support at $0.35938. This level aligns with the horizontal blue line and served as a key base during the June bottom.
Volume also supports the breakdown scenario. The recent uptrend came with lower trading volume, while the June 23 bounce showed a higher-volume reversal. This divergence often strengthens bearish outcomes in wedge formations.
In addition, the price now sits above the 50-period exponential moving average (EMA), but any breakdown could pull JUP below this short-term support, triggering more sell pressure.
Until now, the wedge has not confirmed a breakdown. However, if the lower trendline breaks with strong volume, bears may push the price toward $0.36 quickly.
Jupiter RSI Nears Overbought Zone, Signals Weakening Momentum
The Relative Strength Index (RSI) chart for Jupiter (JUP) shows the RSI (14) currently sitting at 59.86, with its signal line (moving average) at 53.62, as of July 3, 2025.
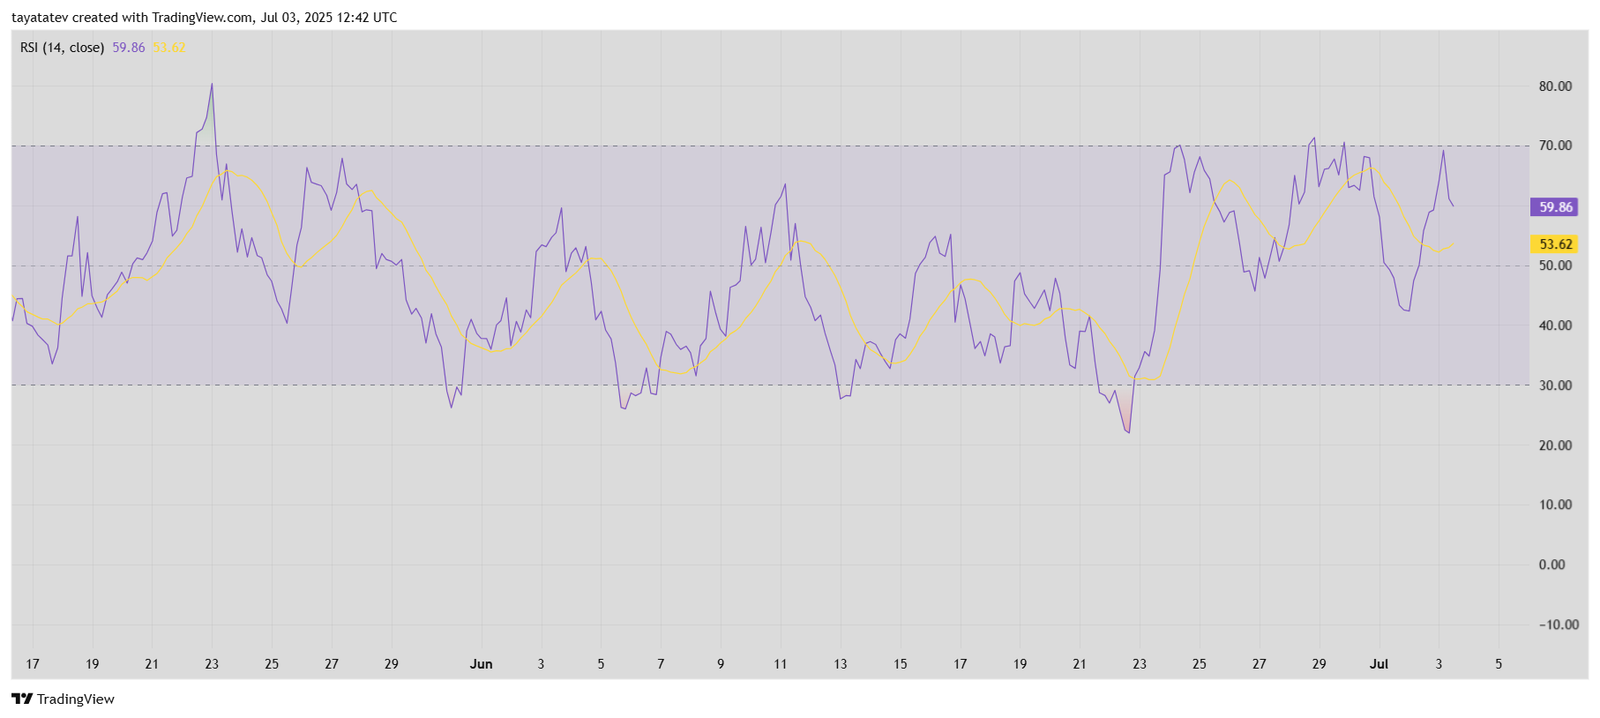
The RSI (Relative Strength Index) measures the speed and change of price movements, ranging from 0 to 100. A reading above 70 suggests overbought conditions, while below 30 indicates oversold.
Although JUP’s RSI remains below the overbought threshold, it shows signs of reversing after peaking near 70. This shift hints at weakening bullish momentum. The purple RSI line already turned downward while the signal line flattens, suggesting potential exhaustion in buying pressure.
If the RSI continues lower and breaks below its signal line, it may confirm a bearish divergence. Combined with the rising wedge pattern seen on the price chart, this supports the case for a potential price drop toward $0.36.
In short, RSI signals cooling momentum. If selling picks up, price action may follow RSI lower.
Jupiter (JUP) Price Chart in INR Shows Recovery After June Low
The Jupiter price chart in Indian Rupees JUP/INR shows key price movements between April and early July 2025. The token peaked near ₹58 in late May and then declined steadily throughout June, reaching a local bottom near ₹30 around June 24.
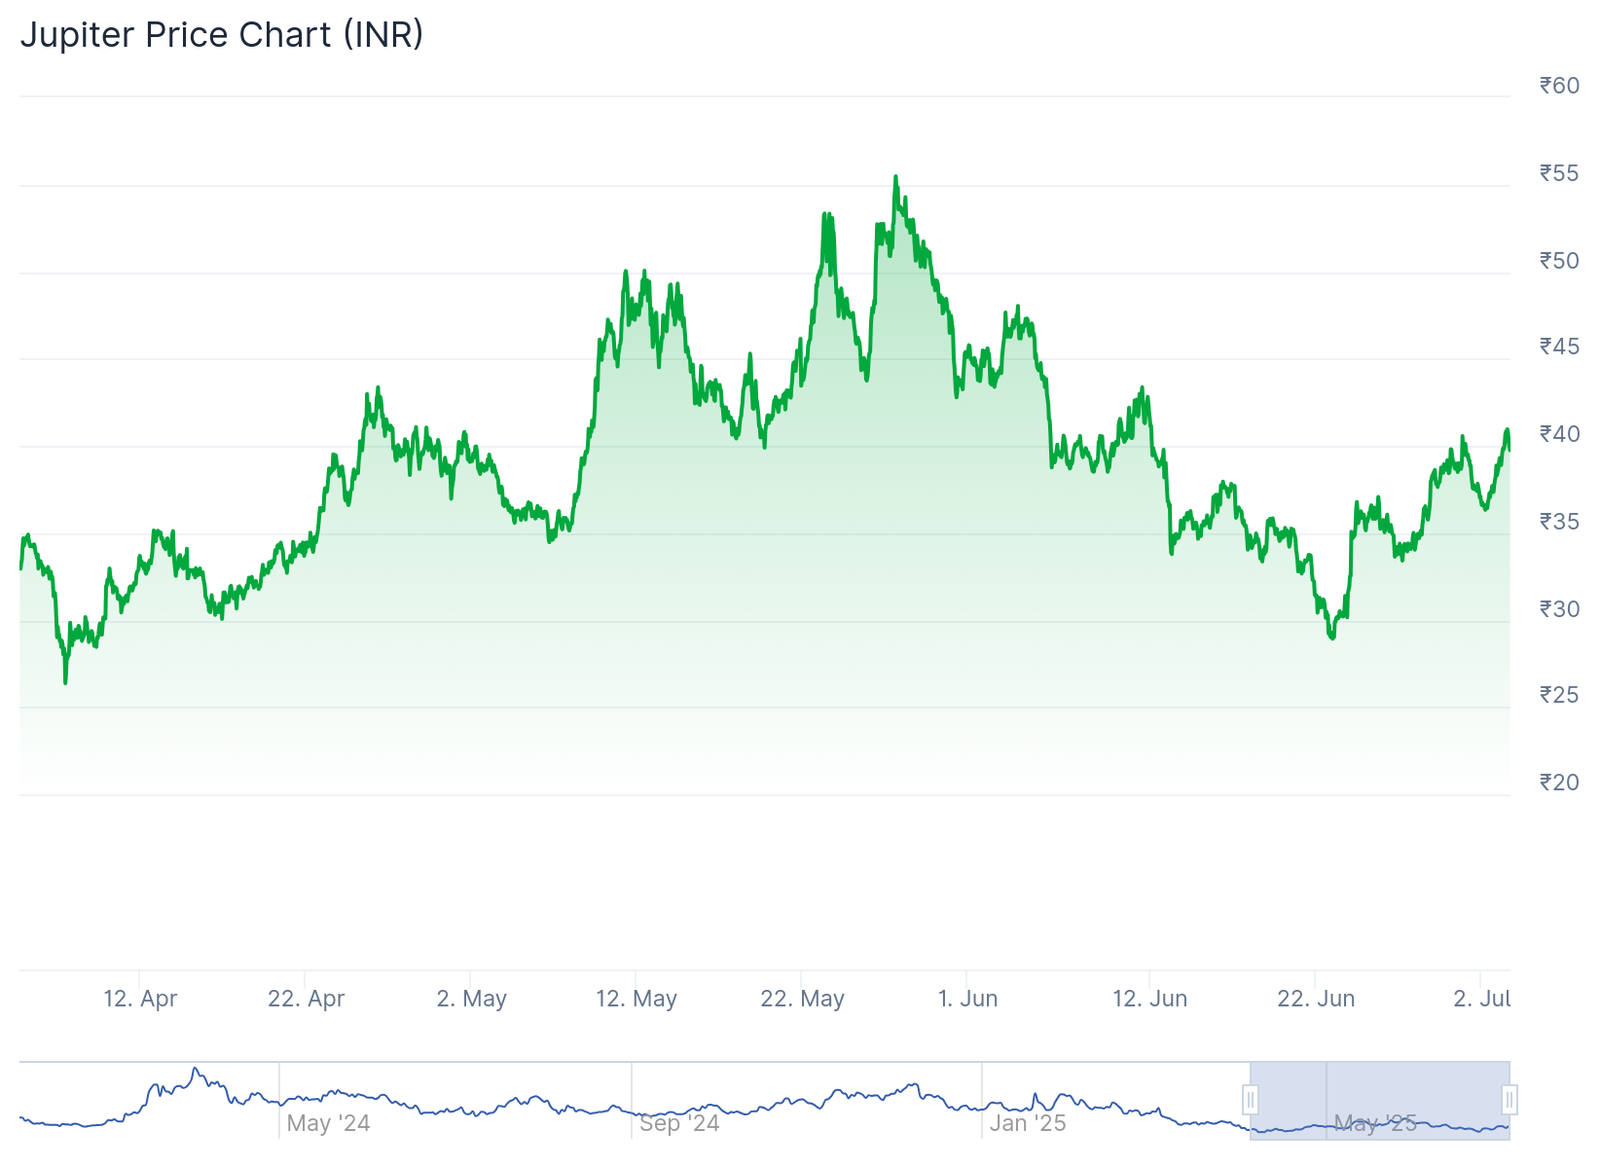
After hitting this low, JUP began a recovery phase. As of early July, the price has climbed back above ₹40, marking a rebound of more than 30% from the June low.
The chart also shows repeated short-term peaks around ₹50–₹58 through May, followed by steep drops. These cycles suggest high volatility in the token’s INR valuation. The most recent bounce aligns with technical signals visible in USD charts, including a wedge pattern and a reversal from oversold zones.
If the recovery holds, ₹45–₹48 may act as the next resistance range. However, any renewed selloff could push the token back toward the ₹35–₹30 support zone.
This INR chart reflects broader trends from the USD pair, confirming strong correlation between global market sentiment and regional pricing.
