
NEW DELHI (CoinChapter.com) — Data indexing protocol The Graph’s native token GRT prices have formed a bullish technical pattern called the falling wedge.
Two converging trendlines with a negative slope connecting swing highs and swing lows form the pattern. Prices bounce between the converging trendlines until the asset breaks out. High trading volumes confirm the breakout.
GRT prices tried to break out of the pattern in early Nov last year, but prices pulled back inside the pattern, indicating it was a fakeout.
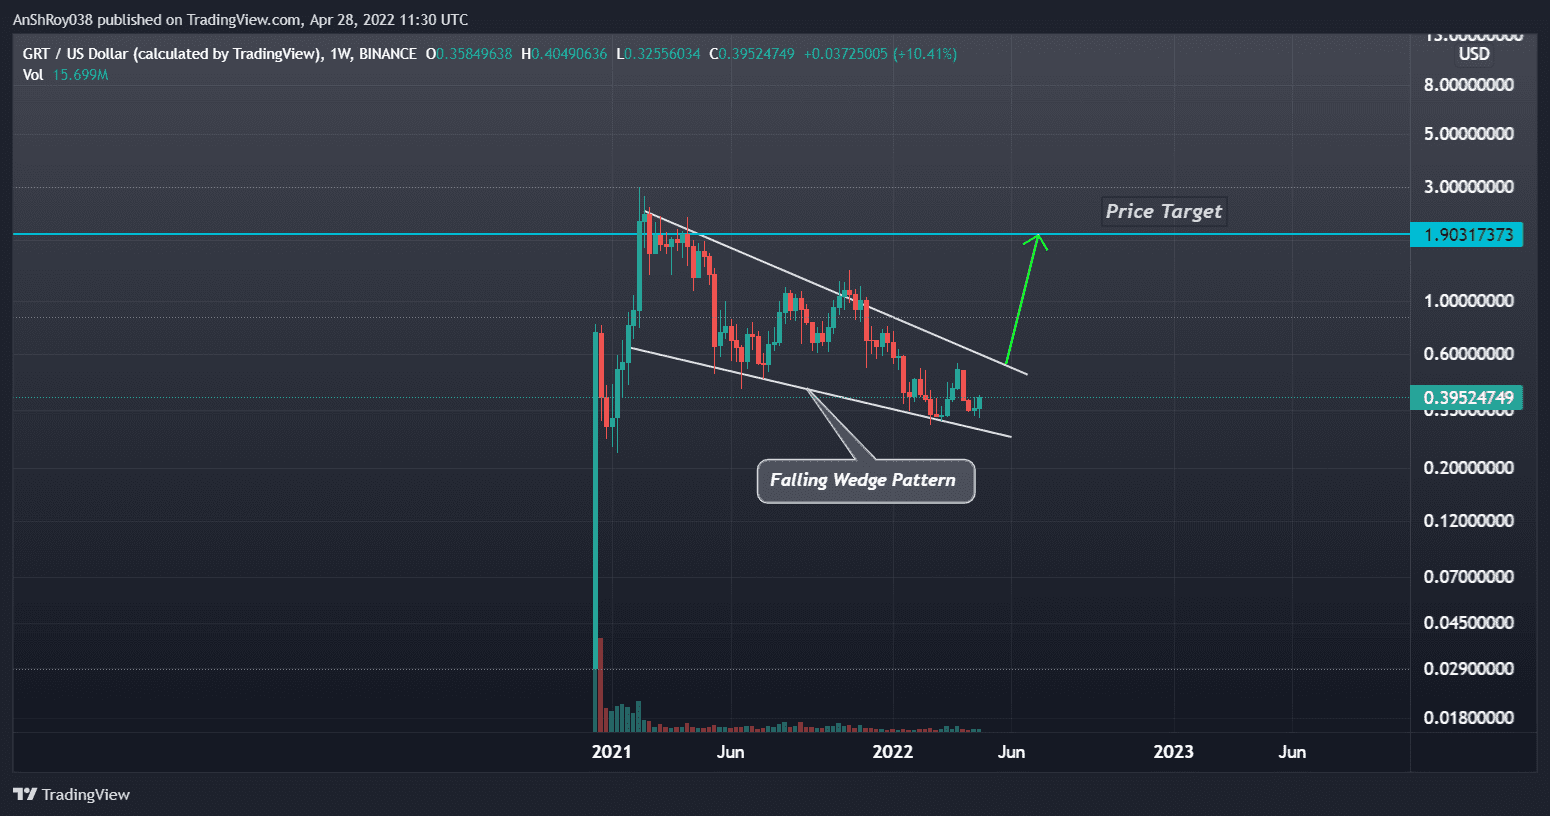
The upside target for the breakout is equal to the maximum distance between the falling wedge’s upper and lower trendlines.
Also Read: KAVA eyes 137% gains as it breaks out of bullish pattern.As such, GRT has a price target of nearly $1.9, a jump of more than 381% from the current price level. A jump to $1.9 would take GRT prices to a new all-time high. Graph prices would need to consolidate above $1.2 before moving further.
GRT Price Charts
GRT prices pushed past their 20-day moving average (red wave) after jumping nearly 9% intraday on Wednesday. Graph prices continued the uptrend on Apr 28, jumping nearly 12% between the intraday low ($0.36) and high ($0.402) levels.
However, GRT’s 100-day MA (purple wave) seems likely to move under its 50-day MA (yellow wave), forming a bearish pattern called the death cross. Traders often consider the pattern a signal of negative market sentiment.
If GRT prices complete the pattern, Graph prices might fall to support from their 20-day MA (red wave) near $0.363. A marketwide sell-off could push GRT prices near $0.34, a price level that acted as support for the GRT token price action since Mar 14.
Finally, GRT has support near $0.315, a price level that remains unbroken since Jan 14, 2021.
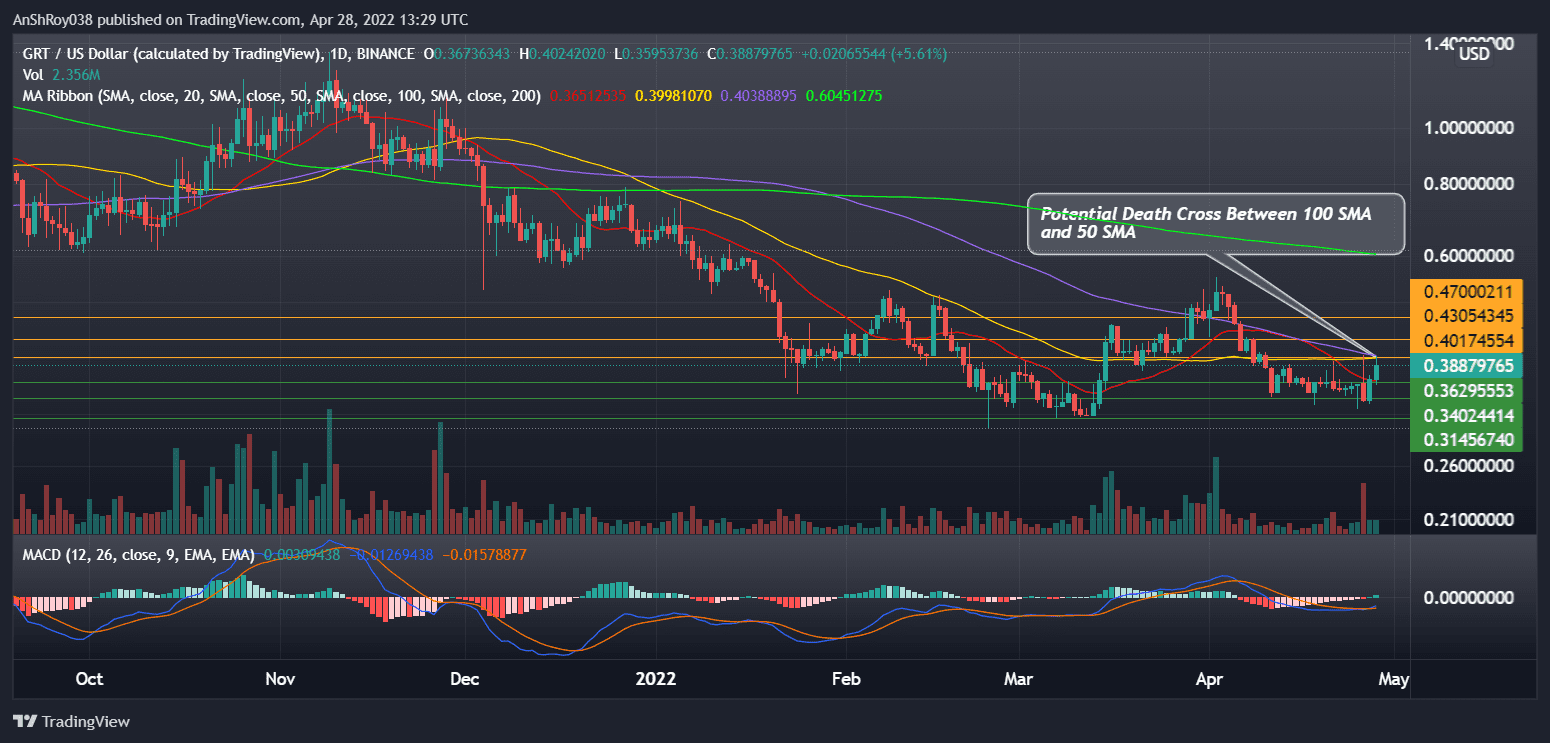
Meanwhile, trend-based momentum oscillator MACD charted a bullish crossover for GRT prices on Apr 27.
In detail, a bullish crossover occurs when the MACD line (difference of 12-day and 26-day EMA) moves above the MACD signal line (9-day EMA of MACD). As a result, traders usually consider the chart pattern a buy signal, helping boost the asset’s prices.
Also Read: PancakeSwap (CAKE) prices jump nearly 30% in ten days.If GRT prices continue moving upwards, the token would need to flip resistance from its 50-day MA (yellow wave) near $0.402 before moving to target resistance near $0.431. A sustained uptrend might push GRT near $0.47 before prices pull back.
At the time of writing, GRT was trading at $0.389, up 5.92% on the day.

… [Trackback]
[…] Find More Info here on that Topic: coinchapter.com/the-graph-grt-token-might-jump-380-if-the-bullish-pattern-holds/ […]
… [Trackback]
[…] Read More on to that Topic: coinchapter.com/the-graph-grt-token-might-jump-380-if-the-bullish-pattern-holds/ […]