
NEW DELHI (CoinChapter.com) — DeFi lending platform Kava Network’s namesake token prices jumped more than 17% over the weekend to go from Friday’s $4.5 (low) to reach Apr 24’s intraday high of $5.23.
Furthermore, KAVA also broke above the upper trendline of the falling wedge pattern on Sunday. In detail, the pattern forms when a token’s price bounces between two downward sloping, converging trendlines. KAVA would need to continue its uptrend to justify its breakout.
The upside target for the breakout is equal to the maximum distance between the falling wedge’s upper and lower trendlines.
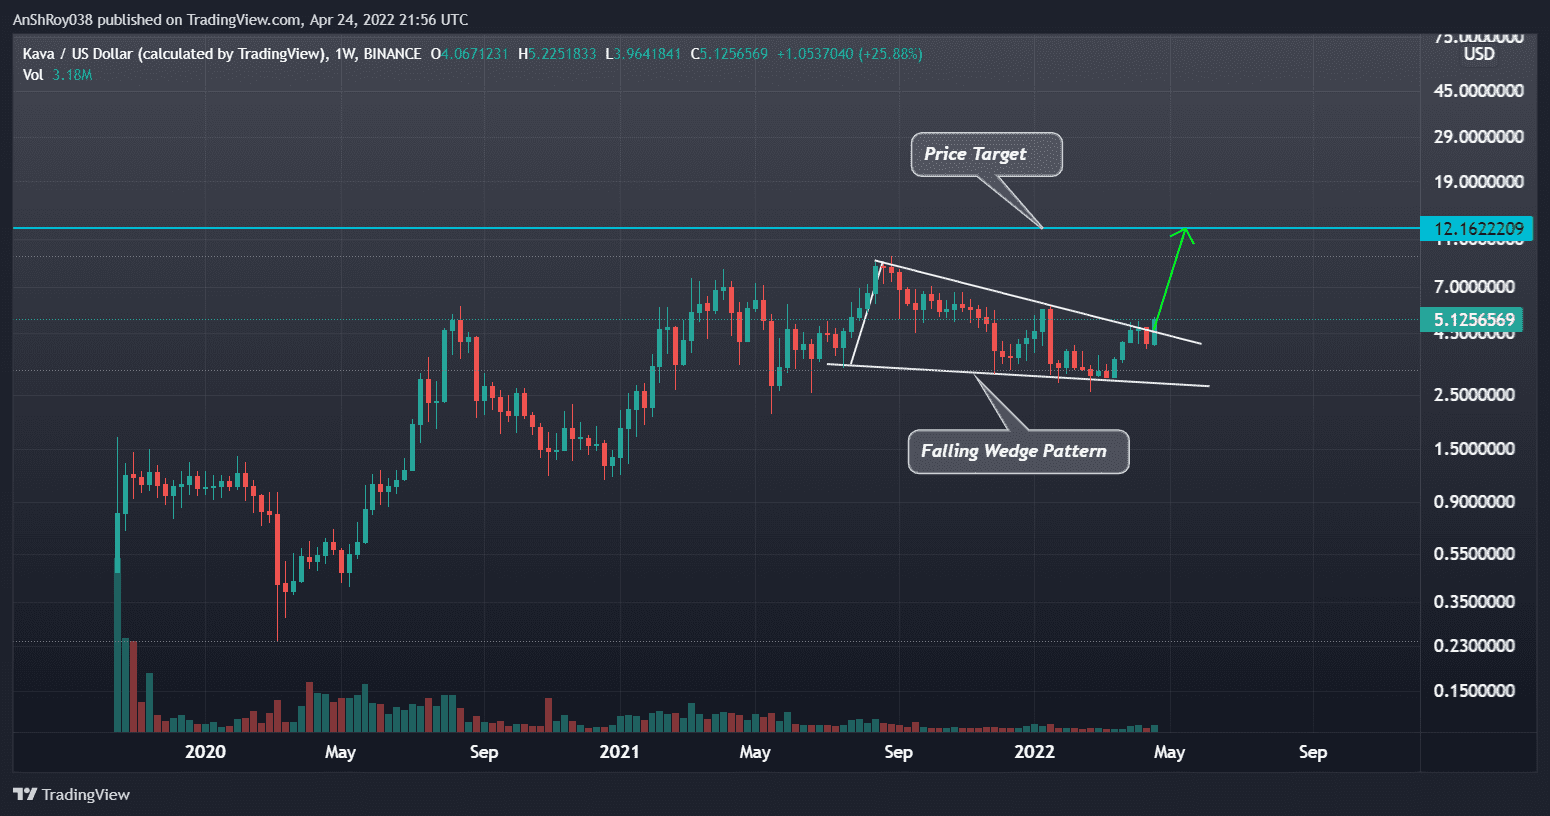
As such, KAVA has a price target of nearly $12.2, a jump of 137% from the current price level. However, The token would need to move and consolidate above the $8 resistance before it can enjoy the bullish cues from its falling wedge breakout.
In addition, KAVA’s 50-day exponential moving average (yellow wave) moved above its 200-day EMA (green wave), forming a bullish technical pattern called a golden cross. Traders and analysts usually interpret the pattern as an indicator of a definitive uptrend in the market.
Also Read: KAVA loses over 16% in two days, but bullish cues abound.The bullish cues might help the Kava token flip immediate resistance near $5.3 before moving to target resistance near $5.7. The $5.7 price level has rebuffed Kava’s uptrend since Nov 10, 2021. Finally, KAVA has resistance near $6.2, which previously acted as a resistance between Sept 24, 2021, and Nov 8, 2021.
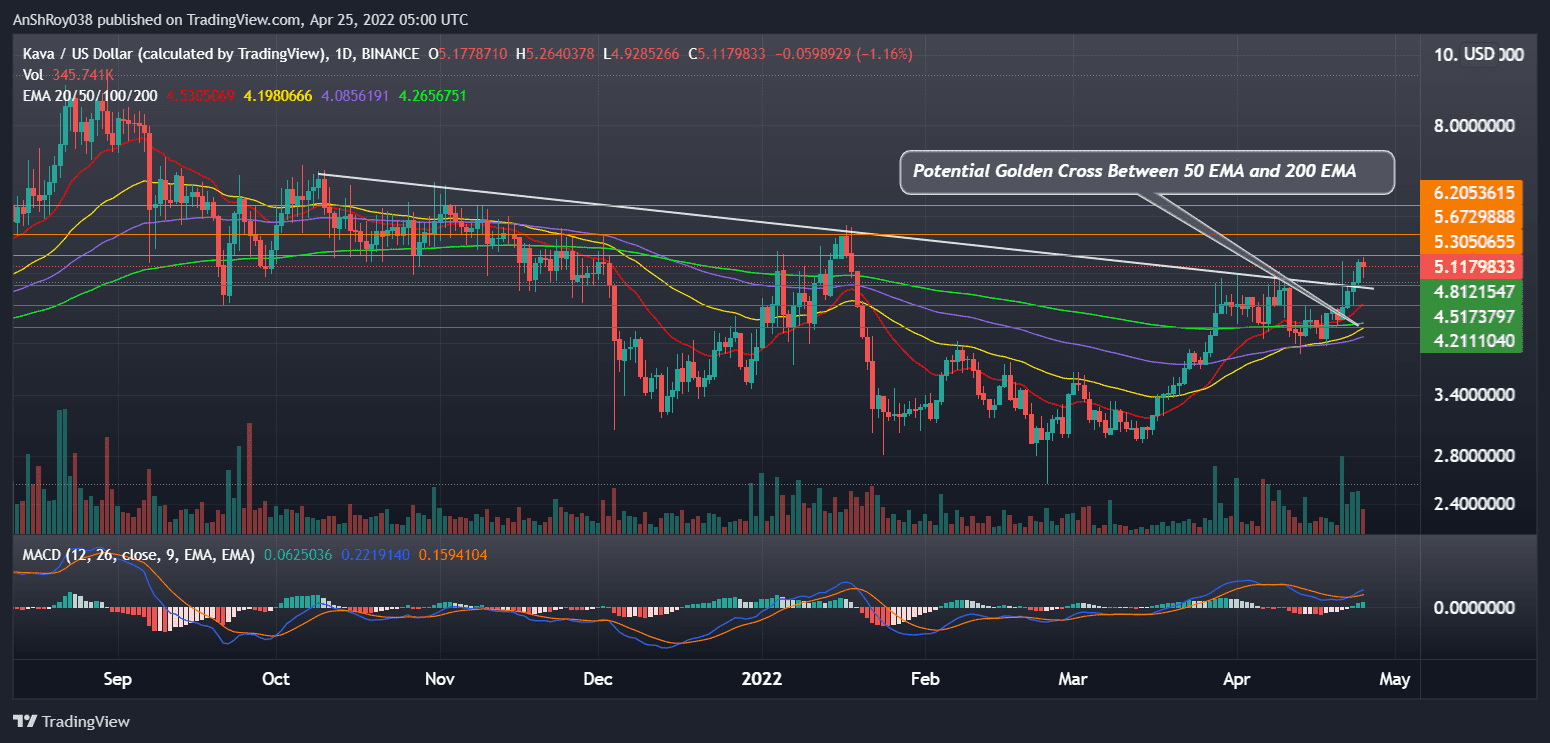
Moreover, the trend-based momentum indicator MACD charted a bullish crossover for the KAVA token on Apr 23.
In detail, a bullish crossover occurs when the MACD line (difference of 12-day and 26-day EMA) moves above the MACD signal line (9-day EMA of MACD). As a result, traders usually consider the chart pattern as a buy signal, helping boost the asset’s prices.
KAVA’s RSI Might Pullback Prices
Kava prices pulled back after the token’s relative strength index risked becoming overbought. Traders often consider an overbought RSI a prelude to an upcoming trend reversal in bears’ favor. As such, overbought RSI levels often trigger sell-offs.
Also Read: 3 reasons why Ethereum (ETH) price could rally sharply.KAVA prices reacted in a textbook manner, as its prices pulled whenever the token’s RSI reached near 70. At present, the KAVA token’s RSI is neutral, clocking 67.52 on the daily charts.
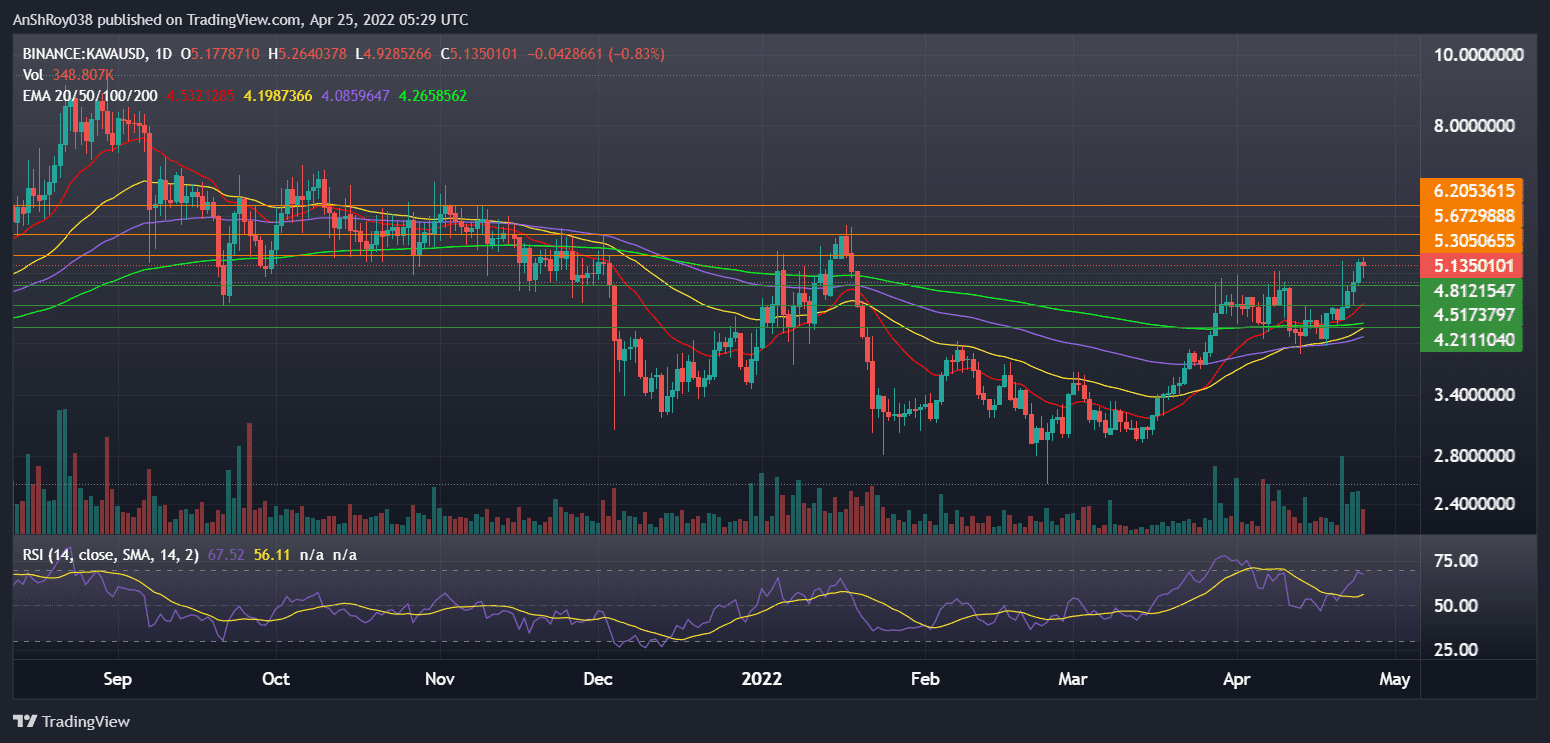
The downtrend might see KAVA prices test support near $4.8, a price level that previously acted as resistance for the token between Mar 28 and Apr 22. Further downtrend might push Kava to support near its 20-day EMA (red wave) at $4.5.
Finally, the token’s 50-day EMA (yellow wave) and 200-day EMA (green wave) form a support confluence for Kava near $4.2.
At the time of writing, KAVA was trading at $5.14, down 0.65% on the day. The token’s long lower wick suggests are bulls are aggressively buying the dip to continue the uptrend.

… [Trackback]
[…] Find More Info here on that Topic: coinchapter.com/kava-eyes-137-gains-as-it-breaks-out-of-bullish-pattern/ […]
… [Trackback]
[…] Info on that Topic: coinchapter.com/kava-eyes-137-gains-as-it-breaks-out-of-bullish-pattern/ […]