
YEREVAN (CoinChapter.com) — Ether (ETH), the native token of the largest smart contract platform Ethereum, traded just below $3,000 in Wednesday’s European session, after erasing the 15% month-to-date losses. Moreover, investment strategist and economic historian, Raoul Pal, thinks the token is primed for a bullish continuation.
He posted a Twitter thread dedicated to Ethereum’s upcoming price surge and included several technical indicators listed below.
#1 Inverse Head and Shoulder pattern for Ether
The Inverse Head and Shoulders pattern entails three consecutive dips in the price action, connected at the base with a mutual Neckline. The middle dip is the lowest and constitutes the Head. ETH completed the second Shoulder and returned to the Neckline. Thus, it is likely to break above it in the upcoming sessions.
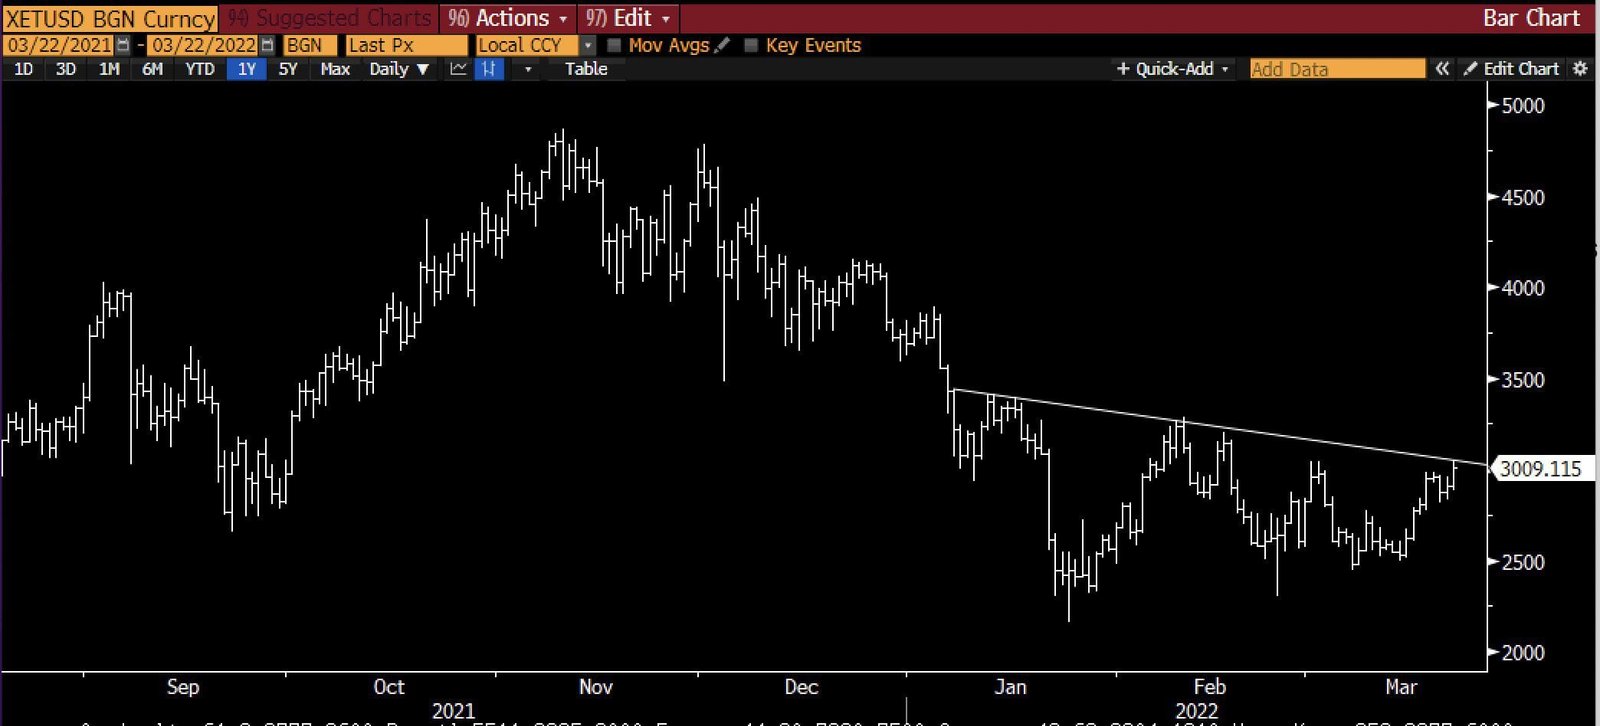
Also read: Ethereum jumps over 9% as upcoming merge adds bullish cues. If so, the potential upside move would equal the distance between the Head and the Neckline. Subsequently, ETH eyes a jump to $3,600, or 22% higher than the current value.
Meanwhile, Mr. Pal backed the Inverse Head and Shoulders pattern with a bullish reading from the Tom DeMark (TD) Sequential Indicator on the weekly chart.
#2 Ethereum Bullish TD Sequential
In detail, TD Sequential is an impulse indicator that identifies a turning point in the price trend of an asset or an index. For example, if the chart of any time frame shows nine consecutive candles above or below the closure of four candles prior, it prints a TD9. The strategist saw a favorable TD sequential reading on Ether’s weekly chart.

The probability that the inverse head and shoulder is valid is increased significantly by the Weekly DeMark 9 that is in place…nailed the low pretty much perfectly.
commented the expert. Also read: Ethereum (ETH) bobbed at over $2.5K as hackers cleaned out 3M from Deus Finance.Additionally, the weekly chart flashed a Rising Channel, which could further support the bullish claim.
#3 Rising Channel
Mr. Pal spotted the mentioned pattern on Ethereum’s weekly chart against Bitcoin. The setup entails two parallel trendlines that enclose the price action and drive it up for as long as the formation remains relevant through retests.
The Channel is neither bullish nor bearish and doesn’t forecast a specific continuation. However, it is instrumental in determining short-term price fluctuations. Thus, if the described setup persists, ETH could eye a further 30% uptrend after retesting the lower trendline.

Also read: Ethereum rallies 11% as Goldman Sachs gives clients access to new ETH Fund.ETH/BTC looks like a running consolidation and should move towards the top of flag and then break out in the due course.
commented Mr. Pal. 
… [Trackback]
[…] There you will find 44881 more Info to that Topic: coinchapter.com/3-reasons-why-ethereum-eth-price-could-rally-sharply/ […]
… [Trackback]
[…] Read More Info here to that Topic: coinchapter.com/3-reasons-why-ethereum-eth-price-could-rally-sharply/ […]
… [Trackback]
[…] Read More on on that Topic: coinchapter.com/3-reasons-why-ethereum-eth-price-could-rally-sharply/ […]
… [Trackback]
[…] Information to that Topic: coinchapter.com/3-reasons-why-ethereum-eth-price-could-rally-sharply/ […]