

NEW DELHI (CoinChapter.com) — Litecoin (LTC), a cryptocurrency similar to Bitcoin, broke out of a bullish technical pattern. Traders remained bullish on LTC’s prospects in the short term.
Crypto analyst Rekt Capital shared an LTC price chart on the monthly timeframe highlighting the Litecoin token’s breakout from the bull flag pattern. Rekt Capital noted that with the “monthly close just around the corner, it [LTC price] is well-positioned to confirm this breakout.“
The technical pattern appears when the price consolidates after a major move upside. A breakout from the pattern sends the asset’s price higher towards a profit target that sits at a length equal to the size of the previous uptrend, also called “Flagpole.”
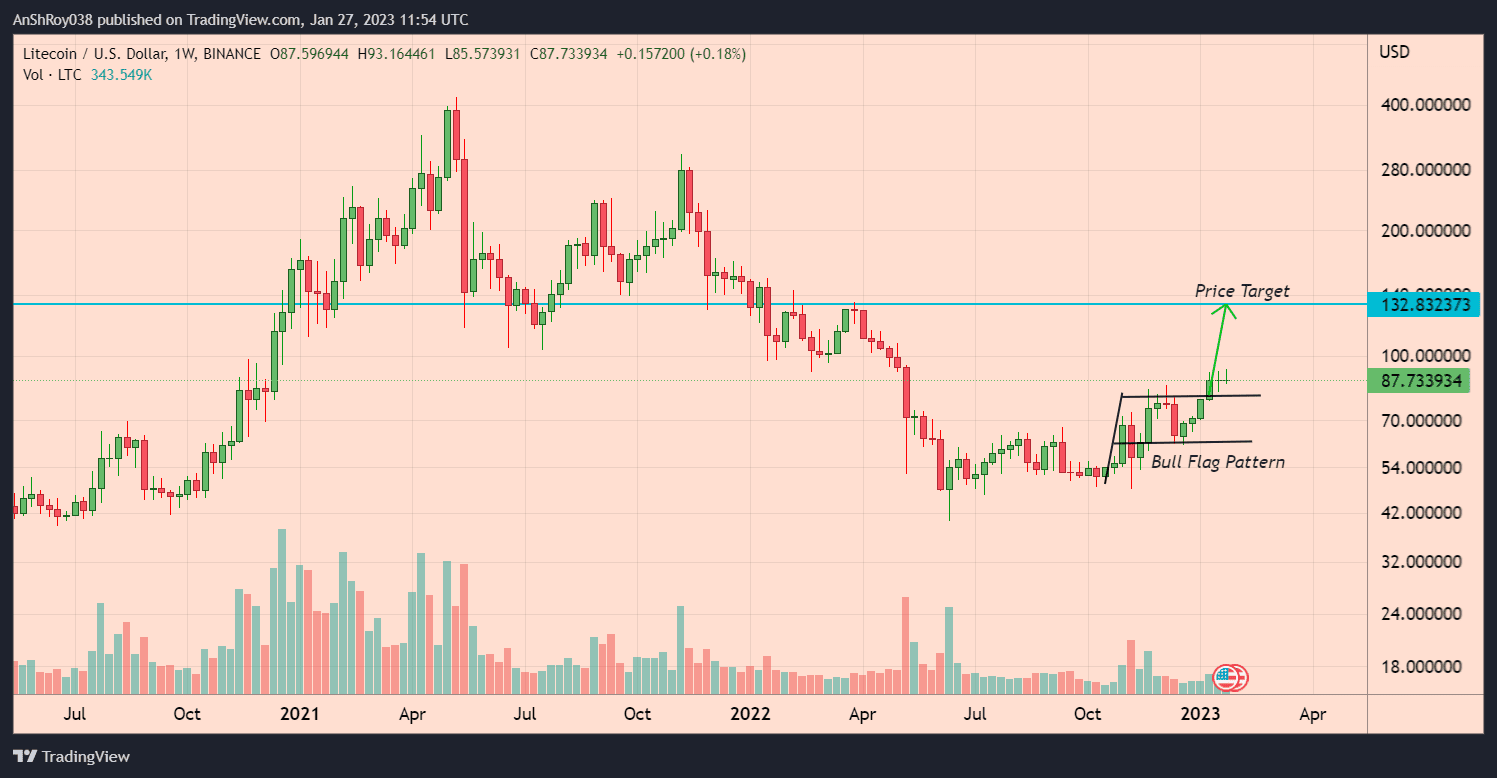
The flagpole length added to the breakout level gives a price target of nearly $133, a jump of 52% from the current price level.
Moreover, a crypto trader by the moniker Tyler told his nearly 63,200 followers that LTC price would soon reach three digits.
Also Read: Beware naive traders – another SHIB Airdrop scam!However, the bullish perspective for LTC price action was not unanimous. For example, crypto analyst and investor Lark Davis gave a list of five altcoins he would “never buy again,” which included LTC along with XRP, EOS, ETC, and NEO.
Litecoin Price Forming A Second Bullish Pattern With Massive Profit Target
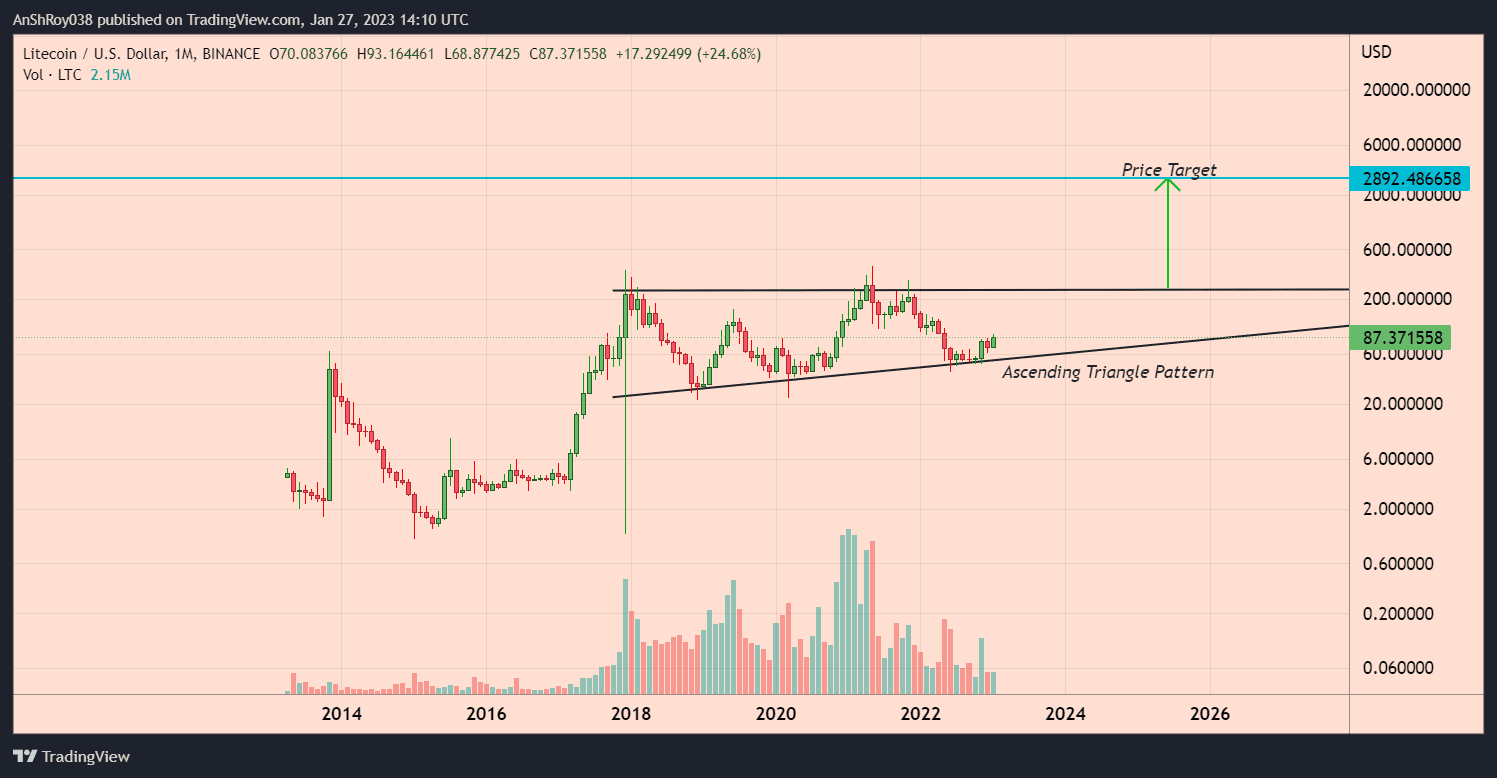
Furthermore, zooming out on the chart shows LTC price forming an ascending triangle pattern.
A horizontal trendline that connects swing highs and an ascending trendline connecting swing lows forms an ascending triangle pattern. Volume helps determine if a breakout is strong.
In an ideal world, buyers would enter the market as the trendlines close the gap. The resulting buying pressure would push prices above horizontal resistance with heavy volumes. Unfortunately, a low-volume breakout on the upside will likely fail, resulting in a pullback.
Per the rules of technical analysis, the price target for a breakout is equal to the triangle’s height at its thickest point. Therefore, LTC prices might jump 3,220% from current levels to $2,892.5. However, it might be 2030 before LTC makes a confirmed breakout from the triangle.
LTC Price Momentum Turns Bearish
The crypto market’s 2023 rally helped LTC price reach their highest level since May 2022. However, the rally seems to have fizzled out after closing at $90 on Jan 20. Long upper wicks on the recent daily candles underscore the bearish pressure against LTC price action.
On Jan 27, LTC price painted its second consecutive daily candle, dropping 2.7% to form a daily low near $85.8.
Also Read: dYdX Price Doubled YTD — But Major Selloff Troubles AheadMoreover, the momentum oscillator MACD continued to be bearish for the Optimism token. Negative bars on the MACD histogram are expanding, indicating the MACD line (difference between 12-day and 26-day EMA) is moving away from the MACD signal line (9-day EMA of MACD).

The MACD lines formed a bearish crossover on Jan 24, an indicator that traders consider a sell signal. If the selling pressure increases, LTC price might drop to test the 20-day EMA (red wave) near $84.5.
Breaching the immediate support could result in the Litecoin token price falling to test support from its 50-day EMA (purple wave) near $78.5.
Conversely, if the bull flag breakout attracts buyers to the market, LTC price might rise to target resistance near $91.24. Moreover, a break and hold above immediate resistance might help LTC price reach the psychologically important resistance level of $100 before retreating.

… [Trackback]
[…] Read More to that Topic: coinchapter.com/litecoin-ltc-price-targets-52-gains/ […]
… [Trackback]
[…] Find More to that Topic: coinchapter.com/litecoin-ltc-price-targets-52-gains/ […]
… [Trackback]
[…] Read More on that Topic: coinchapter.com/litecoin-ltc-price-targets-52-gains/ […]
… [Trackback]
[…] Information on that Topic: coinchapter.com/litecoin-ltc-price-targets-52-gains/ […]