Litecoin Eyes Explosive Breakout: $13K Network Valuation and Bullish Wedge Fuel Momentum

Tatevik Avetisyan
By Tatevik Avetisyan 6 Min Read

A long-term Litecoin (LTC) chart shared by parody account @litecoyn shows a bullish triangle pattern developing between 2018 and 2025. The image includes price candles in yellow and a superimposed blue line indicating modeled valuations. As of June 2025, Litecoin trades around $84 and appears to be breaking out of the multi-year triangle formation.

Litecoin Bullish Triangle With $13K Network Valuation TargetSource: @litecoyn on X
Litecoin Bullish Triangle With $13K Network Valuation Target. Source: @litecoyn on X

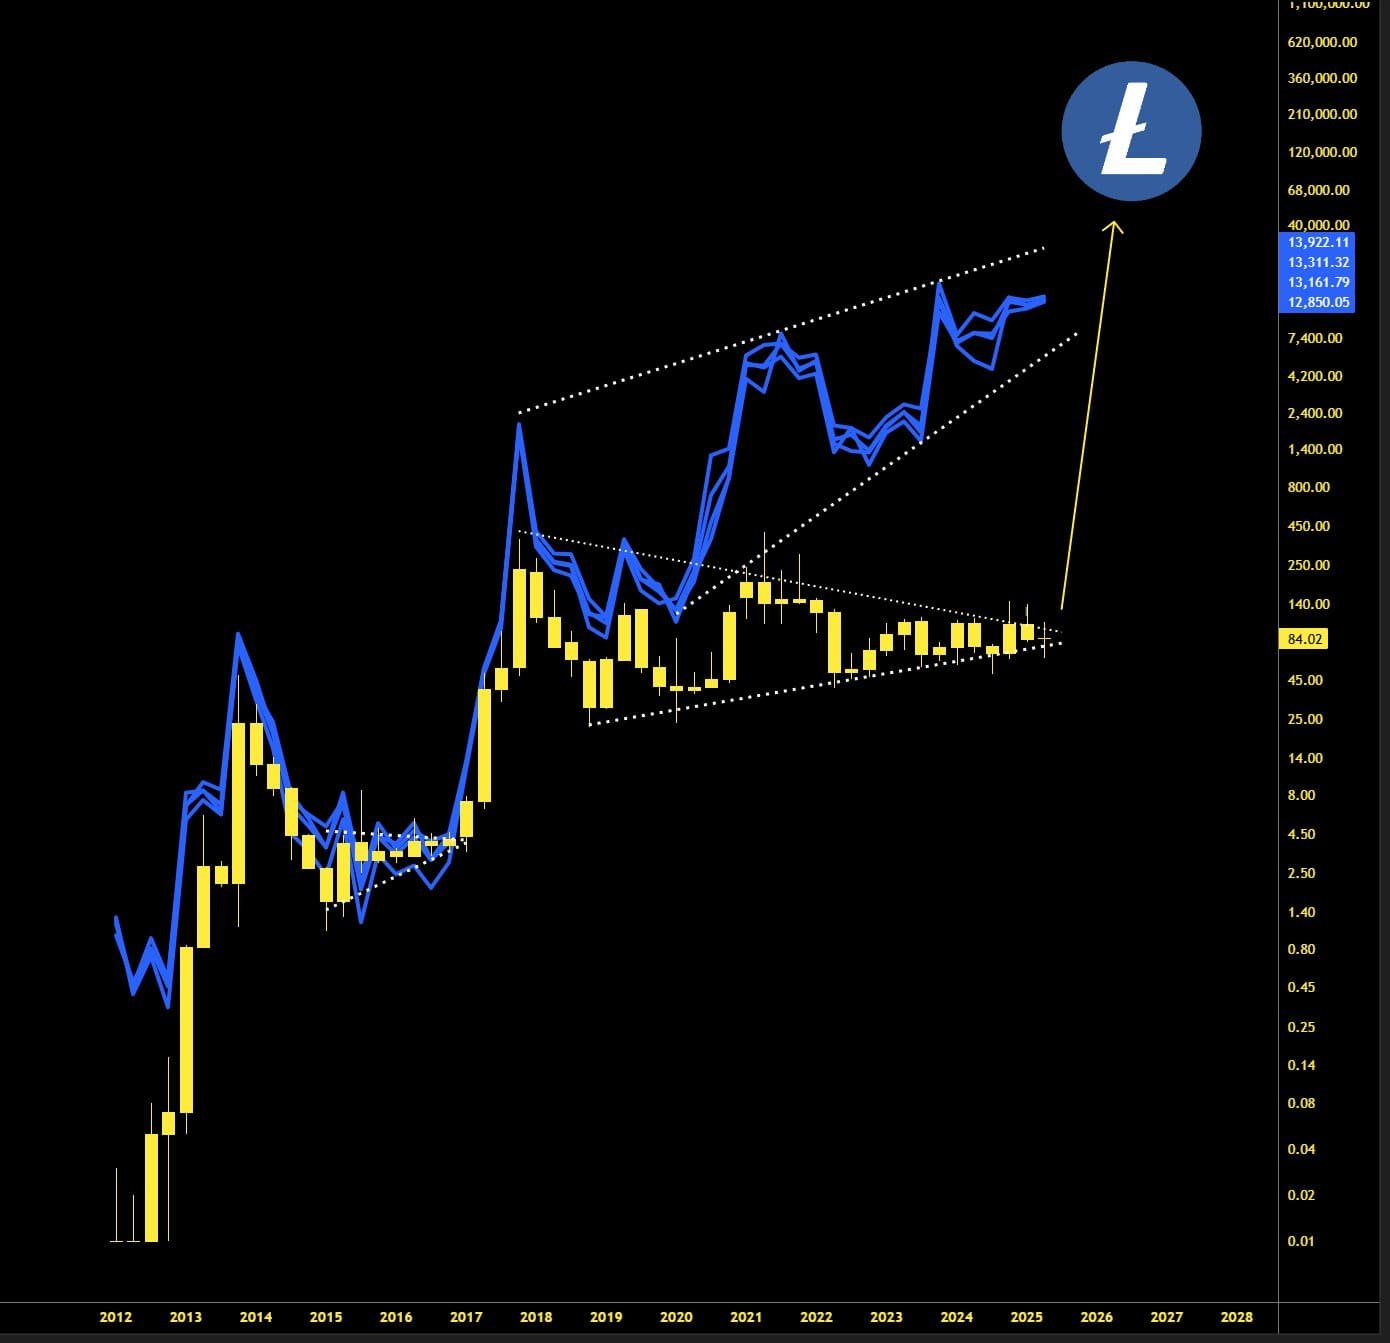
The chart covers activity from 2012 to mid-2025. After peaking in late 2017, Litecoin entered a long consolidation phase. Between 2018 and 2024, LTC formed higher lows and lower highs inside a symmetrical triangle. In 2025, the candles touch the triangle’s upper resistance, signaling a potential breakout.

- Advertisement -

The triangle structure appears clearly defined with dotted white lines. This tightening pattern often signals reduced volatility and a pending price movement once the structure resolves.

A symmetrical triangle forms when buyers and sellers reach equilibrium, creating converging trendlines. Traders interpret a breakout above the upper boundary as a bullish signal. The projected target often equals the height of the triangle’s base added to the breakout level.

In this case, the triangle spans from under $30 to over $400. If the breakout confirms, price targets may significantly exceed previous highs.

- Advertisement -

Network Model Suggests $13K Valuation

The chart includes a sharp upward arrow pointing to a target of $13,000. The account claims this target reflects Litecoin’s network valuation—not just price action. The estimate does not factor in potential viral growth from renewed attention and usage.

@litecoyn wrote:

“Everyone means well thinking Litecoin’s value right now is around 2k… but its value is worth so much more than that… today using some litecoin network data it would price litecoin at $13k. This doesn’t take into massive network effects that come to a network when its price breaks out and everyone is using it and talking about it… $LTC”

This valuation implies a gain of over 15,000% from the current level.

Litecoin Forms Falling Wedge Pattern, Targets 32% Breakout

On June 18, 2025, the 4-hour chart for Litecoin (LTC/USD) shows a clear falling wedge pattern forming between early May and mid-June.

Litecoin Falling Wedge Breakout Setup. Source: TradingView

A falling wedge is a bullish reversal pattern marked by two downward-sloping, converging trendlines.

In this case, Litecoin’s price trades below the 50-period exponential moving average (EMA), currently at $86.84. The wedge’s resistance and support lines are tightening, indicating reduced volatility and possible breakout pressure.

If LTC breaks out upward from this wedge, it could rally 32% from the current price of $85.38. That projection targets approximately $112.26, matching the measured move from the wedge’s widest point.

This setup becomes valid only if LTC closes firmly above the wedge resistance with strong volume.

Litecoin Bulls Gain Strength as DMI Flashes Uptrend Signal

June 18, 2025 — The Directional Movement Index (DMI) for Litecoin (LTC) shows growing bullish momentum, based on data published early Tuesday. The +DI line (orange) has climbed to 27.34, overtaking the -DI line (blue) at 14.18. The ADX (red), which measures trend strength, has reached 23.05—confirming a developing trend.

Litecoin DMI Trend SignalSource: TradingView
Litecoin DMI Trend Signal. Source: TradingView

This DMI crossover marks a shift in momentum. The +DI staying above the -DI signals that buyers are currently in control. The ADX moving above the 20 level shows that the trend is gaining strength after weeks of sideways movement.

If this setup holds, it aligns with the falling wedge breakout seen on Litecoin’s 4-hour chart. The indicator now supports a possible bullish continuation.

Litecoin RSI Shows Neutral Momentum After Failed Breakout

The 14-day Relative Strength Index (RSI) for Litecoin (LTC) stands at 45.00, below its moving average at 48.31. This level places RSI in a neutral zone, signaling neither overbought nor oversold conditions.

Litecoin RSI Neutral ZoneSource: TradingView
Litecoin RSI Neutral Zone. Source: TradingView

Earlier in June, the RSI attempted to push above 60 but failed to sustain momentum. Since then, the indicator has hovered between 40 and 50, showing weak conviction from both bulls and bears.

The moving average of the RSI, now acting as resistance, capped multiple bounce attempts. For momentum to strengthen, Litecoin’s RSI must cross above 50 with higher price confirmation.

This pattern suggests indecision. Unless RSI reclaims its average and breaks above 50, momentum likely remains limited in the short term.

Litecoin MACD Crossover Weakens, Bullish Momentum Fades

Meanwhile, Litecoin’s MACD indicator shows a weakening bullish crossover, as the MACD line (blue) drops to -0.52 while the signal line (orange) holds at -0.39. The histogram has turned red again at -0.14, signaling a fading bullish wave.

Litecoin MACD Trend Reversal WatchSource: TradingView
Litecoin MACD Trend Reversal Watch. Source: TradingView

Earlier in mid-June, the MACD crossed above the signal line, hinting at upward momentum. However, the latest move below the signal line reflects a shift, with buying pressure losing strength. The histogram’s decline confirms that momentum is turning flat to bearish.

For the trend to reverse upward, the MACD must regain ground above the signal line and push the histogram back into green territory.

Tatevik Crypto Journalist CoinChapter

Tatevik Avetisyan

Tatev Avetisyan is a Markets Writer and Analyst at CoinChapter, covering cryptocurrency markets, policy, and regulation. With over seven years of experience in business and marketing development, she has spent the past two years specializing in digital assets and has authored more than 2,000 articles on crypto markets and regulatory developments. She contributes as a guest writer to leading industry publications and is a prominent Web3 advocate in Armenia through Web3Armenia. Her work reflects a broader focus on artificial intelligence and Web3 technologies. Tatev maintains a diversified crypto portfolio, with Bitcoin as her primary holding above CoinChapter’s $1,000 disclosure threshold.