

NEW DELHI (CoinChapter.com) — MANTRA (OM) price gained over 100% in a week and broke the $0.30 resistance. It is now consolidating gains and aiming for another rally.
MANTRA (OM) Price Pumps Over 100%
After a bullish breakout above the $0.1920 resistance zone, MANTRA bulls gained strength for a sustained rally. OM price gained over 100% and broke many hurdles, including $0.225 and $0.300, outperforming Bitcoin, Solana, and Ethereum. It even spiked above the $0.350 resistance.
A high was formed near $0.3501, and the price is now consolidating gains. Fundamentally, MANTRA is gaining support from the cryptocurrency community. Its Co-Founder & CEO, JP Mullin, recently revealed his ambitious plans for the next two years, including expansion in Dubai and enticing bonuses for OM migration to Cosmos.
Looking at the 4-hour chart, OM price started a short-term consolidation phase and dropped toward the $0.2550 support. It seems like the price is now forming a support base for a fresh increase above the 50% Fib retracement level of the downside correction from the $0.3501 swing high to the $0.2559 low.
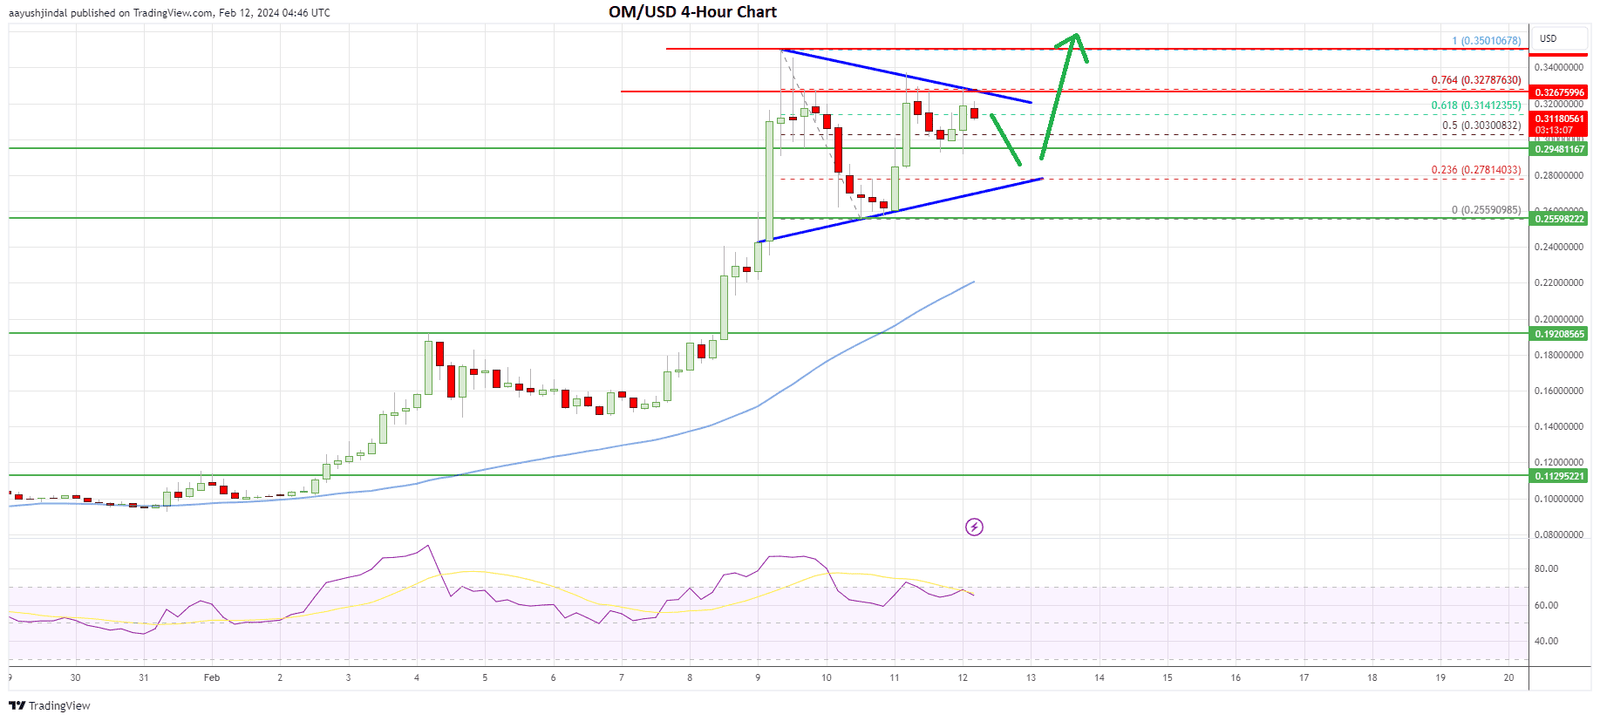
MANTA trades well above the 50 simple moving average (blue, 4-hour). A bullish continuation pattern is forming with support at $0.2780 on the 4-hour chart.
On the upside, the bears might remain active near the $0.3275 level and the triangle trend line. It is close to the 76.4% Fib retracement level of the downside correction from the $0.3501 swing high to the $0.2559 low.
A successful break and close above the triangle resistance could spark another rally. The next major resistance is near the $0.350 level. If the bulls push the price above $0.350, OM could pump another 20%-25%. The main stop for the current bull wave might be near the $0.50 zone, where the bears are likely to take a stand.
Are Dips Supported In OM?
The first support is visible near the $0.2950 level if there is a pullback. The next key support is near the triangle trend line at $0.2780. The main uptrend support sits near the curve zone or $0.2550. A daily close below the $0.2550 support could trigger a nasty decline. The price could dive toward the $0.1920 support zone in the stated case.
Overall, OM’s price is pumping above the $0.2550 pivot level. If there is a pullback, the bulls might remain active near the $0.2780 and $0.2550 levels. On the upside, the main target for the bulls could be $0.50.

… [Trackback]
[…] Read More on that Topic: coinchapter.com/mantra-om-price-doubles-in-a-week/ […]
… [Trackback]
[…] Find More Information here on that Topic: coinchapter.com/mantra-om-price-doubles-in-a-week/ […]
… [Trackback]
[…] Read More Info here to that Topic: coinchapter.com/mantra-om-price-doubles-in-a-week/ […]