

NEW DELHI (CoinChapter.com) — Meme coins Shiba Inu (SHIB) and Dogecoin (DOGE) prices have formed technical patterns that forecast opposing fortunes for the tokens. While DOGE price formed a bullish wedge pattern, SHIB price is moving inside a bearish descending triangle pattern.
The strong crypto market recovery in 2023 has turned several analysts bullish in the short term. However, Bitcoin (BTC) prices consolidating near $23,000 have fueled doubts about whether the bull run is over or if the recovery will continue.
Rumors of a Fed Pivot drive due to slowing inflation have attracted investors to risk assets like cryptos. However, investors remain vigilant of the long-term prospects of the ongoing crypto market recovery.
Shiba Inu (SHIB) Forms Descending Triangle Pattern
Shiba Inu, the sector’s second-largest meme token by market cap, formed a bearish technical pattern called the descending triangle.
The descending triangle is a bearish continuation setup with a falling resistance line that caps upside attempts and a flat support that prevents declines. The height of the triangle’s thickest section determines the price target in a descending triangle setup.
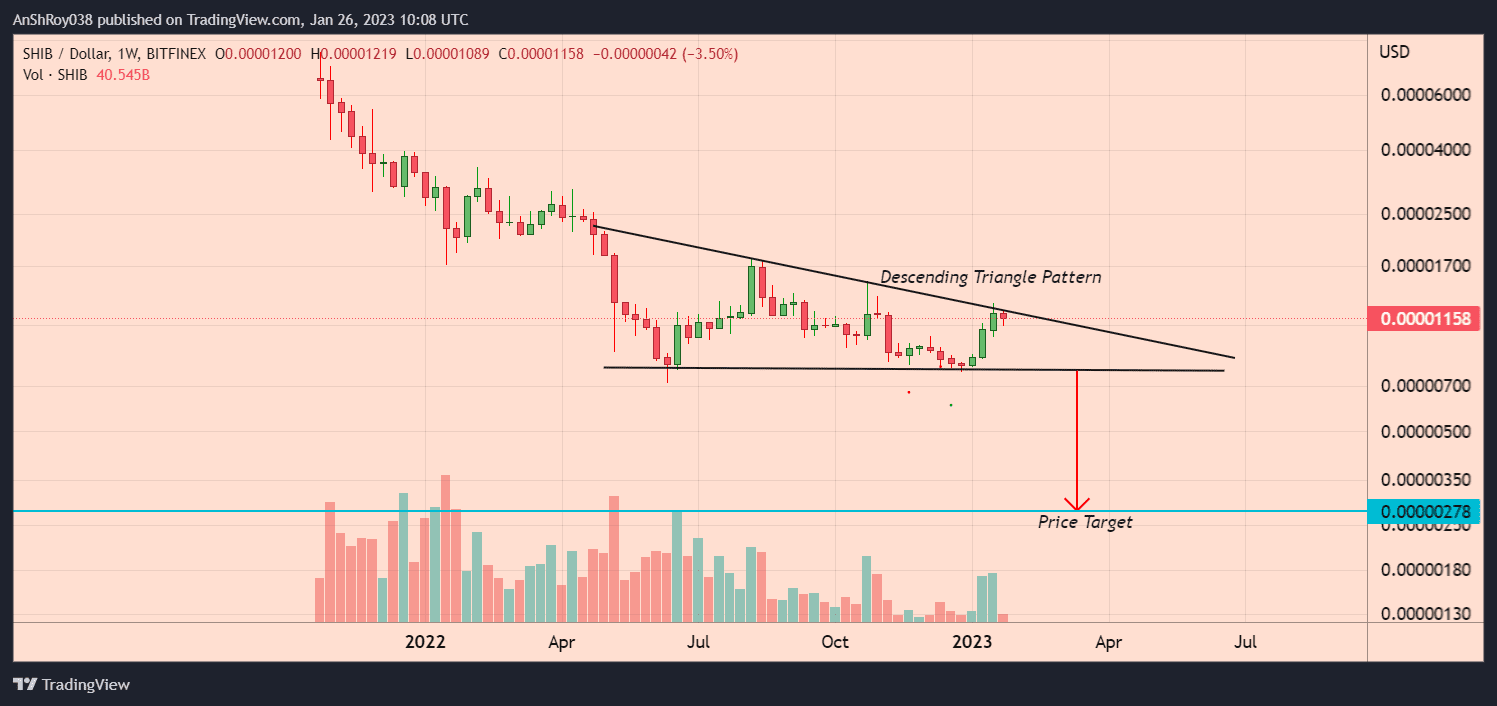
Currently, SHIB is testing the falling resistance trendline of the pattern. If SHIB price breakdown with high volume and confirms the pattern, the meme coin price might drop nearly 76% from current levels to reach $0.0000028 before recovering.
SHIB: Momentum Turning Bearish For The Meme Token
Meanwhile, SHIB price spiked 38% from Jan 1 to a monthly high of $0.00001293 on Jan 18. The meme coin rode on the back of the wider crypto market recovery. However, the Shiba Inu token’s price rally fizzled out as SHIB price fell by 6.8% on Jan 24, when the market shed $27 billion overnight.
Also Read: ETH/BTC: Ethereum Price Turns Sell on Rallies Vs BitcoinOn Jan 26, SHIB price dropped nearly 3.3% to form a daily low near $0.00001148. However, the recent rally has prepped Shiba Inu’s 50-day EMA (purple wave) to needle above the meme coin’s 100-day EMA (blue wave) to form a bullish pattern called the golden cross.
The golden cross might make SHIB price bullish in the short term, attracting buyers. Hence, the meme coin might target resistance from its 200-day EMA (green wave) near $0.000012.

Breaking and consolidating above the 200-day EMA resistance could help SHIB price reach resistance near $0.000013 before downside corrections pare gains.
The momentum oscillator MACD is forecasting bearish signals for the Shiba Inu token. Positive bars on the MACD histogram are contracting, indicating the MACD line (difference between 12-day and 26-day EMA) moves toward the MACD signal line (9-day EMA of MACD), likely to form a bearish crossover.
Traders might start selling once the MACD lines form the bearish pattern, forcing SHIB price to drop to support near $0.0000112. Breaching its immediate support level might result in the Shiba Inu token falling below its 20-day EMA (red wave) and testing support near $0.0000105 before recovering.
Dogecoin Price Moving Inside A Falling Wedge Pattern
Dogecoin, the prime meme coin, formed a classic bullish reversal pattern called the falling wedge.
In detail, the technical pattern forms when the price fluctuates inside a pair of falling trendlines that would converge down the slope. The outcome of such downside patterns is typically a price breakout to the upside.
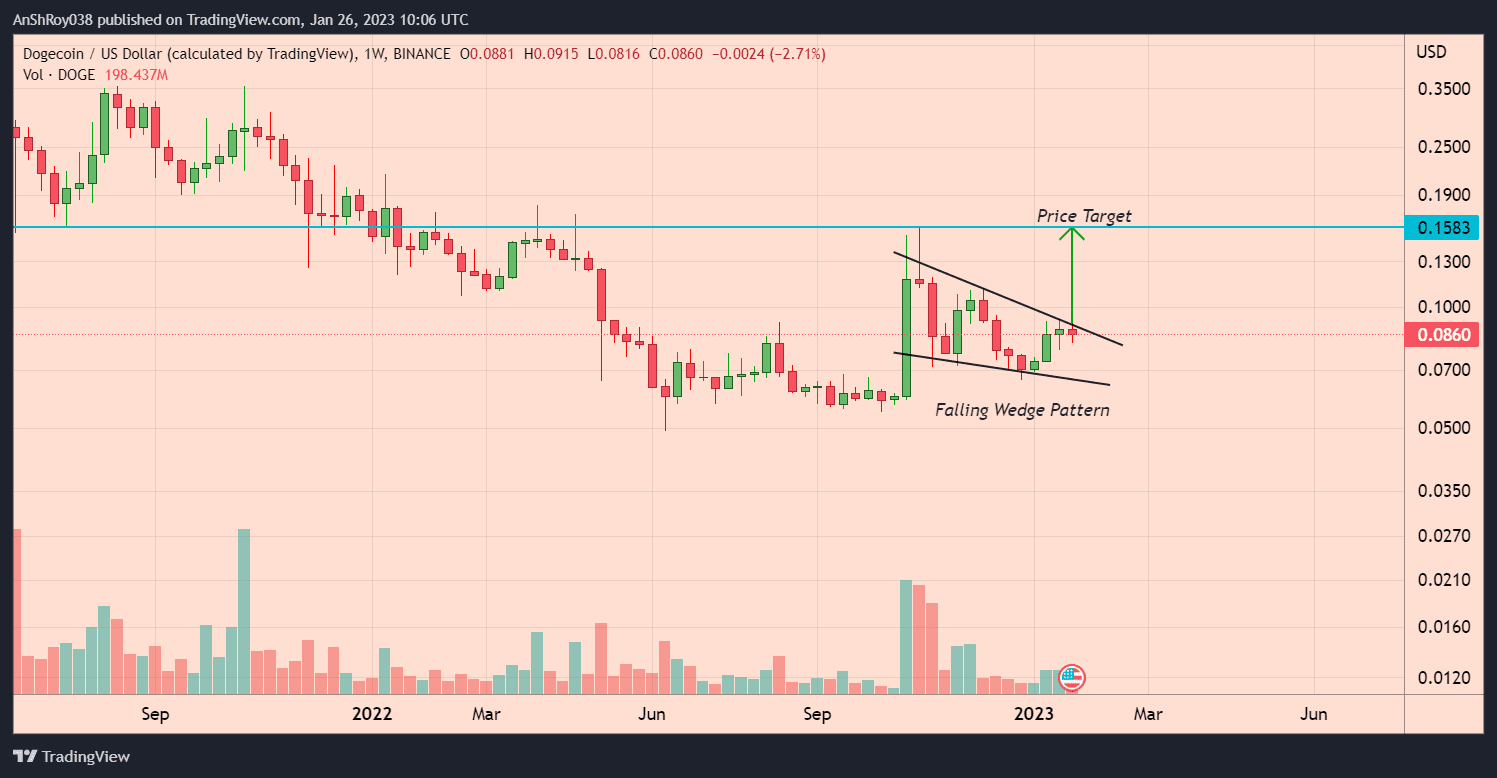
The upside target for the breakout is equal to the maximum distance between the falling wedge’s upper and lower trendlines.
DOGE price is currently trying to break above the falling upper trendline of the wedge to confirm the pattern. Per the rules of technical analysis, Dogecoin price could rise to $0.16 after breaking out of the pattern, jumping nearly 86%.
DOGE Bulls Struggle To Hold The Meme Coin’s Price Above EMA Support
Dogecoin price rose with the wider market as 2023 rolled in, spiking 34% in the first two weeks from Jan 1’s low of $0.069. However, DOGE then reversed its bull run. On Jan 26, DOGE price dropped nearly 3% to form a daily low near $0.0851.
A slew of long upper wicks on the DOGE price daily candles highlight the bearish pressure against the meme coin. As bears defend the region around $0.1, bulls are trying to ensure Dogecoin remains above the 200-day EMA (green wave) support near $0.085.
Also Read: Cardano (ADA) price drops 7% following Bitcoin’s lead – what to expect?Moreover, the momentum oscillator MACD is forecasting bearish sentiment for Dogecoin. Positive bars on the MACD histogram are contracting, indicating the MACD line (difference between 12-day and 26-day EMA) moves toward the MACD signal line (9-day EMA of MACD), likely to form a bearish crossover.

Furthermore, if the MACD forms a bearish crossover, the resulting sell-off might force DOGE price to breach immediate support and fall to test support near $0.0776 before recovering.
Conversely, if bulls manage to hold Dogecoin price above the 200-day EMA, DOGE might move to target resistance near $0.9. A break and hold above immediate resistance might help DOGE price rise to resistance near $0.1 before correcting.

… [Trackback]
[…] Find More here on that Topic: coinchapter.com/meme-coin-update-shiba-inu-shib-paints-bearish-pattern-while-doge-price-forms-bullish-wedge/ […]
… [Trackback]
[…] Read More Information here to that Topic: coinchapter.com/meme-coin-update-shiba-inu-shib-paints-bearish-pattern-while-doge-price-forms-bullish-wedge/ […]
… [Trackback]
[…] Here you can find 98871 more Information on that Topic: coinchapter.com/meme-coin-update-shiba-inu-shib-paints-bearish-pattern-while-doge-price-forms-bullish-wedge/ […]
… [Trackback]
[…] Read More on that Topic: coinchapter.com/meme-coin-update-shiba-inu-shib-paints-bearish-pattern-while-doge-price-forms-bullish-wedge/ […]
… [Trackback]
[…] Here you will find 33749 more Information on that Topic: coinchapter.com/meme-coin-update-shiba-inu-shib-paints-bearish-pattern-while-doge-price-forms-bullish-wedge/ […]
… [Trackback]
[…] Read More here on that Topic: coinchapter.com/meme-coin-update-shiba-inu-shib-paints-bearish-pattern-while-doge-price-forms-bullish-wedge/ […]