
Memecoins are bleeding, with Dogecoin (DOGE) slipping near $0.23 after falling more than 4% over the past 7 days. Yet analysts argue the downturn may not last, pointing to bullish signals on Dogecoin’s chart. Let’s see what those signals say.
Analysts Spot Bullish Setup Despite Sell-Off
Some traders believe Dogecoin may be preparing for another move higher despite the recent pullback. Market strategist Cas Abbé noted that a golden cross could soon appear on the Dogecoin chart.
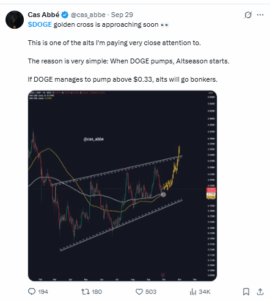
A golden cross happens when a shorter-term moving average — such as the 50-day average — rises above a longer-term moving average like the 200-day. This crossover is often viewed as a bullish signal as it shows momentum shifting back toward buyers. Abbé suggested that if Dogecoin pushes above $0.33, it could trigger stronger rallies not only for DOGE but for altcoins more broadly.
Another analyst, CW, pointed to buy and sell “walls” in Dogecoin’s order book. A buy wall is a large cluster of buy orders at a certain price, while a sell wall represents heavy selling pressure at another level.

According to CW, DOGE has found support from buyers, but faces a sell wall at $0.235. If it clears that level, the next resistance would appear near $0.25. These observations suggest the short-term battle for Dogecoin will be fought between $0.235 and $0.25.
DOGE Defends $0.22 as Key Support Zone
Looking at the daily chart, Dogecoin is trading just above $0.229. Importantly, this price sits on top of the 200-day exponential moving average (EMA), which currently stands at $0.220. The 200-day EMA is widely seen as a long-term trend marker, and Holding above it suggests Dogecoin is still on an upward path.
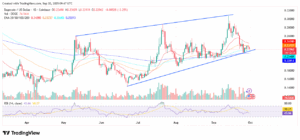
Dogecoin price has also been moving within an upward channel since June, with higher lows forming along the bottom trendline. This rising support trendline is now being tested again. If DOGE holds the line around $0.22–$0.23, it could bounce back and target higher resistance levels.
The first challenge for bulls is the 20-day and 50-day EMAs, sitting at $0.242 and $0.237. These averages are now acting as short-term resistance. A strong daily close above them would give buyers confidence to push the price toward $0.26. Beyond that, the next hurdle comes near $0.30, while Abbé’s longer-term breakout target of $0.33 remains in focus for a larger rally.
On the downside, if Dogecoin price loses the $0.220 support, the ascending channel would break, opening the door to deeper losses. The next cushion would likely sit near $0.20, which could become a magnet for sellers if momentum weakens further.
The relative strength index (RSI), a tool that measures momentum, is hovering around 44. An RSI near 50 signals balance between buyers and sellers. At 44, DOGE leans slightly bearish but is not oversold, meaning there’s room for either side to take control.
Macro Shifts Drive Bitcoin — and Altcoins Follow
The bigger picture starts with the U.S. economy. Earlier this month, the Federal Reserve cut interest rates by 25 basis points, lowering the upper bound to 4.25%. Lower borrowing costs add liquidity to financial markets, which often supports risk assets such as Bitcoin.
Bitcoin has been trading near $112,979 while holding above its 200-day exponential moving average at $111,852. This level has acted as a key support line inside Bitcoin’s long-term rising channel. If Bitcoin remains above this threshold and pushes toward $115,000, analysts say it could restore confidence across the market.
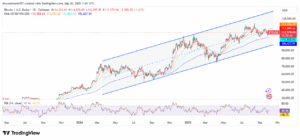
That matters for Dogecoin because altcoins typically move in Bitcoin’s shadow. When Bitcoin holds its ground or rallies, money often flows into more speculative tokens. But if Bitcoin breaks down below $111,000, the pressure usually spreads to memecoins like DOGE, wiping out bullish setups even when their own charts look constructive.
Stay tuned for more updates as the Dogecoin chart unfolds over the coming weeks – and be sure to check back soon for the latest on memecoins, market trends and crypto insights.
