
NEW DELHI (CoinChapter.com) — Privacy token Monero’s XMR token price action lost steam as it entered the weekend, falling 13.4% from Apr 22’s high of $289.1 to reaching an intraday low of $250.1 on Apr 24.
However, XMR price is still up nearly 36% month-to-day between Mar 25’s low of $199 and Apr 24’s high of $269.5. Privacy tokens like Monero have seen increased interest following geopolitical cues like the Russia-Ukraine conflict.
Monero prices have been moving above rising trendline since Feb 24. The privacy token’s recent downtrend resulted in XMR test support from a two-month-long ascending trendline. The trendline acts as immediate support for the XMR token near $242.6, near its 20-day moving average (red wave).
Further downtrend would see XMR test to support near $229. Finally, an extended downside movement could push Monero’s prices to support from its 200-day MA (green wave) near $217.6. The $217 price level previously supported XMR price action between Sept 24, 2021, to Dec 4, 2021.
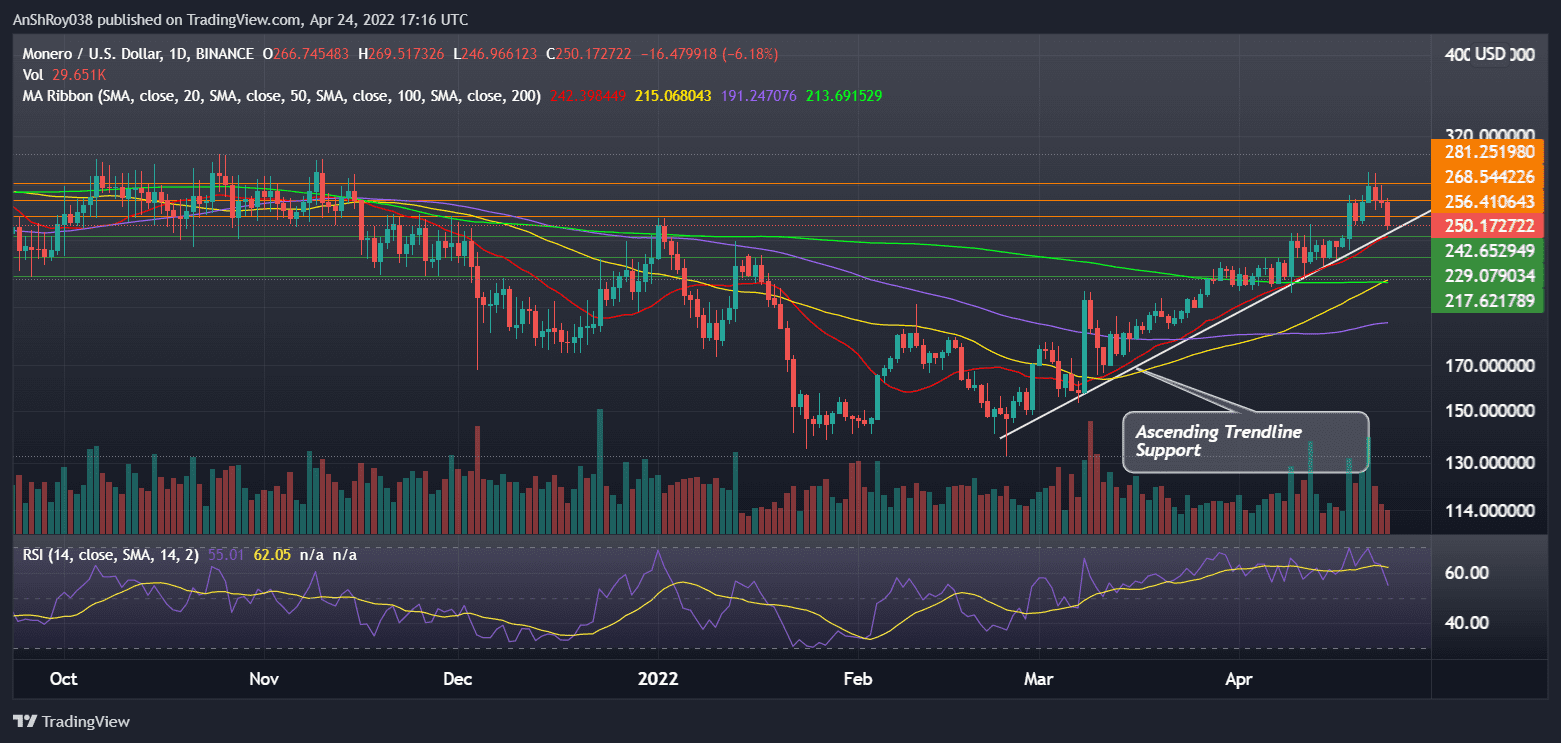
Monero price action has reacted in textbook fashion to its relative strength levels. In detail, traders consider overbought RSI levels as a sell signal, resulting in a trend reversal. XMR prices fell on Apr 19 and Apr 22 as its RSI reached overbought levels on Apr 18 and Apr 21 respectively.
Also Read: XMR jumps nearly 17% intraday ahead of Monero’s upcoming hard fork.XMR’s RSI is currently neutral with a value of 55.1, with the RSI trendline moving downwards.
Monero Breaks Out Of Falling Wedge Pattern
Meanwhile, Monero broke above the upper trendline of the falling wedge pattern in late Mar. In detail, the pattern forms when a token’s price bounces between two downward sloping, converging trendlines. XMR then continued its uptrend, with increasing volume indicating traders’ bullish sentiment.
The upside target for the breakout is equal to the maximum distance between the falling wedge’s upper and lower trendlines.
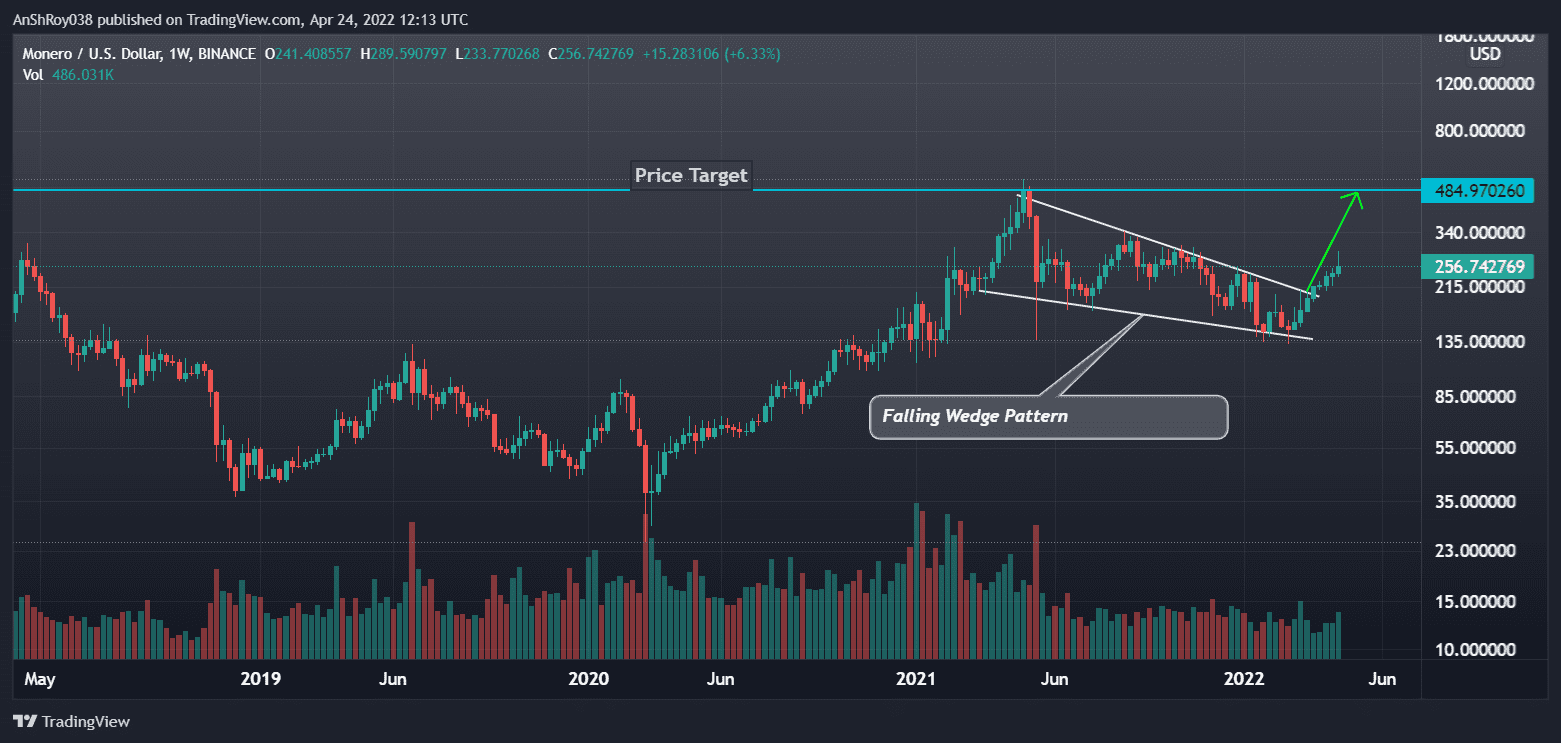
As such, XMR has a price target of nearly $484.9, a jump of nearly 89% from the current price level. However, Monero’s price still needs to move above $300 resistance before it can enjoy the bullish cues from its falling wedge breakout.
In addition, XMR’s 50-day MA (yellow wave) moved above its 200-day MA (green wave), forming a bullish technical pattern called a golden cross. Traders and analysts usually interpret the pattern as an indicator of a definitive uptrend in the market.
Also Read: Why did Monero (XMR) price reach $278 on Binance? Twitter sees ‘Russian’ involvement.The bullish cues might help the XMR token challenge immediate resistance near $256.4, a price level that previously acted as resistance for Monero between Nov 20, 2021, and Nov 30, 2021.
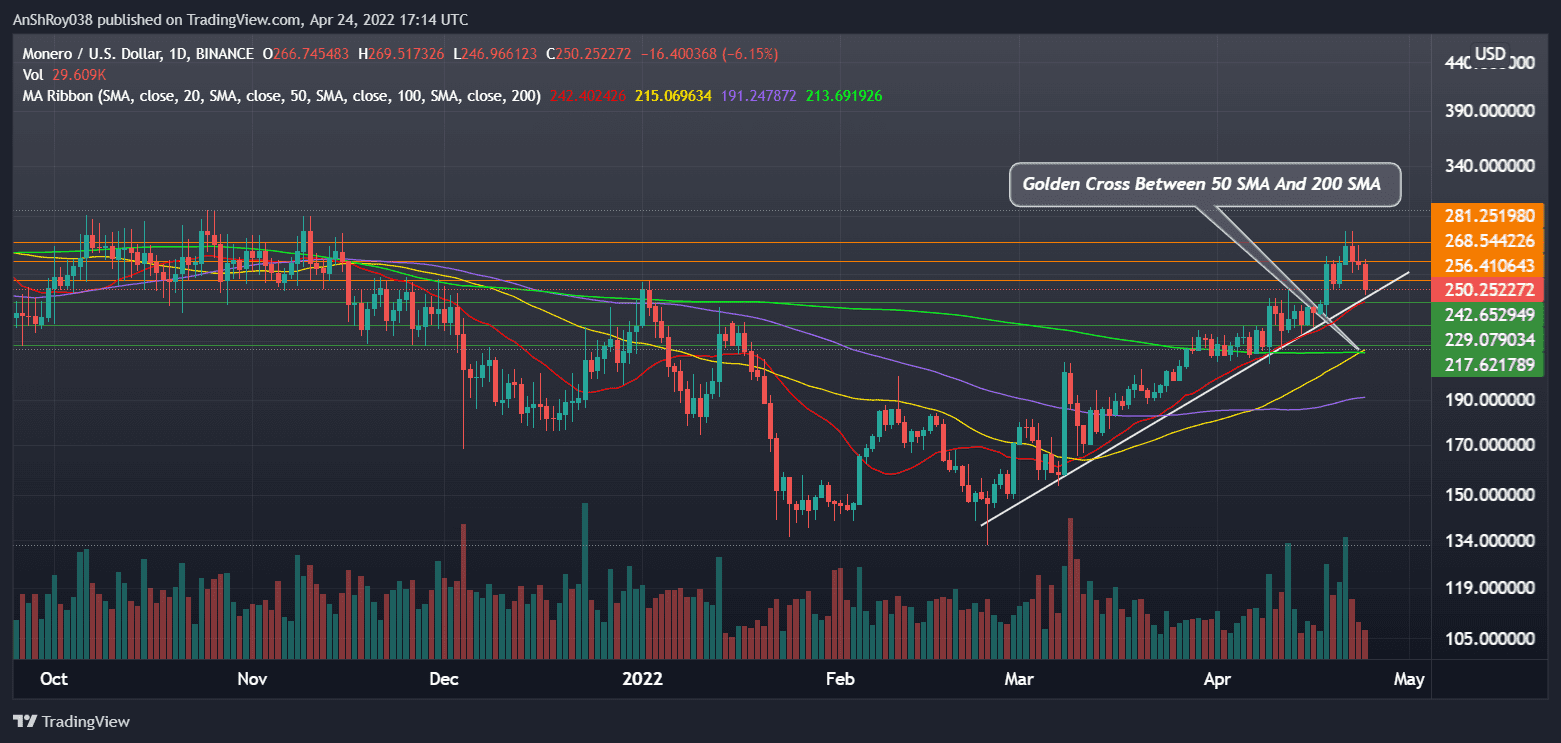
A sustained upside movement would see XMR flip resistance near $268.5, before moving to target resistance near $280, a price level XMR has been unable to hold since Sept 7, 2021.
At the time of writing, XMR was trading at $251.5, down 5.66% on the day.

… [Trackback]
[…] Read More on that Topic: coinchapter.com/monero-eyes-89-gains-as-xmr-breaks-out-of-falling-wedge-pattern/ […]
… [Trackback]
[…] Information on that Topic: coinchapter.com/monero-eyes-89-gains-as-xmr-breaks-out-of-falling-wedge-pattern/ […]
… [Trackback]
[…] Here you will find 78682 more Information to that Topic: coinchapter.com/monero-eyes-89-gains-as-xmr-breaks-out-of-falling-wedge-pattern/ […]
… [Trackback]
[…] Find More on that Topic: coinchapter.com/monero-eyes-89-gains-as-xmr-breaks-out-of-falling-wedge-pattern/ […]