
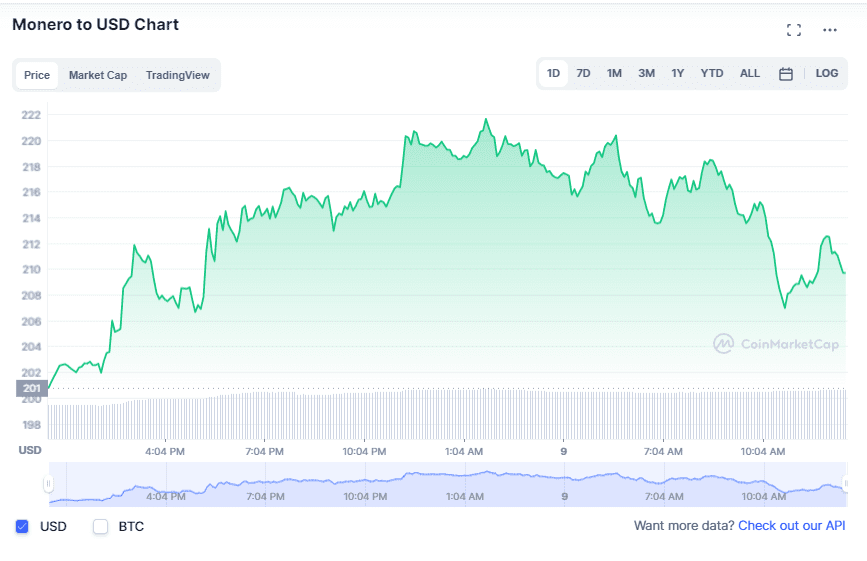
YEREVAN (CoinChapter.com) – XMR, the native token of privacy protocol Monero, traded near $210 at the London session opening bell on May 9, after a week of indecisive sideways consolidation. However, the token flashed bearish technicals across various timeframes.
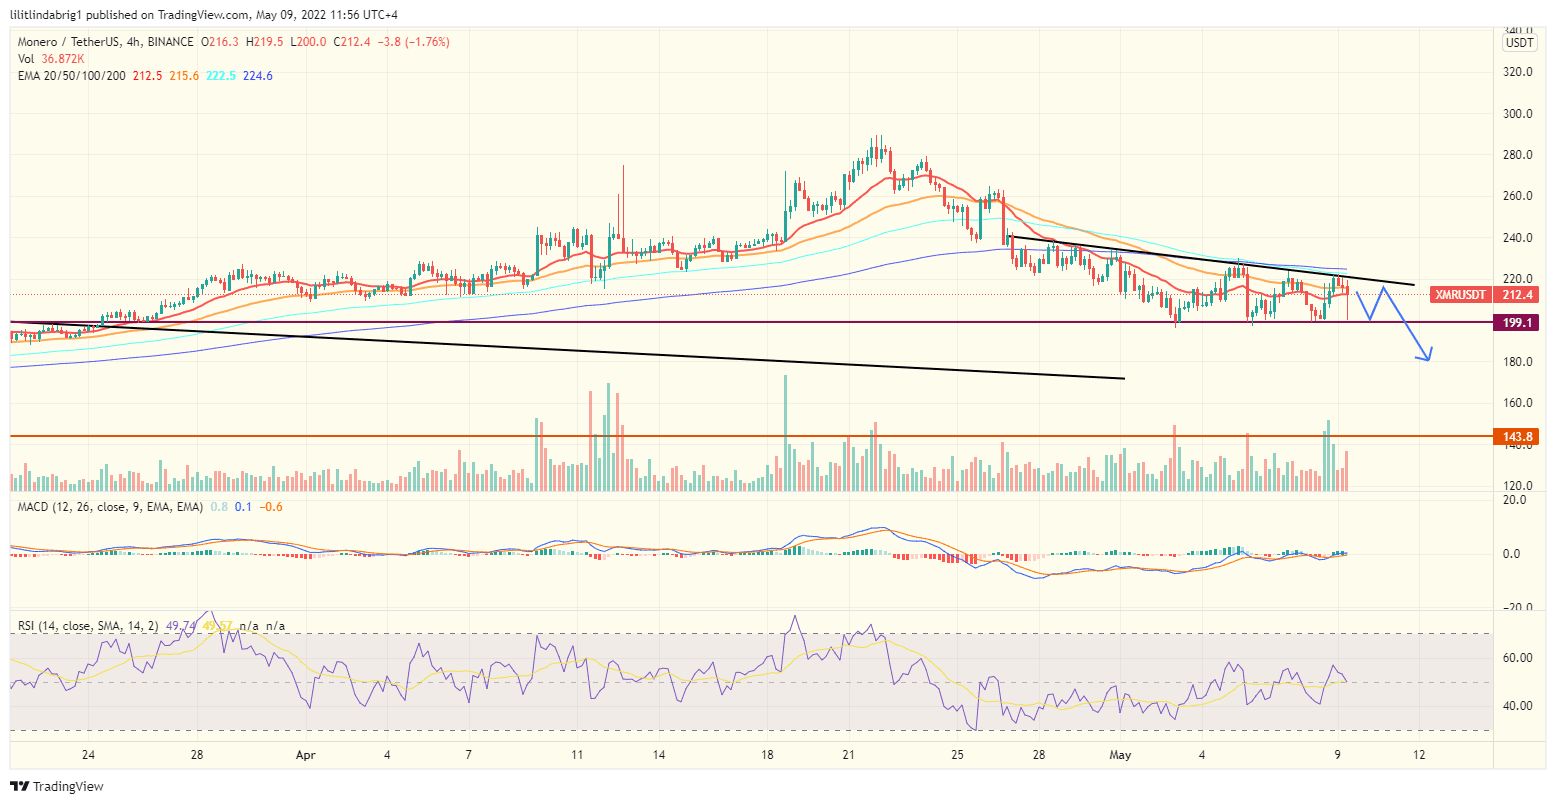
For example, the four-hour chart predicted a tough few sessions for the token, as the price action painted a Descending Triangle. The formation entails a flat support line that prevents breakdowns, and a down-sloping resistance, capping upside attempts.
Also read: Cryptocurrency prices today: Monero (XMR), Aave (AAVE), Avalanche (AVAX), the Graph (GRT), Balancer (BAL). As a result, since late April, XMR has been bobbing in between the two trendlines. Once the Monero token exhausts the formation, it risks declining below the support line at $200. Moreover, it could decline by the maximal distance between the trendlines, which pins the target price at approximately $156.
Furthermore, the daily chart did not contradict the mentioned target.
XMR daily chart did not inspire confidence
Monero faced a looming Death Cross between the 20-day and 50-day exponential moving averages (EMA-20; red wave, and EMA-50; orange wave).
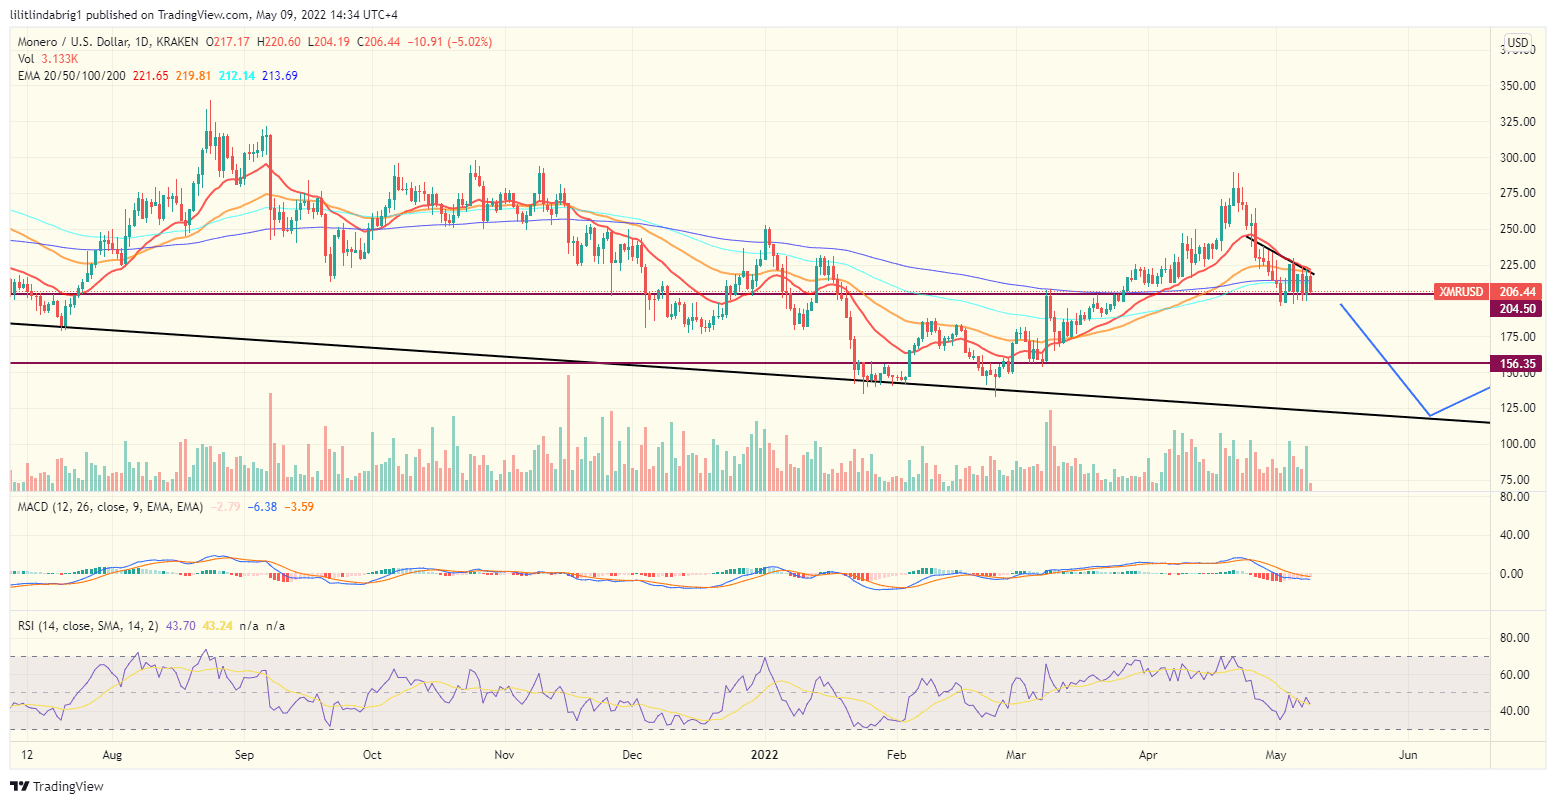
Additionally, the declining trading volumes did not inspire confidence, as the trend-based oscillators remained neutral.
Also read: Monero eyes 89% gains as XMR breaks out of falling wedge pattern. If the Monero token loses the $200 support, the next target support stood at approximately $156, backing the bearish forecast from the Falling Triangle on the 4h chart. Moreover, zooming out to the weekly time frame did not reassure XMR bulls.
Monero weekly chart
The XMR/USD price action exhibited an upcoming sell-off, as the trading volumes on the weekly chart declined throughout the March-April uptrend. Moreover, the chart reassured the significance of the $156 price target, setting the level as the next possible support for XMR.
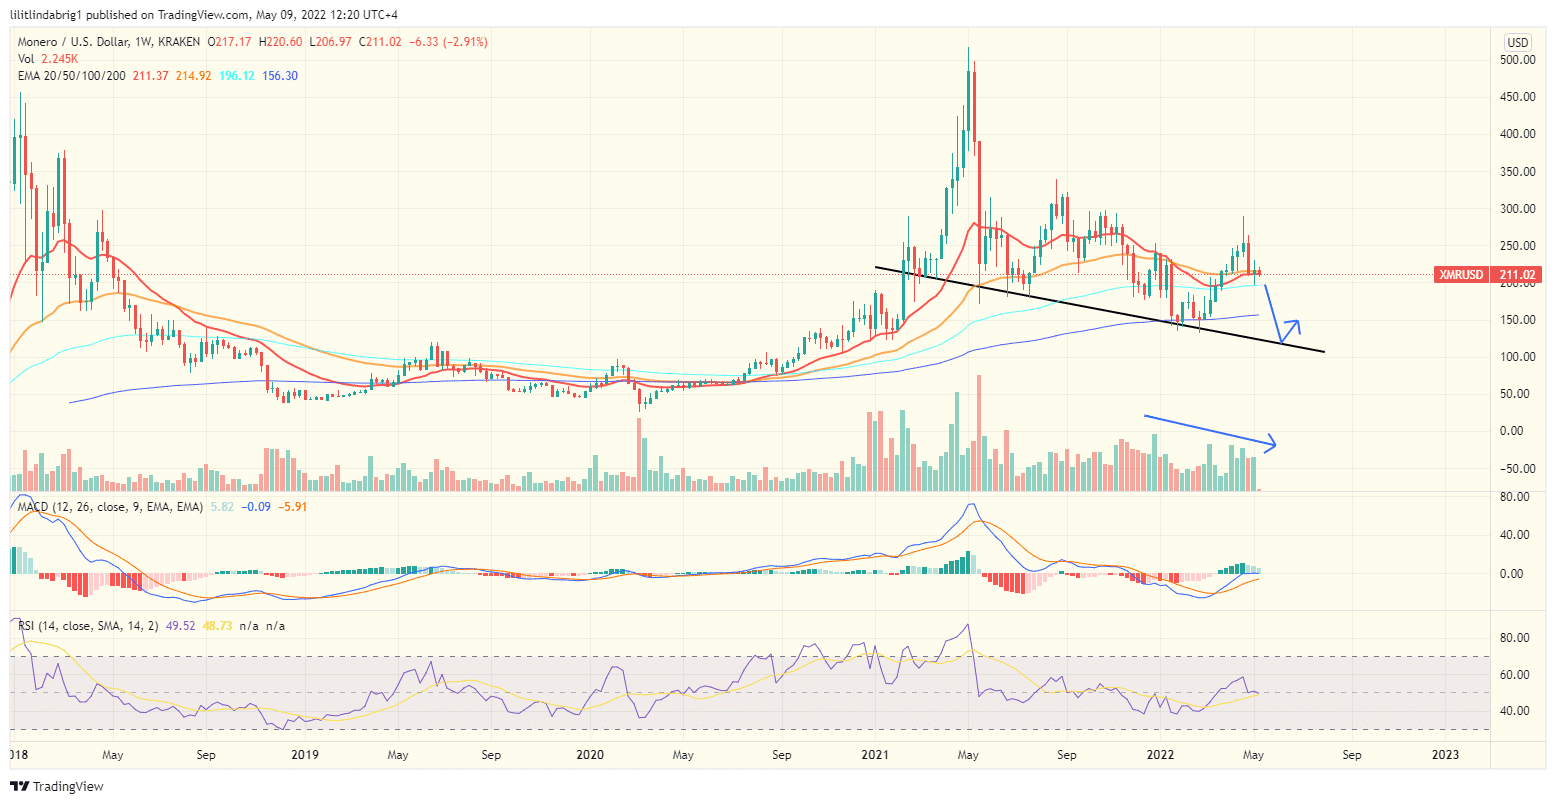
Also read: Bitcoin (BTC) loses support and falls below $36K; where are the whales?Unlike the four-hour and daily charts, trend-based oscillators’ weekly price action looked more confident. However, the token remained dependent on the larger market tendencies, which could send the token south, confirming the sell-off fears.

… [Trackback]
[…] Info to that Topic: coinchapter.com/monero-price-risks-a-25-decline-as-xmr-confirms-a-bearish-triangle-setup/ […]
… [Trackback]
[…] Read More Information here on that Topic: coinchapter.com/monero-price-risks-a-25-decline-as-xmr-confirms-a-bearish-triangle-setup/ […]