
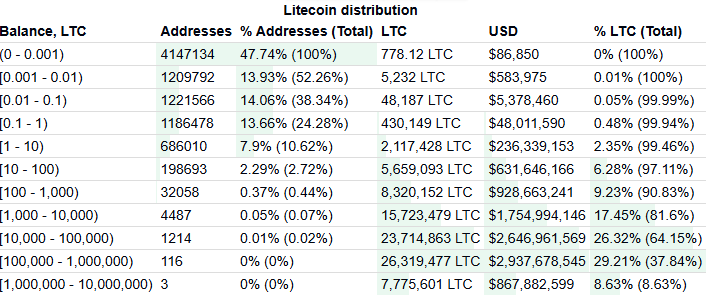
Litecoin’s latest distribution data reveals one of the fairest ownership spreads among major cryptocurrencies. Nearly 47.7% of wallets hold less than 0.001 LTC, showing broad participation from small-scale holders. In total, 90% of addresses control under 10 LTC, underscoring that the asset remains in the hands of a wide community rather than a small elite.
This level of decentralization sets Litecoin apart from many other digital assets. It reduces the risk of manipulation by a few dominant players and highlights the project’s grassroots adoption.
Holding 10+ LTC Puts You Ahead of 90%
The distribution also shows how rare it is to hold even a modest amount of Litecoin. Owning more than 10 LTC places a holder ahead of 90% of the network. Only 2.7% of wallets contain more than 100 LTC, and just 0.07% have balances above 1,000 LTC.
This structure means that accumulating larger amounts of LTC places investors in a relatively small group of higher-tier holders. The scarcity of significant balances highlights the competitive nature of long-term accumulation.
Despite the presence of bigger wallets, concentration remains limited. About 26.3% of the total supply sits in addresses holding between 10,000 and 100,000 LTC. Another 29.2% is in wallets with 100,000 to 1 million LTC. Yet these balances belong to just over 1,300 addresses in total, which is a tiny fraction of Litecoin’s millions of holders.
The data shows that whales exist but do not dominate the network. With ownership widely spread across millions of smaller accounts, Litecoin avoids the extreme centralization that often plagues other assets.
Litecoin’s Case for Long-Term Value
The fairness of distribution supports Litecoin’s reputation as one of the most accessible and community-driven digital assets. It strengthens the network against sudden sell-offs by a handful of dominant players, giving it resilience over time.
As cryptocurrencies evolve, decentralization and fairness of distribution remain key measures of credibility. Litecoin continues to meet those standards, providing one strong reason for bullish sentiment around its long-term role in the digital asset ecosystem.
Litecoin Price Chart Shows Bullish Falling Wedge Pattern
On August 28, 2025, LTC/USDT 4-hour chart against the U.S. dollar shows the creation of a falling wedge pattern. A falling wedge forms when price action contracts between two downward-sloping lines, often signaling a potential bullish reversal once a breakout occurs.
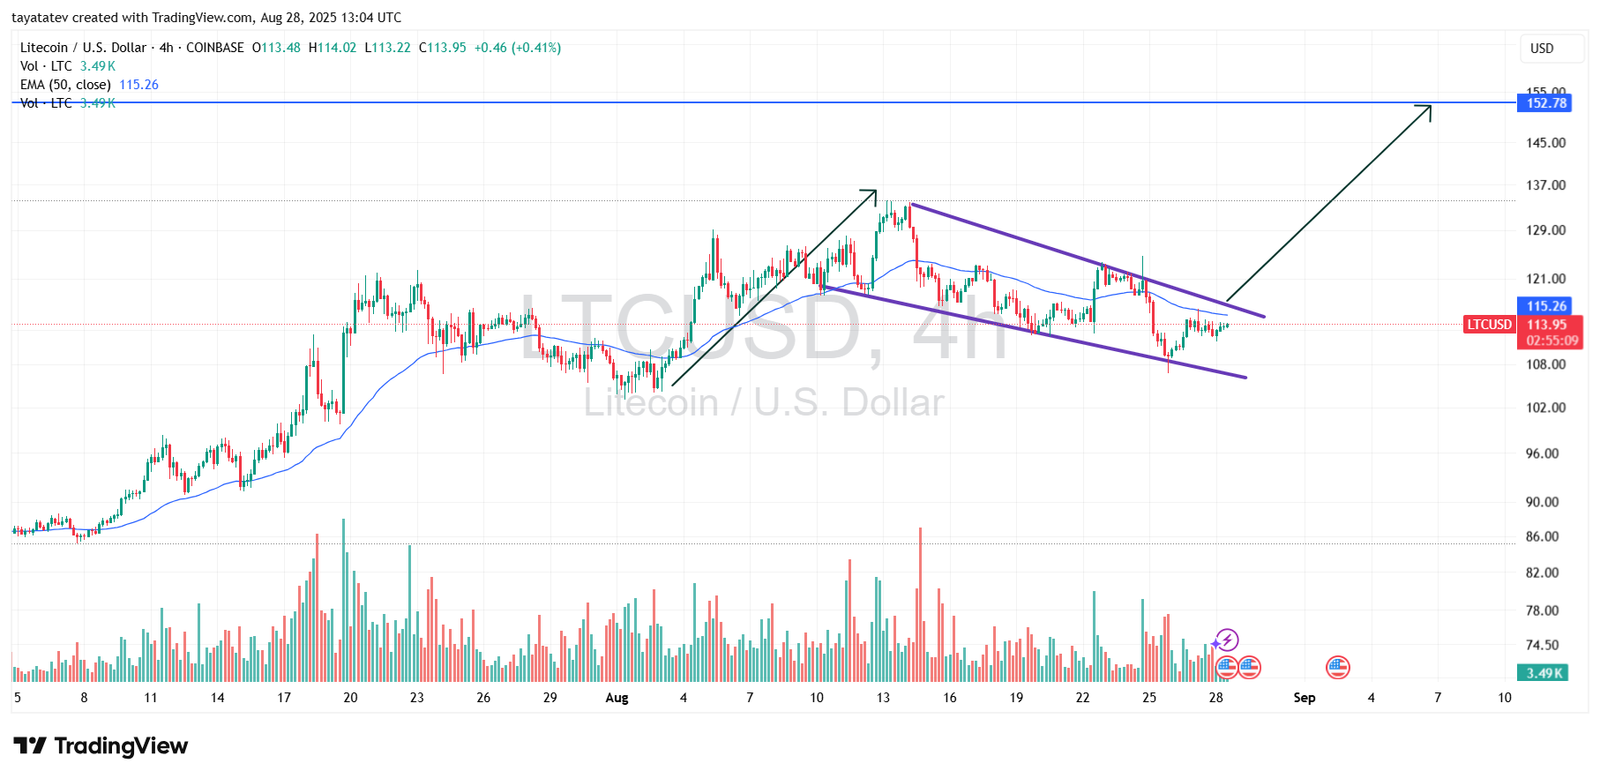
In this case, Litecoin has been trading inside the wedge since mid-August, gradually moving lower while respecting both trend lines. The recent price action now shows signs of testing the upper boundary of the wedge near the $115 region, which also aligns with the 50-period exponential moving average. A confirmed breakout above this zone would validate the bullish structure.
Measured from the depth of the wedge, Litecoin’s projected upside target stands near $152.78. From the current price of $113.95, this potential move represents an increase of roughly 34%. The chart suggests that if bulls secure momentum above resistance, the breakout could trigger a strong rally toward this level.
Trading volume also supports the case for a bullish breakout. Spikes in buying pressure near the lower trend line show that demand remains intact, and each retest of the wedge boundary has been met with accumulation rather than aggressive selling. With momentum indicators gradually stabilizing, the technical setup favors buyers.
If confirmed, this falling wedge breakout could provide Litecoin with one of its strongest bullish signals in months. The pattern aligns with its fair distribution data, reinforcing the argument for long-term strength both on-chain and on charts.
Litecoin RSI Signals Neutral Zone With Recovery Signs
On August 28, 2025, Litecoin’s 14-period Relative Strength Index (RSI) on the 4-hour chart printed a reading of 49.94. This level places the indicator in the neutral zone, neither overbought nor oversold, and suggests that the market is stabilizing after recent swings.

The RSI had dipped below 30 earlier in the week, touching oversold conditions before rebounding. This recovery shows that buyers stepped in to absorb the selling pressure, helping the market avoid a deeper decline. The upward turn in RSI confirms that momentum is shifting back toward balance.
The yellow signal line, currently at 45.40, has also crossed below the RSI value, creating an early bullish divergence. Such a crossover often indicates that buying strength could continue to build if price action follows through.
Historically, RSI movements between 40 and 60 mark consolidation phases before stronger trends emerge. With the current reading close to 50, Litecoin is at a critical midpoint. If momentum continues upward and breaks above the 60 zone, it would reinforce the case for a breakout from the falling wedge pattern seen on the price chart.
The RSI’s position adds weight to the bullish scenario. A continued climb toward overbought territory would align with the projected 34% upside move toward $152.78, suggesting that market momentum could support the breakout.
Litecoin MACD Turns Positive With Bullish Crossovers
On August 28, 2025, Litecoin’s Moving Average Convergence Divergence (MACD) indicator on the 4-hour chart showed encouraging signals for buyers. The MACD line, plotted in blue, crossed above the signal line, plotted in orange, and moved into positive territory at 0.31. This crossover often signals the beginning of renewed upward momentum.

The histogram bars have also flipped from red to green, reflecting that bullish momentum is building after weeks of mixed sentiment. Each histogram bar measures the distance between the MACD and the signal line, and the steady rise suggests that buying strength is gradually taking control.
Earlier in August, Litecoin saw sharp bearish waves as the MACD dipped below –2.5, one of its lowest levels in recent months. However, the fast recovery since then highlights strong demand on dips. This rebound has now carried the MACD back above the zero line, which historically confirms a transition from bearish to bullish market conditions.
If the MACD continues to rise while the histogram expands in green, it would support the bullish falling wedge breakout pattern identified on the price chart. Together, these signals suggest that Litecoin could sustain momentum and potentially rally toward the projected 34% upside target near $152.78.
The MACD reading aligns with the RSI stabilization, painting a broader picture of improving market health. Both indicators now support the view that Litecoin is shifting away from recent consolidation and preparing for a possible extended uptrend.
