
Key Takeaways:
- The Graph began the final phase of its migration to Arbitrum to enhance scalability and reduce gas fees.
- GRT prices have formed a bullish pattern.
PATNA (CoinChapter.com) — The Graph (GRT), a decentralized data indexing and querying protocol, has entered the final phase of its planned move to Arbitrum.
Edge & Node CEO Tegan Kline stated that the transition would bring faster transaction times and lower gas fees on the platform. Furthermore, the transition has been in the pipeline since 2022. In April 2022, the team proposed creating a set of contracts that would bridge GRT transactions to Arbitrum.
However, a June 2022 proposal presented a planned deployment of The Graph Protocol. The proposal suggested that the migration should be in stages instead of one go to ensure safe transition.
This is a big change, however, and not risk-free. So it would make sense to approach this with caution, and gradually mitigate risk along the way. For this reason, we’d like to explore an Arbitrum protocol implementation that works initially with no indexing rewards
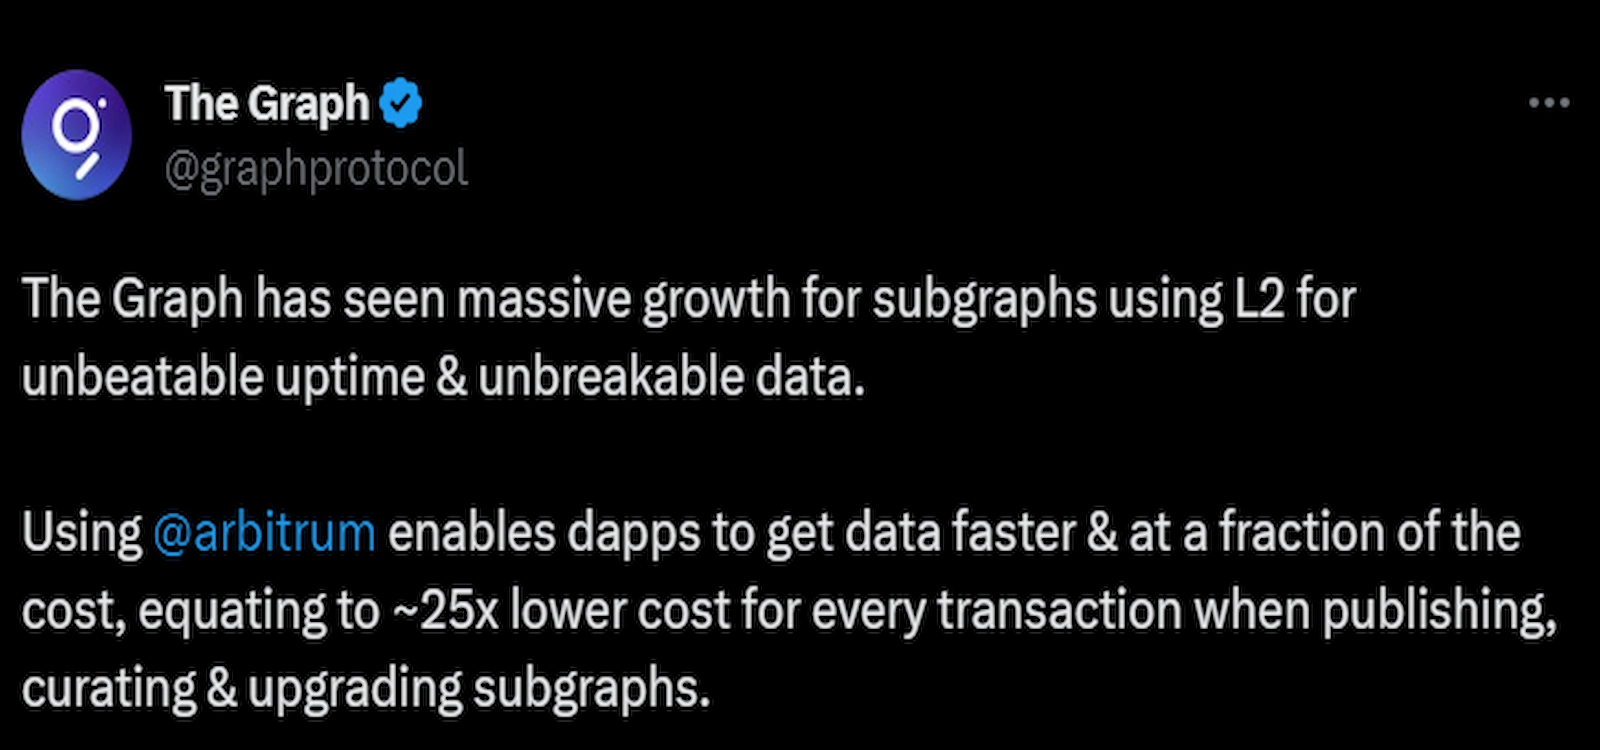
Developers stated in the GIP-0034 proposal.The latest transition involves The Graph’s settlement layer, meaning the protocol would now settle transactions directly on Arbitrum instead of Ethereum. Moreover, the move makes The Graph Protocol one of the largest Ethereum dApps to transfer to an L2 network.
News of the transition did not help the Arbitrum token price, with ARB dropping nearly 6% on June 14, according to data from the charting platform Tradingview.
GRT Price Moving Inside A Bullish Pattern
Meanwhile, GRT price has formed a bullish technical pattern called the ‘Bull Flag.‘
Assets with strong uptrends usually form the pattern. Bull flags consist of a flag pole, resulting from a near-vertical rise in the crypto token’s prices.
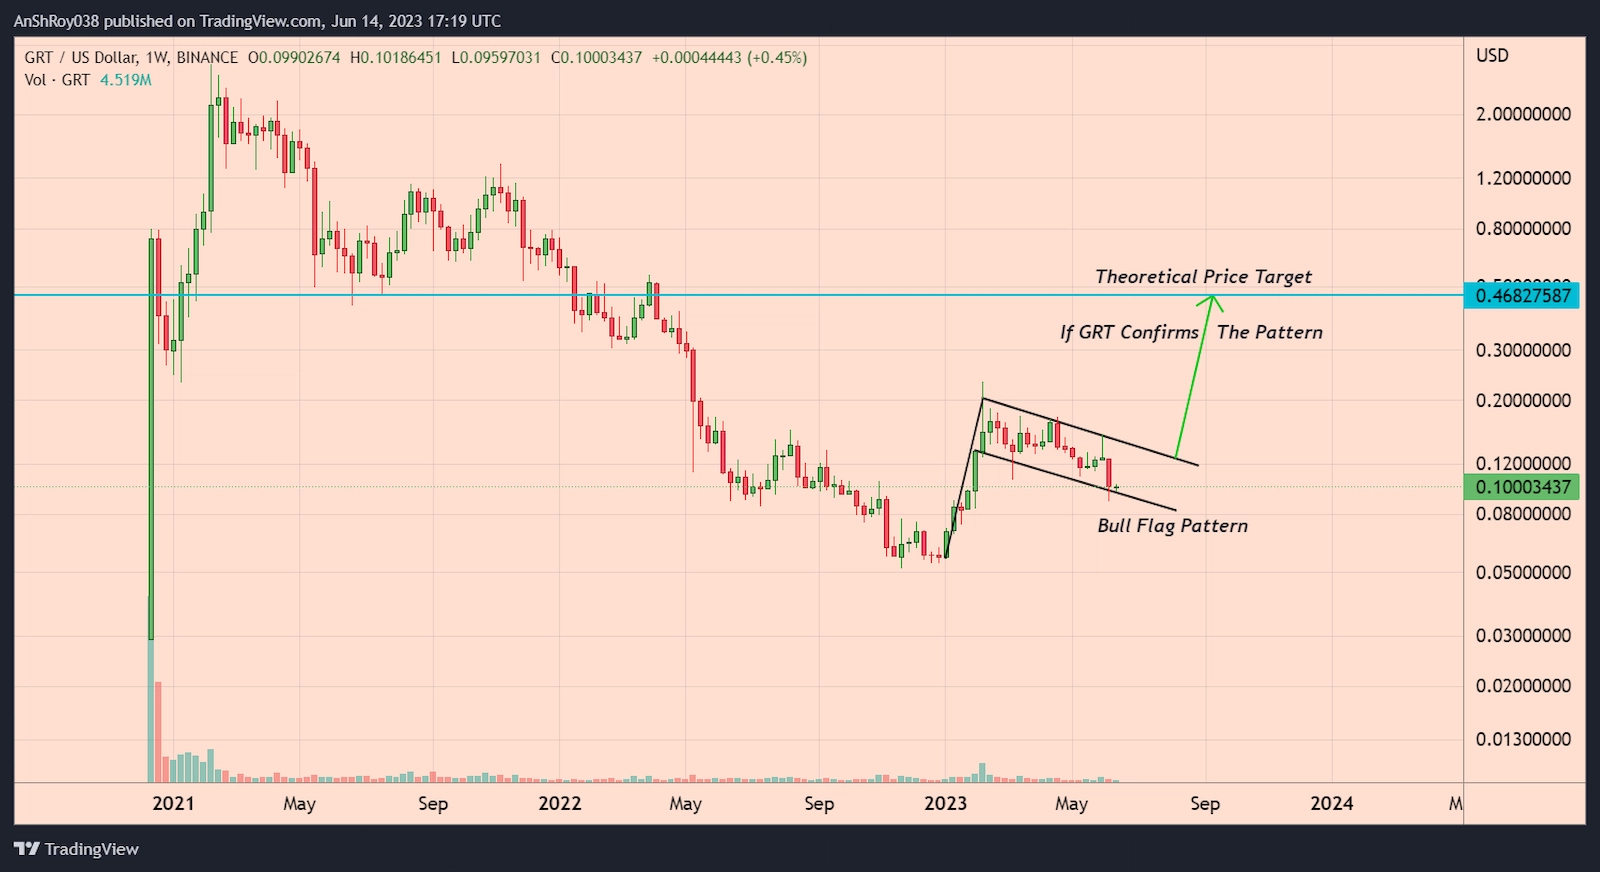
A period of consolidation succeeding the steep uptrend forms the flag of the pattern. Despite the strong vertical rally, the asset price does not drop as bulls maintain the buying pressure. As a result, the breakout from the flag pattern often results in a powerful uptrend.
Also Read: SEC Delays Decision On Coinbase’s Request For Crypto Clarity, Asks For Additional TimeTraders calculate the price target of the breakout by adding the length of the flag pole to the breakout price level. Per the rules of technical analysis, GRT price might rise 368% to reach $0.468 in Q4 2023, theoretically.
Bearish Pressure Too Much For The Graph Token
Meanwhile, GRT price failed to capitalize on the transition news. The token had a bullish start to the day, with bulls celebrating the development and propelling GRT price to reach 1 cent. However, things unraveled as the trading continued, and GRT price dropped over 8% to form a daily low near $0.093.
FUD from the SEC’s legal action against two major exchanges also impacted The Graph token price, with GRT price shedding over 25% from its June 5 high of $0.125.
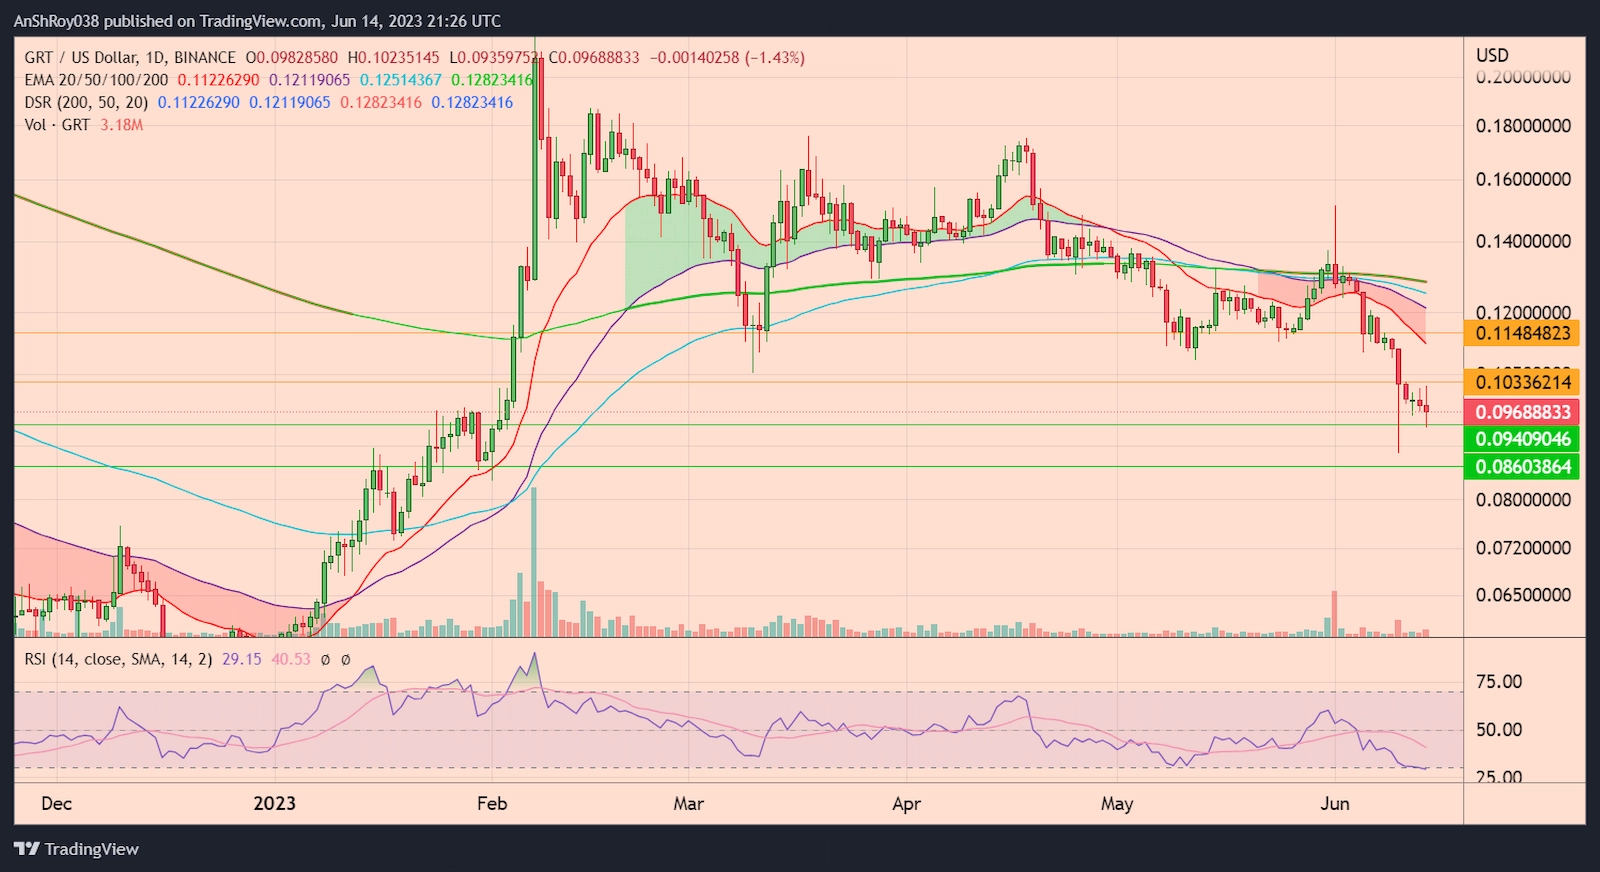
If the sell-off continues, The Graph token price might drop to its support level near $0.0941. Breaching the immediate support level could result in GRT price falling to test support near $0.086 before recovering.
After skirting the oversold threshold of 30 for days, the RSI for GRT became oversold on June 14, with a value of 29.15 on the daily charts. Traders looking for technical bullish cues might enter the market since oversold RSI levels often precede a bullish reversal.
Hence, GRT price might rise to $0.1. Flipping the immediate resistance could help The Graph token price target its 20-day EMA (red wave) resistance near $0.115.
