
Key Takeaways
- Shiba Inu (SHIB) rallied over 50% in 7 days to flip BUSD at number 13 with market cap
- The charts indicate that SHIB is overbought and we can expect signigicant price corrections
YEREVAN (CoinChapter.com)- Shiba Inu (SHIB) is one of the largest gainers among the top cryptocurrencies. The Dogecoin knockoff rallied 52% in the past seven days to unseat Binance USD (BUSD) at the 13th spot. According to CoinMarketCap, SHIB crossed the $18 billion in market capitalization in the recent rally. However, a closer reading of the charts suggests SHIB may shed a chunk of its gains in the days to come.
The surge in Shiba Inu’s price comes after the meme token slipped over 75% from its all-time high of $0.00008845, which it attained last October.
SHIB reached $0.00003493 per coin in Tuesday’s trading session.
The price rally did not skip the eyes of the major Shiba Inu whales. According to a Twitter post by WhaleStats, a whale transferred 3,457,477,154,937 SHIB tokens to an Ethereum wallet in two separate transactions. The wallet now holds over 3.4 Trillion Shiba Inu tokens.
The total value of the Whale’s wallet in fiat currency terms is nearly worth a whopping $116 million.
However, while the major rally is good news, we may see a major crash in the price of SHIB.
Recommended: Shiba Inu hits a three-week high as SHIB rebounds by nearly 75%—what’s ahead?
SHIB Relative Strenght Index (RSI) gives out worrying signs
The Relative Strenght Index (RSI) of Shiba Inu on the TradingView chart indicates the coin is already facing correction from the 70 mark. RSI values of 70 or above are signs that an asset is becoming overbought. This usually follows with a trend reversal in the asset.
The last time SHIB crossed the 70 RSI was last November which triggered massive sell-offs.
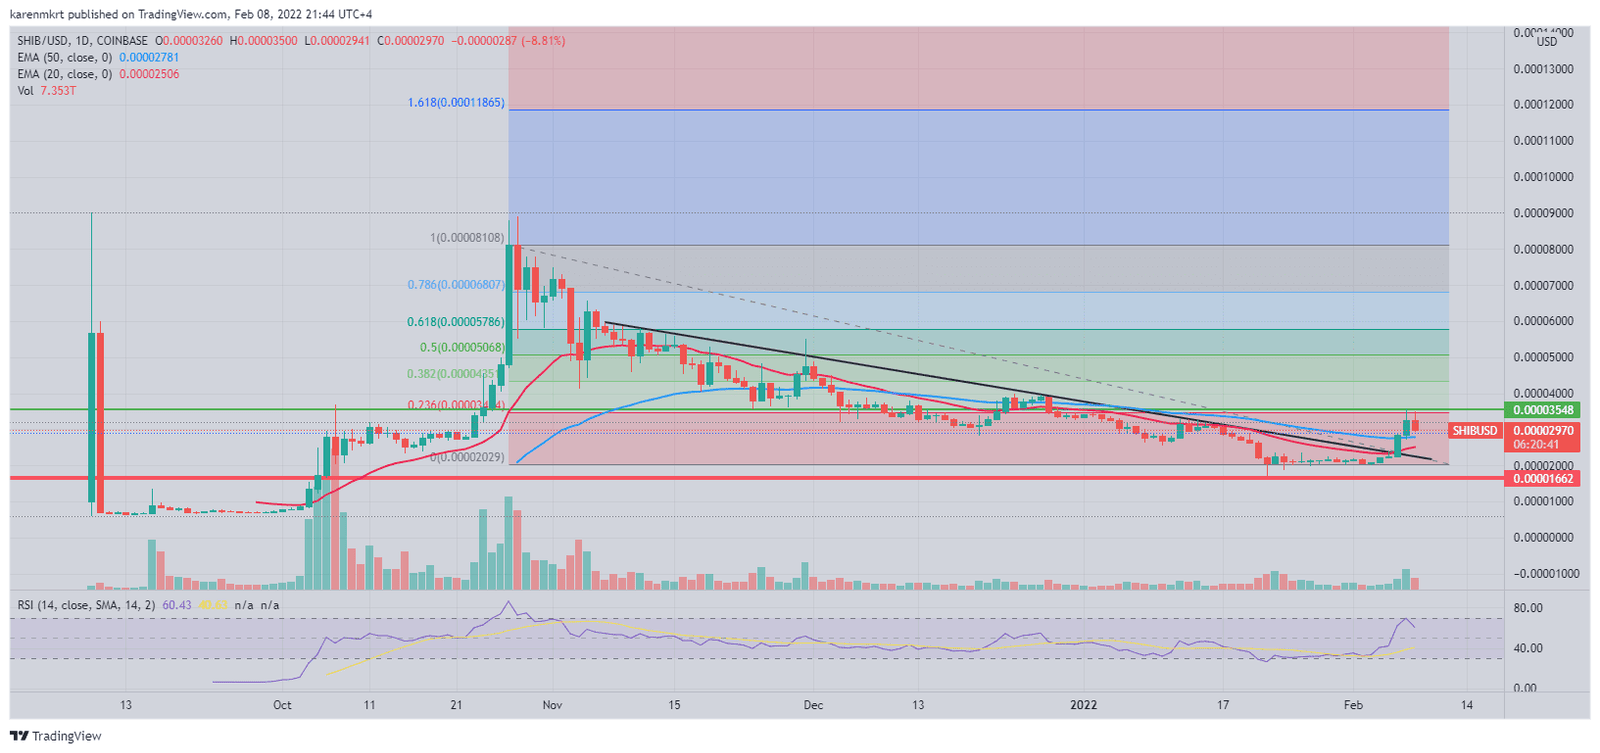
Additionally, the trading volume does not seem to indicate that SHIB can sustain the rally. The last two times that Shiba Inu rebounded, both in October 2021, the markets had supported the spike with a substantial increase in trade volumes, which have been missing this time around.
Should we see a repeat of the scenario, the price of Shiba Inu will face steep corrections. According to the Fibonacci retracement levels, the nearest support that SHIB can hope to find is the 50-day exponential moving average (EMA), which is currently around the $0.00002782 mark. That is a 15% drop from the current price.
However, should the bulls fail to prevent a further price cut, SHIB can fall an additional 10% to find support at the 20-day moving average of around $0.00002509. A bear-dominated scenario can push the price of Shiba Inu to as low as $0.00001662 should the fall break the indicated support levels.
On the other hand, a break above the current price will pit SHIB against the immediate resistance line of $0.00004351.
As the markets react to SHIB’s rally, we will wait to see how the price plays out on the charts in the days to come.

… [Trackback]
[…] Read More on on that Topic: coinchapter.com/overbought-risk-emerges-in-the-shiba-inu-market-as-shib-rallies-over-50/ […]
… [Trackback]
[…] Find More here on that Topic: coinchapter.com/overbought-risk-emerges-in-the-shiba-inu-market-as-shib-rallies-over-50/ […]
… [Trackback]
[…] Read More to that Topic: coinchapter.com/overbought-risk-emerges-in-the-shiba-inu-market-as-shib-rallies-over-50/ […]
… [Trackback]
[…] Information to that Topic: coinchapter.com/overbought-risk-emerges-in-the-shiba-inu-market-as-shib-rallies-over-50/ […]
Howdy just wanted to give you a quick heads up. The text
in your post seem to be running off the screen in Internet explorer.
I’m not sure if this is a format issue or something to do
with browser compatibility but I figured I’d post to let you know.
The layout look great though! Hope you get the issue solved soon. Kudos
If you want to get a great deal from this piece of writing then you have
to apply such methods to your won blog.