
On May 8, 2025, PEPE price jumped 10%, hitting $0.00000869. The memecoin’s market cap reached $3.75 billion as strong whale accumulation and broader market recovery boosted momentum.
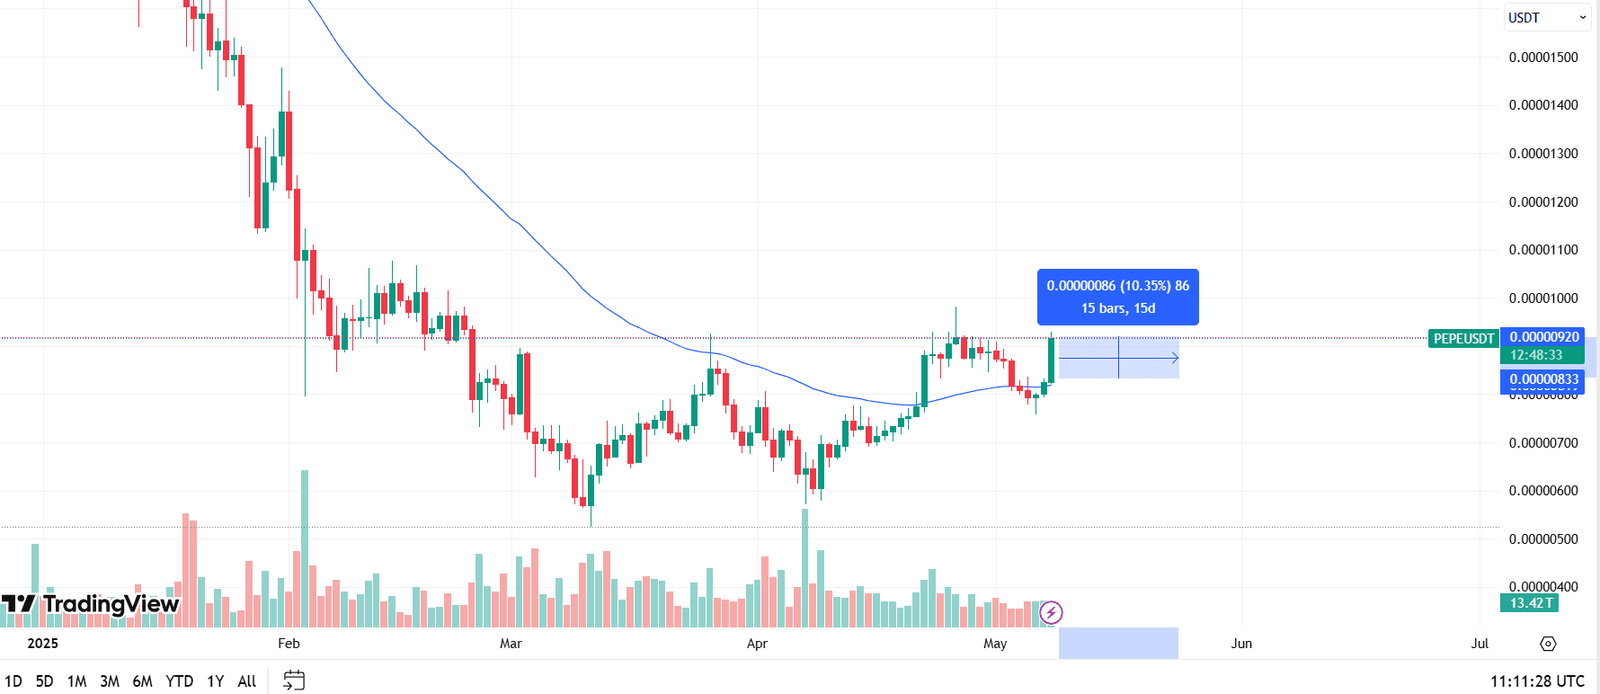
Whale Activity Sparks Rally
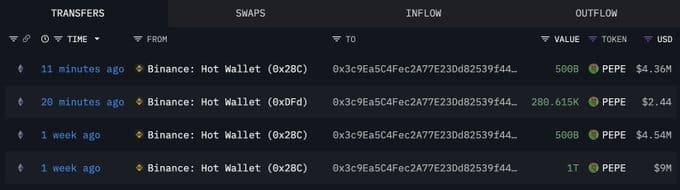
Over the past week, a major crypto whale has withdrawn 2 trillion PEPE tokens from Binance. On April 30, the whale pulled 1.5 trillion PEPE—worth part of their $147 million portfolio—off the exchange. Earlier today, they withdrew another 500 billion PEPE. This steady accumulation hints at long-term holding and potential confidence in price growth.
Data from CoinGlass shows that open interest in PEPE futures surged 13% to $456 million. This increase suggests growing participation from traders. In the past 24 hours, PEPE-related liquidations reached $1.57 million, with $1.45 million of that in short positions—indicating that many traders bet against the rally and were forced to exit as the price moved higher.

PEPE’s rise mirrors a broader bounce in the memecoin sector. Other tokens like Dogecoin (DOGE) and Shiba Inu (SHIB) have also gained between 5% and 10% today, adding momentum to PEPE’s upward push.
PEPE Faces 43% Drop Risk as Bearish Rising Wedge Pattern Emerges
Meanwhile, the PEPE/USDT chart on Binance for the past year showed a bearish rising wedge pattern—a formation where upward-sloping support and resistance lines converge, typically indicating a potential breakdown.
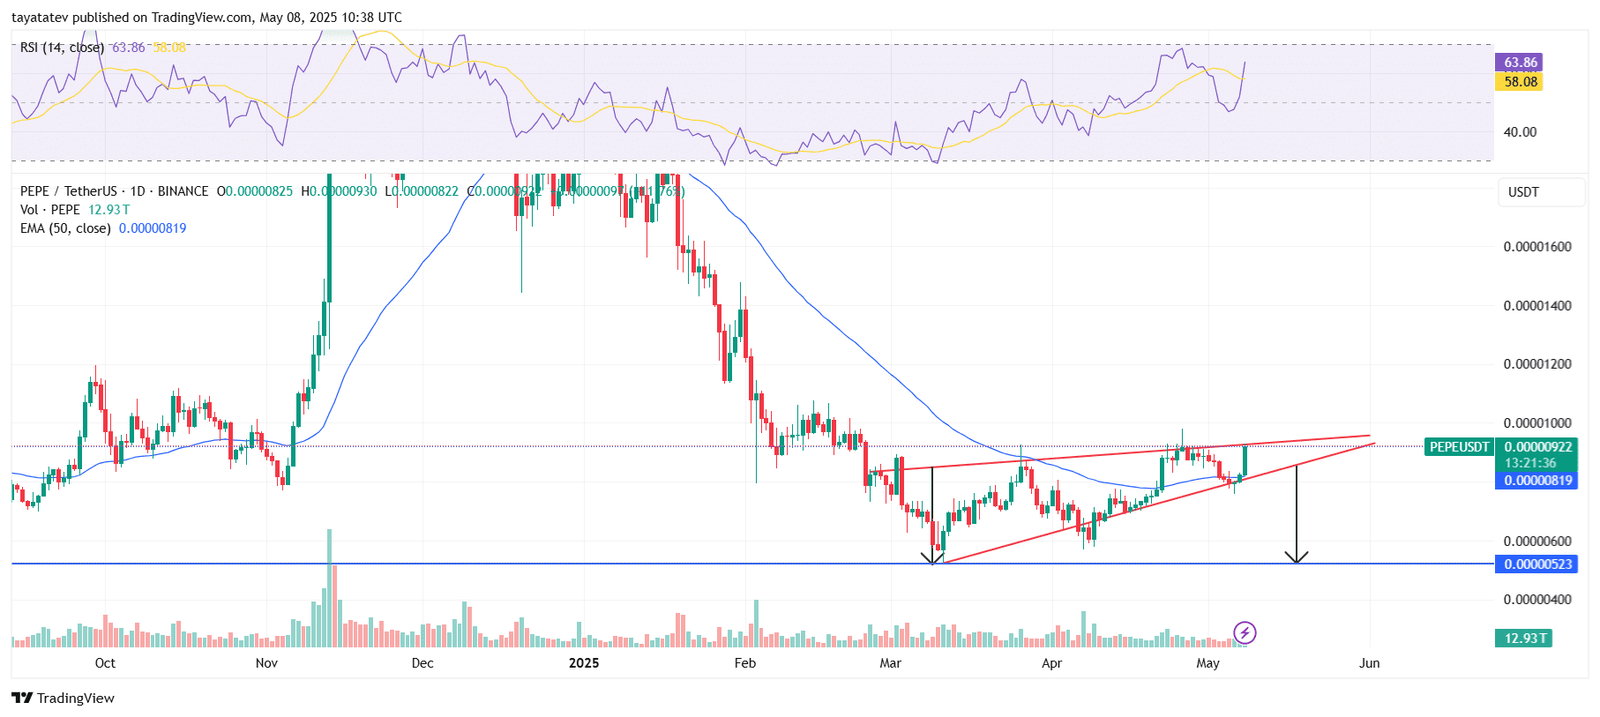
If this bearish pattern confirms, the projected drop is around 43%, which would bring the price down to approximately $0.00000523. The measurement comes from the height of the wedge’s base subtracted from the lower support line.
At the same time, the 50-day Exponential Moving Average (EMA), currently near $0.00000819, acted as short-term support during the recent price action. However, a breakdown below this level would further validate the bearish structure.
The Relative Strength Index (RSI), a momentum indicator, reads 63.86 and remains below the overbought zone. This suggests that despite recent gains, the asset still holds room for volatility and may not have exhausted bullish momentum yet.
Trading volume remains moderate, with no visible spike to signal a strong reversal. Unless a breakout invalidates the wedge, technical pressure favors a bearish continuation toward the $0.00000523 target.
