

Key Takeaways:
- PI Industries’ share price might be primed for a rally.
- However, PIIND prices have formed a bearish technical pattern.
- PI Industries stock prices are on a bull run.
NEW DELHI (CoinChapter.com) — PI Industries (NSE: PIIND) share price can rally up to 34%, according to a note by Indian financial firm Motilal Oswal.
PI Industries is an India-based chemical manufacturer that specializes in agrochemical products. The firm had a good run in Q2 2023, reporting a 46.2% YoY jump in net profit. As such, investors expect a repeat performance when the firm announces the latest quarterly results.

Meanwhile, per a CNBC report, Motilal Oswal termed any correction in PI Industries stock prices as a ‘buy’ opportunity. Oswal stated that PI Industries’ plans to diversify in the pharmaceutical segment while improving its grip on the domestic agrochemical franchise would likely push the firm’s prices higher.
Furthermore, Oswal noted that PI Industries’ focus on the custom synthesis manufacturing (CSM) segment has helped it break ahead of competitors.
PIIND Price Form Bearish Technical Pattern
Despite the bullish speculation surrounding PI Industries’ stock price, the technical signals for the stock suggest a bearish outlook. PIIND price has formed a bearish technical pattern called the ‘Rising Wedge.’
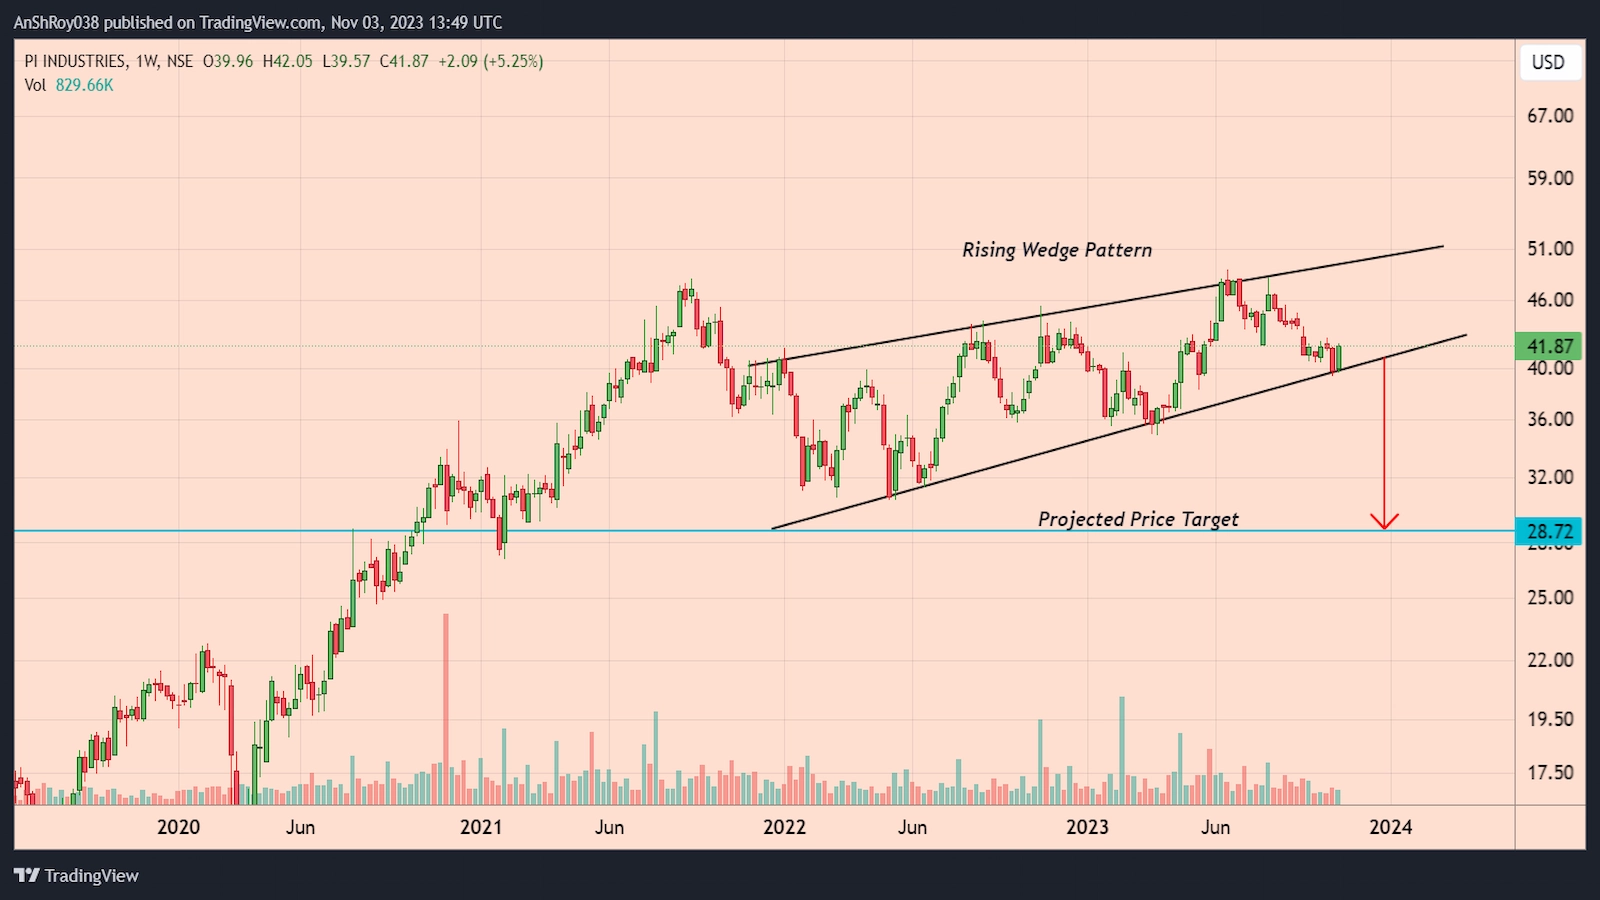
Two upwards-sloping and converging trendlines, joining higher highs and higher lows, form the said structure. Declining trading volumes often accompany a breakdown below the pattern.
The price target of the pattern is equal to the height of the back of the wedge. Hence, if PIIND confirms the pattern, it risks falling more than 31% to reach the theoretical downside target near $28.7.
PI Industries Price On A Bull Run
PIIND price ongoing rally helped the PI Industries shares price spike by nearly 7% since Oct. 26 to reach a daily high near $42 on Nov. 3. However, bulls failed to push PIIND price above the 200-day EMA (the green wave) and 50-day EMA (the purple wave) dynamic resistance.
Bulls’ primary objective would be to move above the EMA trendlines before targeting the resistance near $43.25. Moreover, flipping the immediate resistance might help PIIND price rally to the resistance near $45 before correcting.
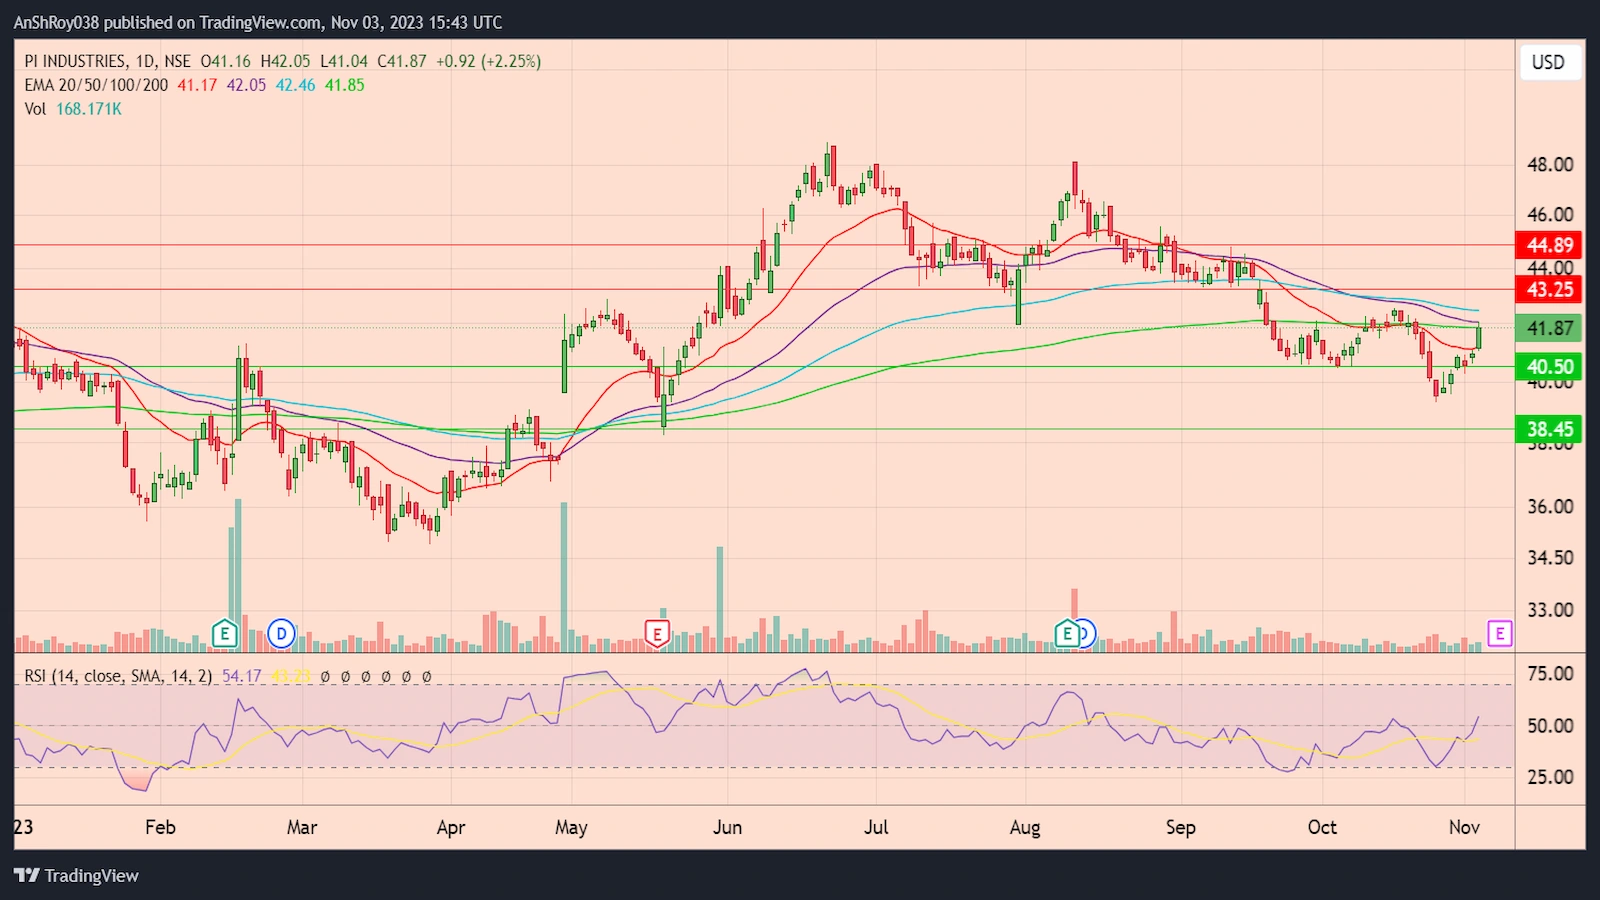
On the other hand, if the 200-day EMA rejects the rally, PI Industries’ share price might drip to the support near $40.5. Moreover, a breakdown below the immediate support level might force the PIIND price to test the support near $38.45.
RSI for PIIND remained neutral, with a score of 54.17 on the daily charts.

… [Trackback]
[…] There you will find 23671 more Information on that Topic: coinchapter.com/pi-industries-nse-piind-shares/ […]
… [Trackback]
[…] Information on that Topic: coinchapter.com/pi-industries-nse-piind-shares/ […]