
Speculation about a potential partnership between Pi Network and Google AI spread across social media following a recent surge in the PI token.
On X, one user claimed that the upcoming announcement could involve a deal with Google’s artificial intelligence unit. The post highlighted a star symbol seen in Pi Network’s teaser image, which they said resembled the Google AI logo. Another user suggested the news might relate to a separate initiative called PiAI.

While some users expect a major reveal, others urged caution. One community member wrote that even if the announcement is bullish, people should “lower their expectations” to avoid disappointment.
As debate continued, one user questioned the project’s originality. They argued that Pi Network offers little innovation, stating,
“Other blockchains and projects have already done most of what they’re doing.”

The user encouraged the community to remain critical and ask tough questions.
$100M Startup Fund Fuels Ecosystem Growth
Pi Network launched a $100 million ecosystem fund to support early-stage startups building on its native blockchain. The initiative aims to strengthen the network’s utility by backing projects that create real-world use cases for the PI token.

The fund is managed by the Pi Network core team and will allocate capital to developers, businesses, and community contributors. According to the announcement, funding will be offered primarily in U.S. dollars. However, eligible projects may also receive grants in PI tokens, depending on the use case and compliance requirements.
The initiative will cover a wide range of project types—including infrastructure tools, decentralized applications, payment systems, and business models that rely on the Pi Network ecosystem. A core focus is to create scalable products that attract users and demonstrate the value of the protocol in real-world settings.
The Pi core team said the goal is to drive long-term adoption. To ensure transparency and strategic alignment, the team will evaluate proposals based on business feasibility, team experience, and impact on the Pi ecosystem.
Pi Network Price Analysis – June 26, 2025
On June 26, 2025, the 30-minute chart for the PI/USDT pair on OKX showed a clear retracement after a strong upward move. The price reached a local high of $0.6639 on June 25 before pulling back toward the $0.55 range.

The chart displays a Fibonacci retracement drawn from the $0.5074 low to the $0.6639 high. At the time of writing, PI trades at $0.5563, sitting below both the 0.5 ($0.6018) and 0.618 ($0.5872) Fibonacci levels. These levels typically act as key support zones, but the price broke below them during the latest session.
The 50-period Exponential Moving Average (EMA), currently at $0.5899, was also breached. This breakdown signals weakening short-term momentum, as the price now trades below the EMA resistance.
Volume increased slightly during the decline, suggesting stronger selling pressure. Meanwhile, the Balance of Power (BoP) indicator printed a negative value of -0.28, which indicates bearish control in the current session.
If the downtrend continues, the next support zone may form around the $0.5450 area. However, a quick rebound above the 0.618 level and the 50 EMA could shift momentum back toward the bulls.
PI/USDT RSI Analysis – June 26, 2025
On June 26, 2025, the 14-period Relative Strength Index (RSI) for PI/USDT dropped to 29.74, while its moving average sits slightly lower at 27.97. These values indicate that the token is currently in oversold territory, which starts below the 30 threshold.

Earlier, on June 25, the RSI reached over 70, signaling overbought conditions. Since then, the index steadily declined, reflecting the ongoing price correction. The highlighted area on the chart shows a bearish RSI divergence, where the indicator failed to maintain its upward momentum while the price kept climbing. This divergence often signals weakening buyer strength.
As the RSI continues to move below 30, selling pressure remains dominant. However, this zone may also attract short-term buyers expecting a technical rebound. If the RSI crosses back above 30 with increased volume, it could suggest a shift in momentum.
PI/USDT Stochastic Momentum Index – June 26, 2025
The Stochastic Momentum Index (SMI) for PI/USDT shows values of -41.53 and -42.14 for the blue and orange signal lines respectively. These readings place both lines in the negative territory, indicating persistent bearish momentum.
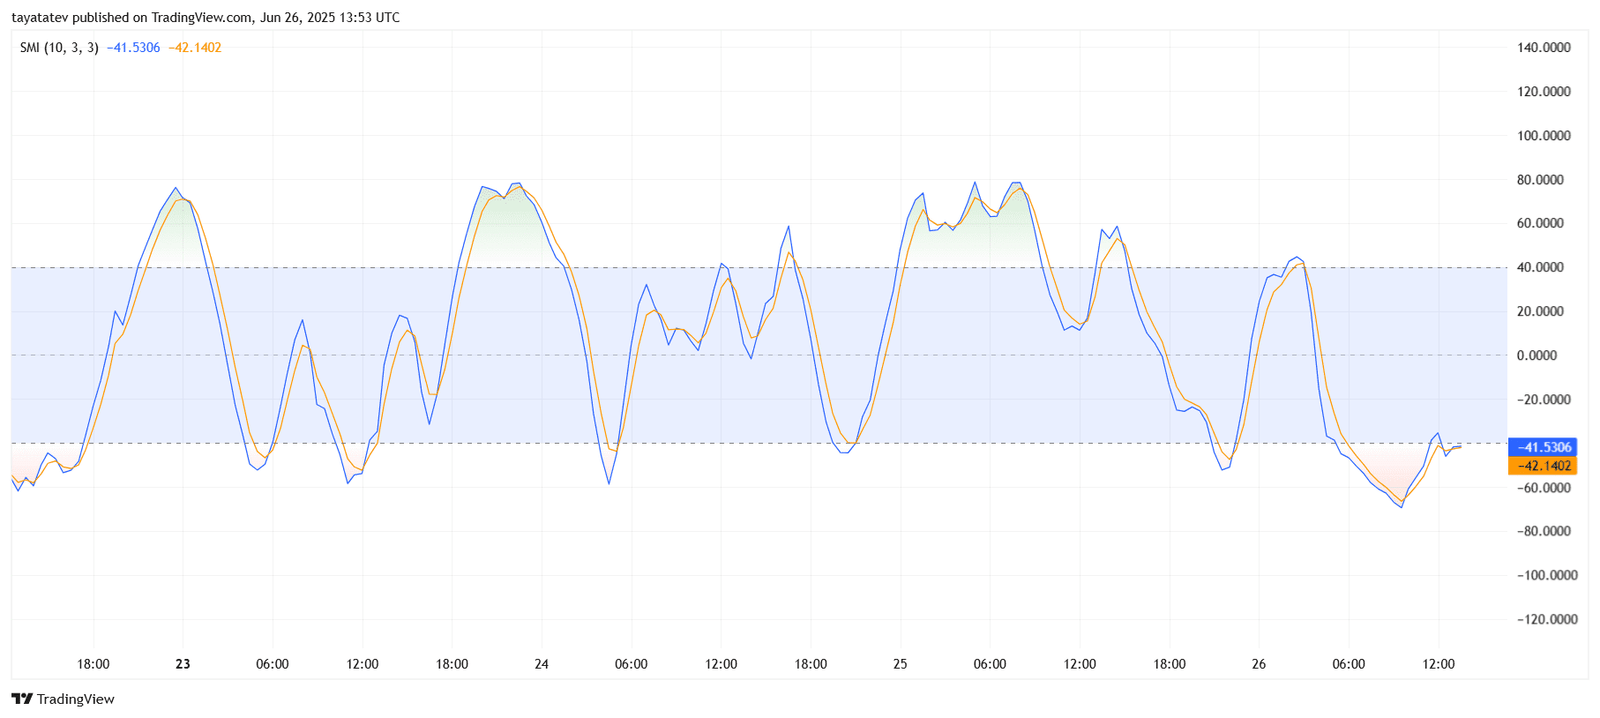
Earlier in the chart, between June 24 and 25, the SMI fluctuated near or above the 40 level, suggesting temporary bullish strength. However, a clear downtrend started after June 25, with both SMI lines trending downward and dipping well below zero. The most recent crossover—where the blue line attempted to rise above the orange but failed—confirms weak buyer activity and a continuation of downward momentum.
This indicator aligns with the RSI, which also signals an oversold market. Despite a minor upward curve forming in both SMI lines, the values remain below the neutral zone. Unless a strong crossover happens and both lines move above the -20 threshold, bearish sentiment is likely to persist.
