
Pi Network price surged 27% this week, reaching an intraday high of $0.7259 on May 10, 2025, based on TradingView data. The price closed at $0.7237 on the 4-hour chart against Tether (USDT) on OKX. This move followed a strong rally from below $0.60.
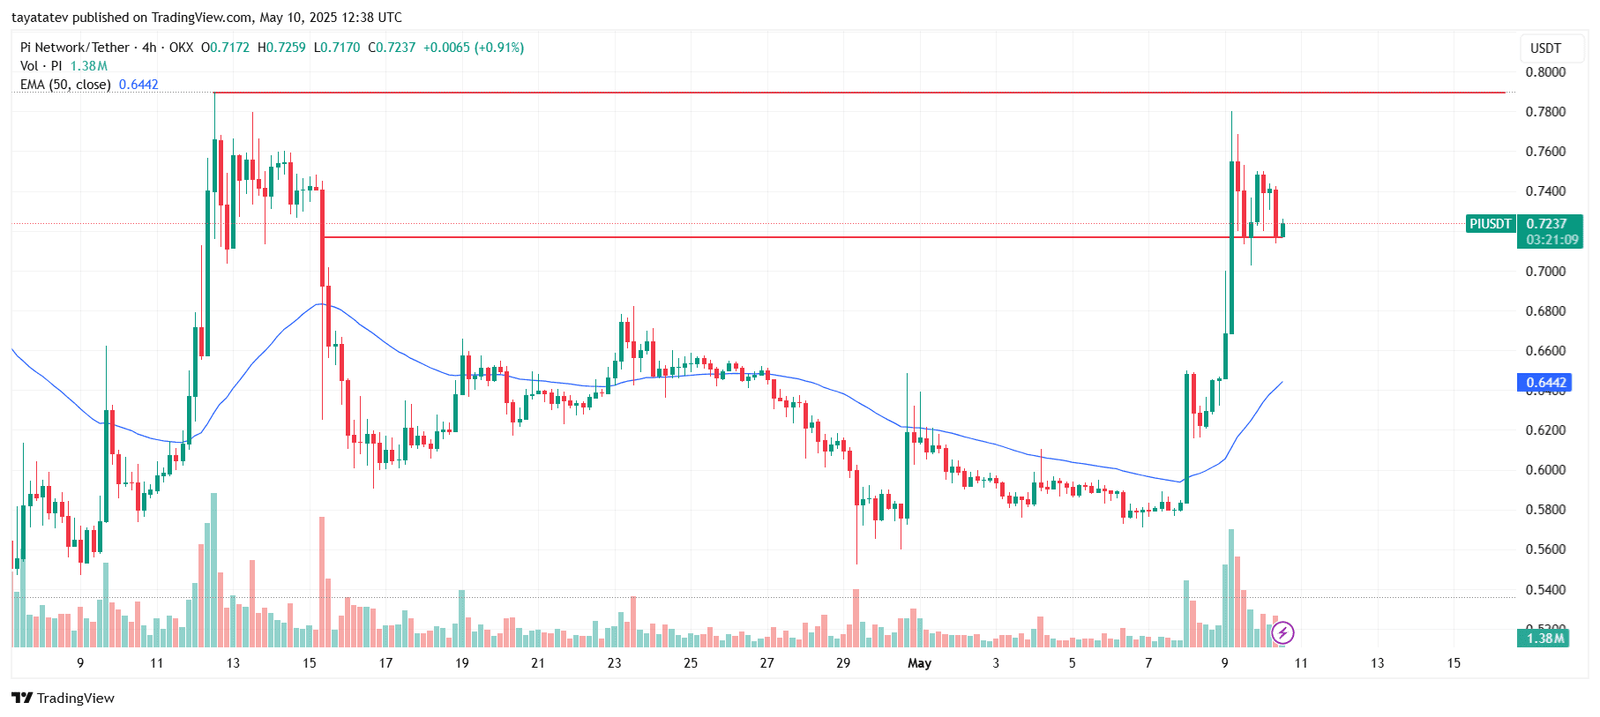
The Pi coin now trades just above the $0.71 support level. This support level is visible in the consolidation range forming after the recent breakout. The price remains in a narrow zone between $0.71 and $0.73.
According to the same chart, Pi Network faces heavy resistance near $0.78. This level previously acted as a ceiling in mid-April and continues to limit further upside.
Pi Network RSI Nears Overbought Zone on 4H Chart
The Pi Network RSI (Relative Strength Index) reached 64.95 on May 10, 2025, based on the 4-hour TradingView chart. RSI is a technical indicator that measures momentum. It ranges from 0 to 100, with levels above 70 typically considered overbought and below 30 oversold.
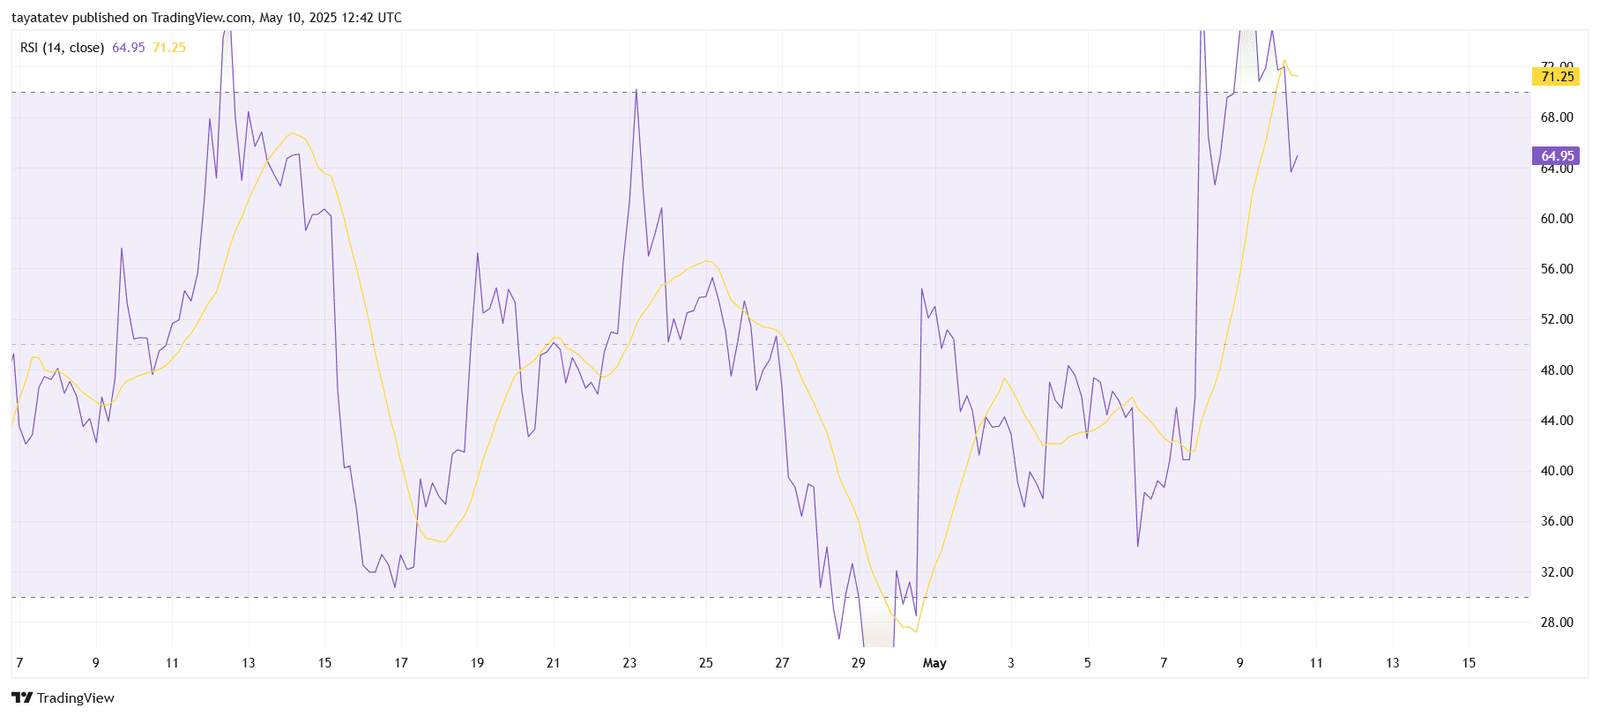
Currently, Pi Network RSI sits just below the overbought threshold. The signal line (a moving average of RSI) is at 71.25, placing it inside the overbought region. This gap suggests that recent upward momentum has been strong but may be slowing slightly as RSI pulls back from its peak.
Over the past three days, the RSI jumped from below 40 to nearly 65, indicating a fast shift in market sentiment. Such movements often reflect aggressive buying activity. However, the current RSI level shows that while Pi Network has bullish momentum, it is approaching a zone where upward movement may begin to slow or pause.
This RSI setup reflects increased demand for Pi coin, backed by short-term price rallies. Combined with higher volume and support levels holding, it confirms that momentum remains positive. Traders commonly use RSI alongside other indicators to verify price trends and potential reversals.
Pi Network CMF Signals High Inflows
The Pi Network CMF (Chaikin Money Flow) indicator has shown a sharp increase. A rising CMF reflects strong capital inflow into the asset. This means that money is entering Pi Network from buyers.
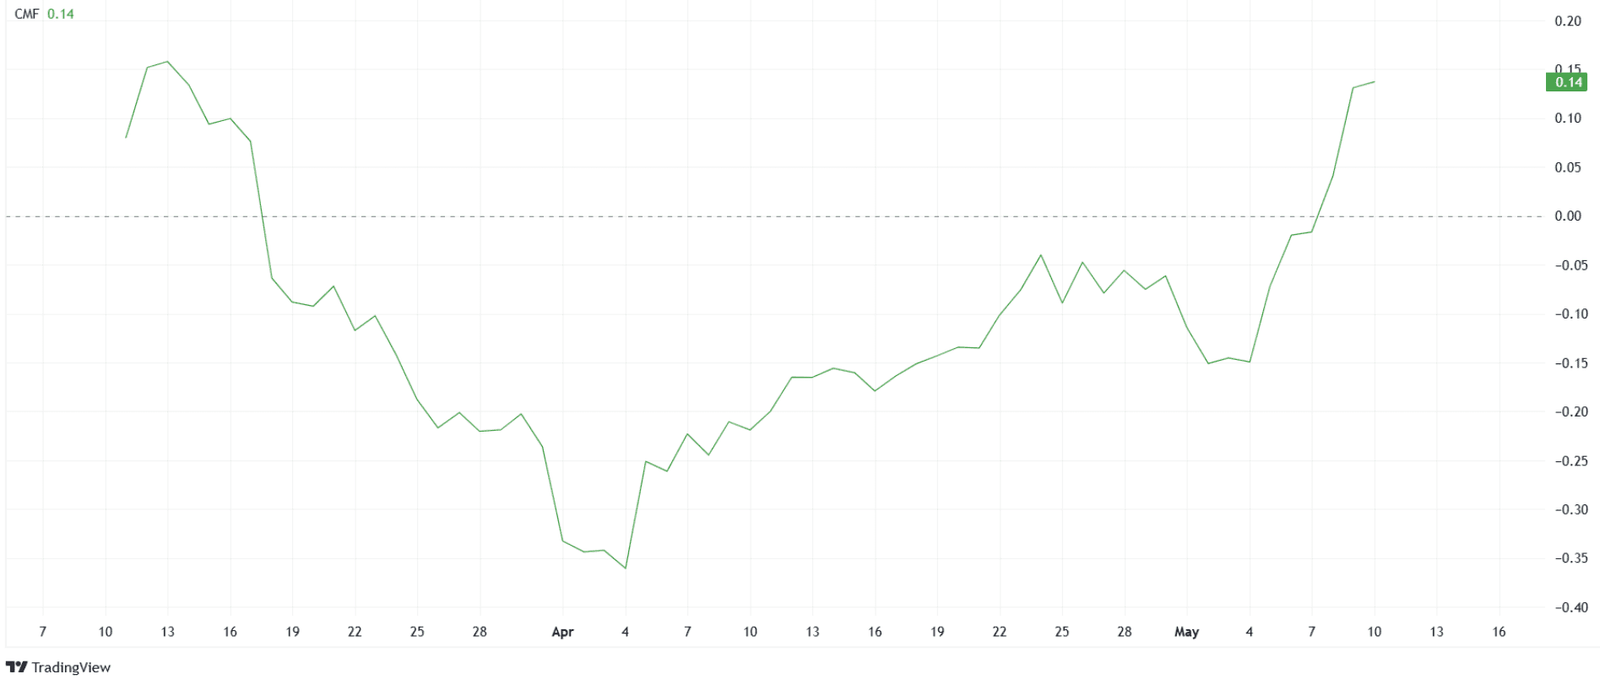
A positive CMF reading also aligns with increased demand for Pi coin. It supports the recent price rise and shows confidence in the current trend. The indicator suggests that traders are adding to their Pi coin positions.
According to TradingView charts, Pi Network CMF is now in positive territory. This supports the altcoin’s momentum and aligns with the RSI signal. Both indicators point to continued strength if conditions hold.
Pi Network Trading Volume Supports Market Strength
Pi Network trading volume increased this week, supporting the upward movement. Higher volume confirms active participation in the market. It shows that buyers are entering at the current price level.
Volume data also confirms the strength behind Pi Network price gains. Without strong volume, price increases may not hold. In this case, the volume has risen alongside price and indicators like RSI and CMF.
Pi Network trading volume is one of the key metrics confirming bullish behavior. The increase strengthens the case for continued price stability near resistance. But the next move depends on how the price reacts to the $0.78 barrier.
