
On June 1, 2025, Pi Network (PI/USDT) traded at $0.6400 on OKX, slipping nearly 2% on the day. The token dropped below its short-term support zone while failing to reclaim key Fibonacci resistance levels.
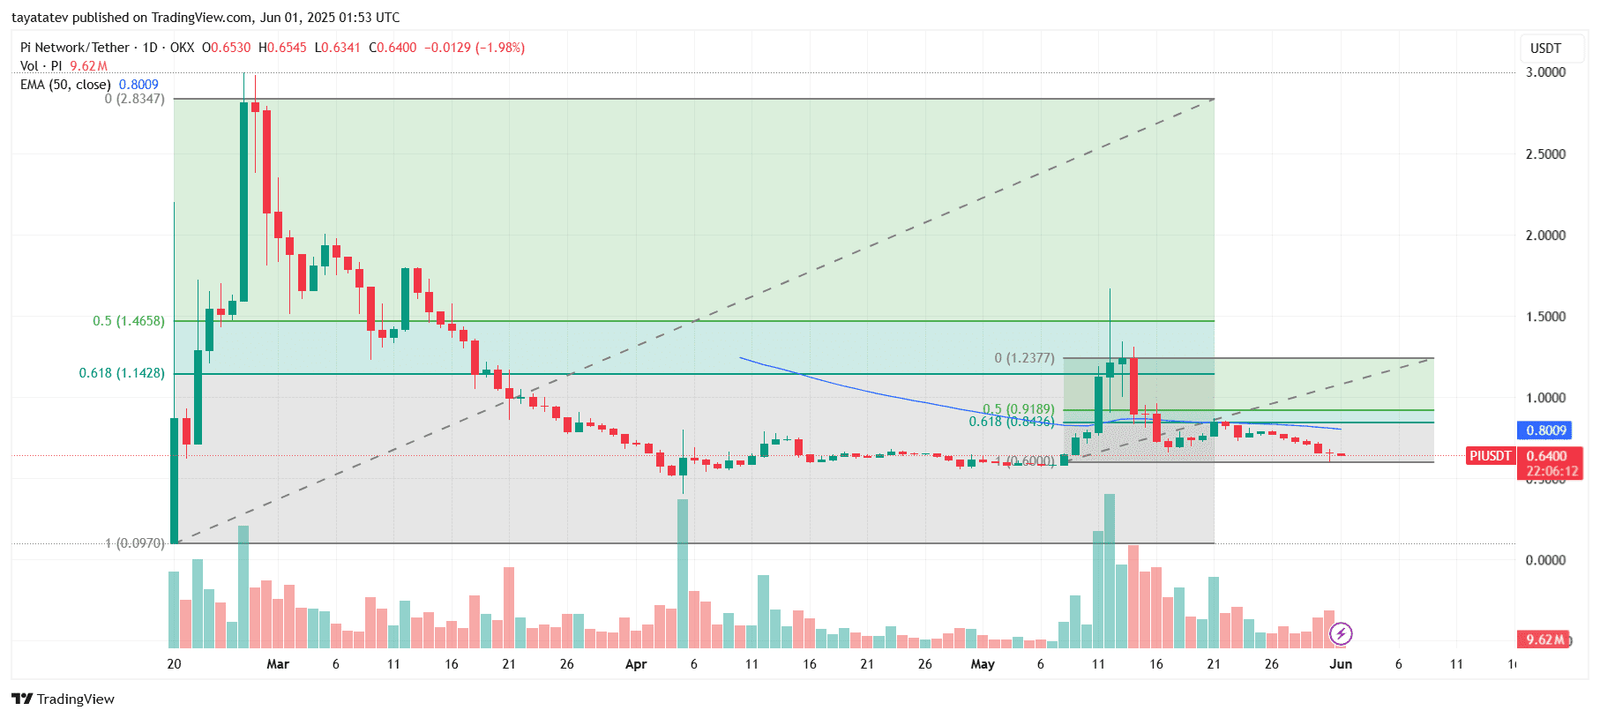
The chart shows two Fibonacci retracement ranges. The primary retracement spans from the $0.0970 low to the $3.00 peak. Within this range, the 0.618 level sits at $1.1428—often called the golden zone, where strong reversals tend to happen. However, PI failed to break past this zone during its May rally.
A second, more recent retracement range runs from $0.6000 to $1.2377. Key resistance levels include the 0.5 mark at $0.9189 and the 0.618 zone at $0.8436. These levels acted as local ceilings in late May. Price failed to sustain momentum above them and has since trended lower.
Currently, PI trades close to its immediate support near $0.6400. If bears push the price below $0.6000—the base of the recent Fibonacci range—the next downside target could fall back to earlier April levels. The chart shows fading volume over recent sessions, pointing to weakening bullish interest.
The 50-day Exponential Moving Average stands at $0.8009, now acting as resistance. Bulls would need to reclaim this level to shift momentum upward. Until then, the trend remains tilted to the downside.
With Pi Network trading below key resistance zones and failing to maintain bullish structure, the technical outlook signals continued bearish pressure unless $0.6000 holds.
Pi Network Trend Reversal Confirmed as BBTrend Turns Positive on June 1
The Pi Network (PI/USDT) BBTrend indicator flipped into positive territory for the first time since April. The indicator, which stands for Bollinger Band Trend, rose to +9.8849, signaling a possible momentum reversal after nearly two months of persistent selling pressure.
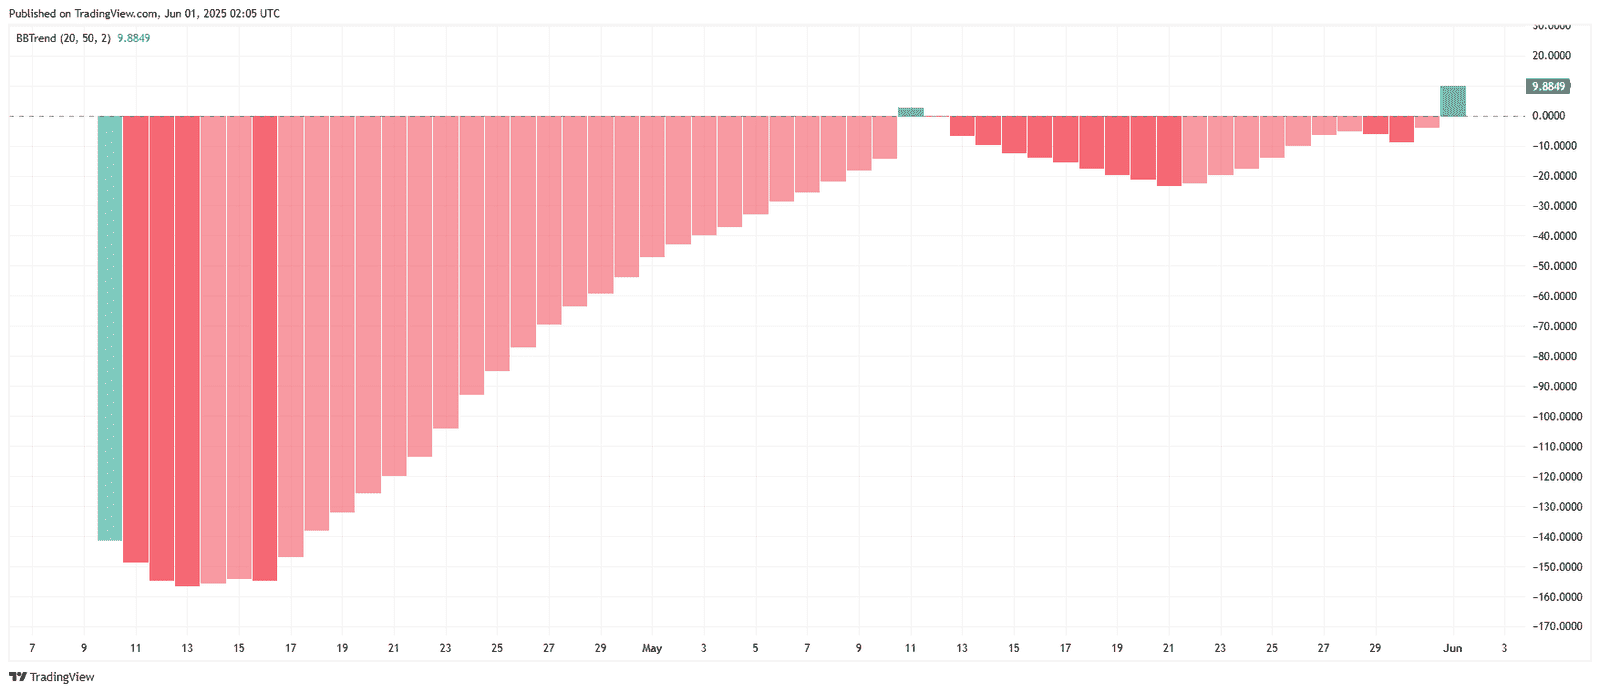
From April 10 to May 30, the BBTrend remained negative, marking a continuous downtrend. During this period, the indicator fell as low as -165, reflecting strong bearish sentiment. However, the trend began moderating in late May, gradually recovering toward the zero mark.
On May 31, the BBTrend briefly crossed into positive territory before dipping again. The full confirmation came on June 1, when the reading surged to +9.8849. This breakout marks the strongest positive shift in over two months.
The BBTrend combines Bollinger Bands with trend strength to measure momentum. A positive BBTrend value suggests bullish momentum, while a negative one points to sustained selling. The higher the value, the stronger the directional strength. The formula typically uses a setting of (20, 50, 2), as shown on this chart.
This bullish crossover comes after PI/USDT’s price hit the $0.6400 zone, where some buyers started stepping in. Although price remains under key Fibonacci resistance, the trend indicator’s flip suggests that bearish momentum has weakened for now.
Stochastic Momentum Index Shows Weak Recovery for Pi Network
On June 1, 2025, the Stochastic Momentum Index (SMI) for Pi Network (PI/USDT) remained in deep negative territory, with values at -66.29 for the main line and -62.92 for the signal line. This indicates that bearish pressure continues, although the gap between the lines is narrowing.
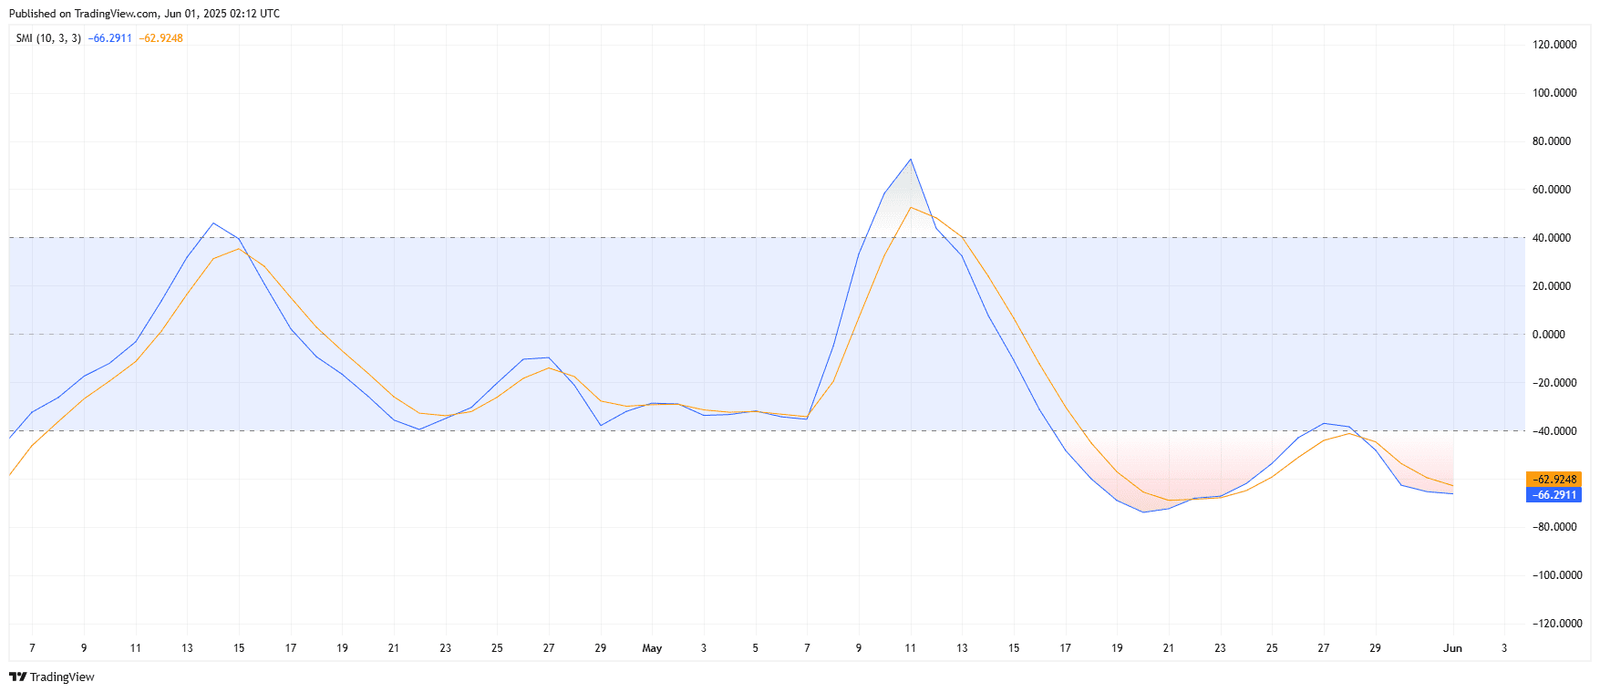
The SMI measures the position of the current close relative to the midpoint of recent highs and lows. Unlike traditional stochastic indicators, it smooths both the momentum and signal components for clearer reversal signals. Values below -40 often show strong bearish momentum.
Since peaking on May 12, both lines have steadily dropped. The index crossed below zero by May 16 and entered oversold territory under -40 by May 18. Despite a minor uptick on May 27, the indicator remains below critical reversal zones.
The blue line (SMI) crossed above the orange signal line briefly in late May but failed to hold. That fake-out indicated weak bullish interest. As of June 1, the lines are close again but still slope downward, showing no clear confirmation of a trend reversal.
The current reading below -60 suggests continued downside momentum unless the SMI crosses above -40 and the main line overtakes the signal line. Traders often watch this behavior for early signals of potential bounce formations.
MACD Turns Bearish for Pi Network as Momentum Slips Below Zero
Meanwhile, the Moving Average Convergence Divergence (MACD) indicator for Pi Network (PI/USDT) confirmed bearish momentum. The MACD line dropped to -0.0242, while the signal line stood at -0.0024. The histogram also printed a negative bar of -0.0218, extending a downtrend that started mid-May.
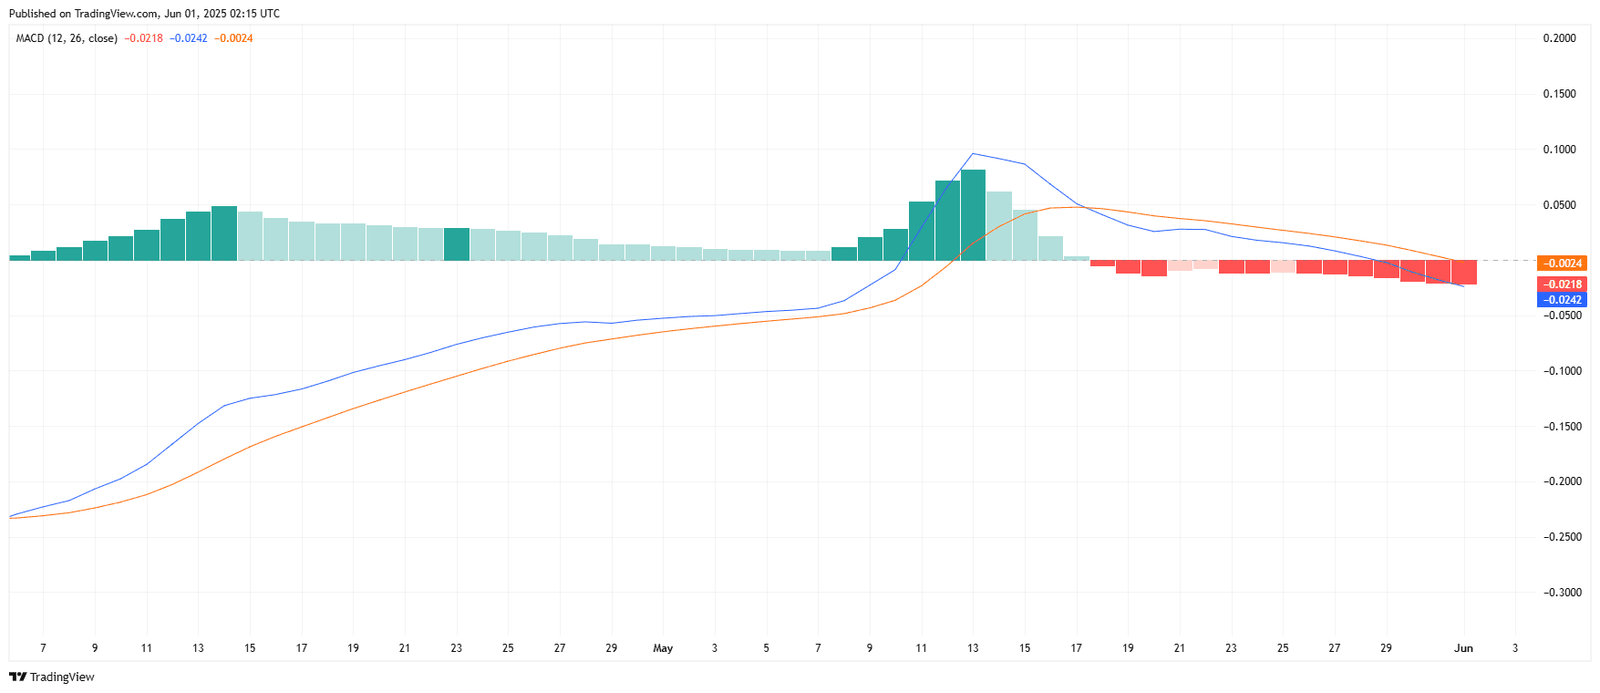
The MACD, calculated using the 12-day and 26-day exponential moving averages, crossed below the signal line on May 18. This crossover marked the end of bullish momentum that had driven prices up earlier in May. The histogram has remained red for over 13 consecutive sessions, showing growing downside pressure.
The bullish run began in early May and peaked around May 12, when the MACD line reached its highest level above 0.15. Since then, both the MACD and signal lines have declined steadily, with the gap widening throughout late May.
As of June 1, there is no bullish divergence between price and MACD. The trend continues to weaken, and both lines remain below the zero mark. Traders typically wait for a bullish crossover and a histogram flip above zero to confirm recovery.
Directional Movement Index Shows Weakening Trend Strength for Pi Network
On June 1, 2025, the Directional Movement Index (DMI) for Pi Network (PI/USDT) signaled declining trend strength, with the Average Directional Index (ADX) at 26.0066, slightly above the baseline threshold of 25. The positive directional index (+DI) printed 24.2571, while the negative directional index (–DI) stood at 22.7035.
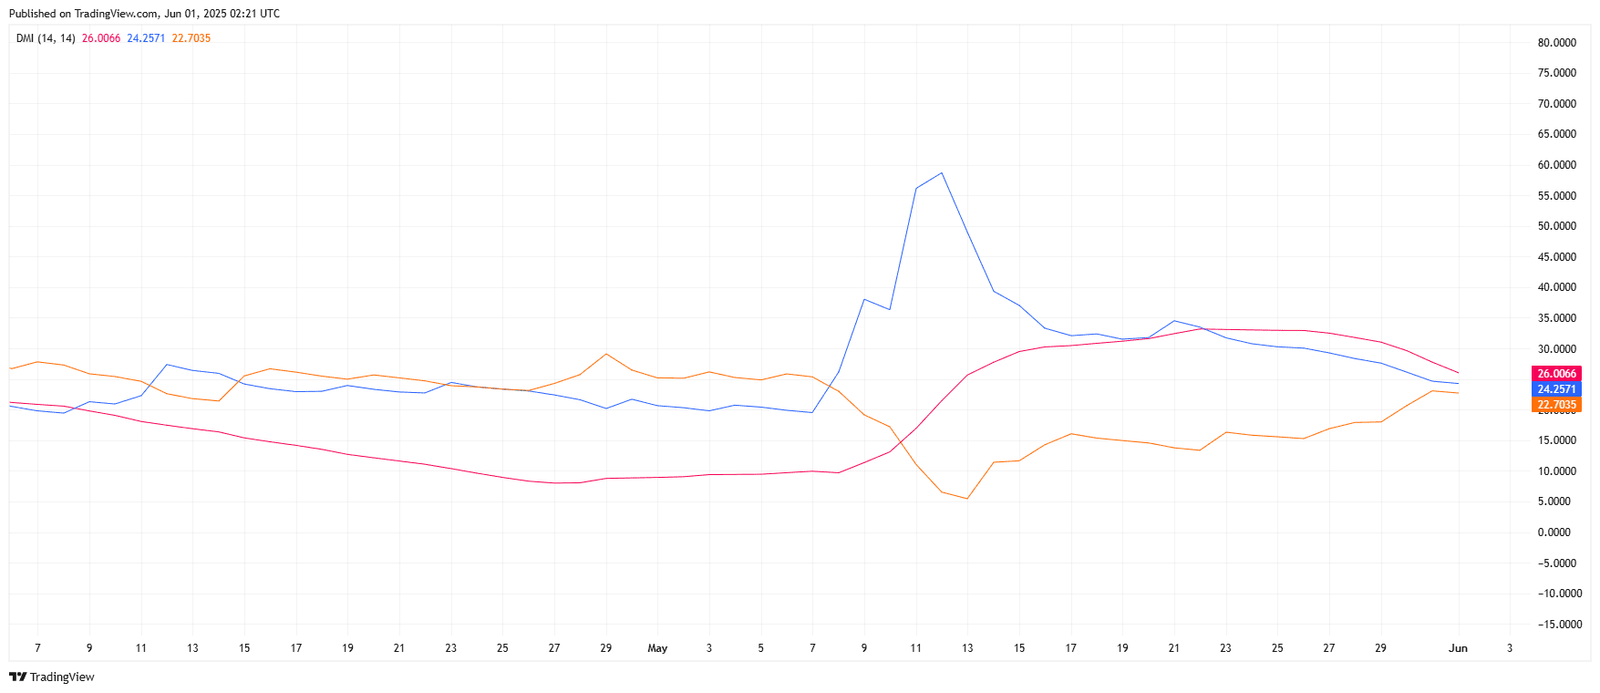
The ADX, which measures overall trend strength regardless of direction, peaked above 70 on May 12, confirming a strong uptrend during the Pi price rally. Since then, the ADX has steadily dropped, showing weakening momentum in either direction. A reading above 25 typically signals a valid trend, but the current drop toward 25 suggests trend exhaustion.
The +DI (blue line) and –DI (orange line) remain close, with the gap narrowing over the past week. The bullish advantage seen in early May has mostly disappeared, and neither side shows dominance. This convergence points to a possible range-bound or indecisive phase unless a fresh breakout occurs.
If the ADX drops below 25 in the coming sessions, it would confirm a non-trending market, where price action may turn sideways. A widening gap between +DI and –DI would be needed to confirm any new direction.
