
Key Takeaways:
- Out of 53 top VC firms and hedge funds, a majority have invested in Polkadot, as per a Messari report.
- Meanwhile, DOT prices are down for the second week in a row.
NEW DELHI (CoinChapter.com) — Blockchain-based distributed computing platform, Polkadot (DOT), is the most sought-after crypto asset by top venture capital firms and hedge funds, as per a report by Messari.
Crypto insights and research data firm Messari shared its Messari Fund Analysis report for Q3 2021. Their analysis analyzed 53 funds that hold a combined 228 unique assets across various sectors, including DeFi, scaling, NFTs, and smart contracts.
Messari’s Report
As per Messari’s report, 21 out of the 53 funds or 39.6% of the funds own DOT, the native token of the Polkadot network. As such, these funds have a vested interest in Polkadot’s success. Furthermore, Messari’s analysis assumes that most of the 53 funds hold Bitcoin (BTC) and Ethereum (ETH), which they excluded from their report.
The report also highlighted that funds with big DOT holdings would likely determine which projects would end up with the first parachains. In detail, parachains are Layer-1 individual blockchains that run in parallel with the Polkadot ecosystem.
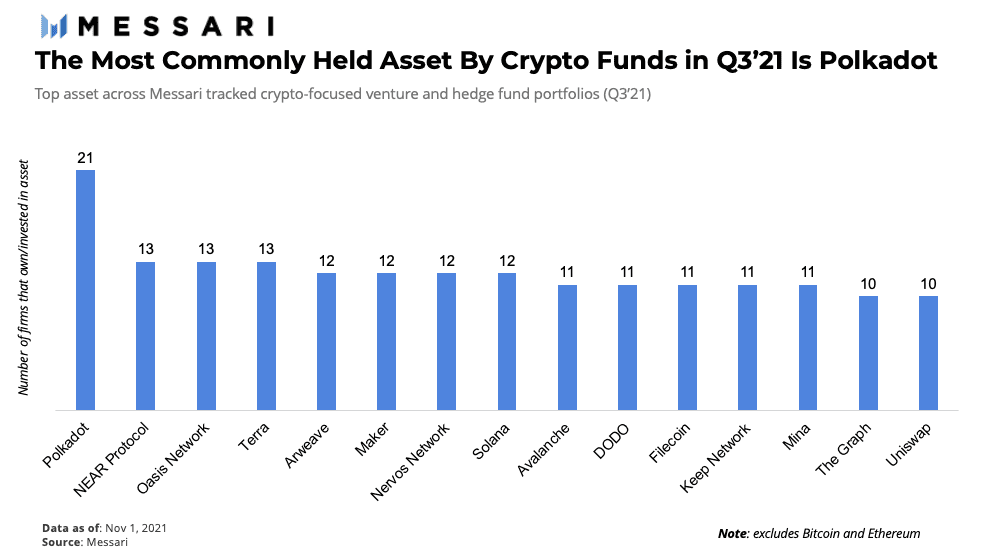
After Polkadot, the second most popular crypto asset is a tie between Near Protocol (NEAR), Terra (LUNA), and Oasis Network (ROSE). Near Protocol and Oasis Network are both smart contract platforms but with lesser adoption than their competitors, such as Solana, Ethereum, etc.
Also Read: DOT picked up 5%, as the first Polkadot parachain auction went live.Solana, Arweave, Maker, and Nervos Network stand third in the list of most favored assets. However, of all the assets covered in Messari’s report, Solana has the highest market cap. Venture investors favor the smart contract and DEX space within the top-funded assets. Both these sectors received the maximum investment from the 53 tracked firms.
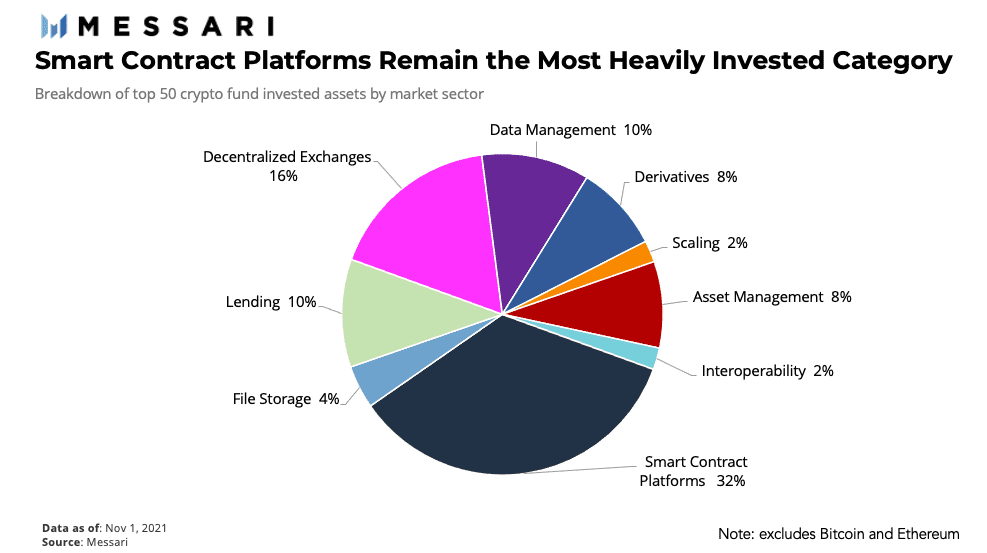
Blockchain lending platforms and data management firms are sectors which investors prefer next. Messari also highlighted that more VC investors are looking to invest in data management protocols due to the growing popularity of Web 3.0.
Finally, Messari concluded by highlighting that investing in crypto assets has become easier. They also highlighted that copy trading portfolios of VC firms might appear a good idea but warned investors to exercise caution. The firm also stated that opportunities in the crypto world are ten times better than in the traditional financial world.
Meanwhile, Polkadot invited its token holders to vote on the platform’s future branding. The decision would affect the brand identity and logo design.
Polkadot Price Charts
Polkadot prices fell 29.48% from their ATH of $56.21 that it reached on Nov 4. However, DOT gained 101.6% from Oct 1’s low of $27.877 to Nov 4’s high of $56.21. Since then, the Polkadot token has been in a downtrend. Moreover, Thursday’s price action pulled DOT prices below their 50-day moving average, making it bearish in the short-term range.
Also Read: Polkadot (DOT) rallies to new all-time high after announcing its long-awaited parachain slot auction.At present, DOT has immediate resistance at $43.69. Further resistance comes from the 26-day Exponential moving average at $45.34. In the case of a bull run, Polkadot prices would likely reach $47.57 before any pullback occurs.
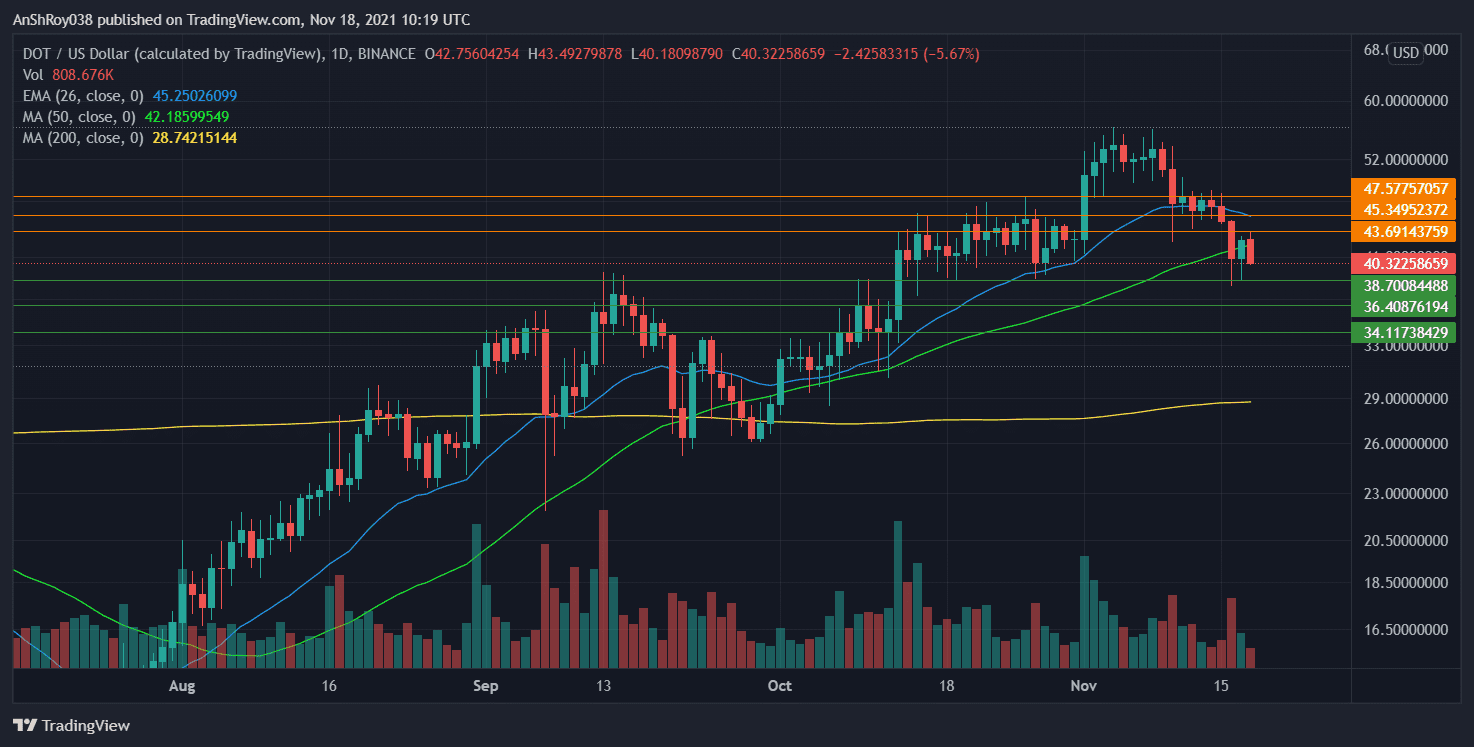
On the other hand, if DOT’s downtrend continues, it would seek support from the $38.70 price level, which has remained a key support level since Oct 13. If the downtrend continues, the Polkadot token would likely move to $36.40 before rebounding.
A sustained sell-off could see DOT prices decline to $34.11 before recovering.
Meanwhile, the downtrend has led to DOT’s MACD giving bearish signals. Bars on the MACD histogram are getting increasingly negative. The histogram plots the difference between the MACD line (difference between 12-day and 26-day) and the MACD signal line (9-day EMA of MACD).
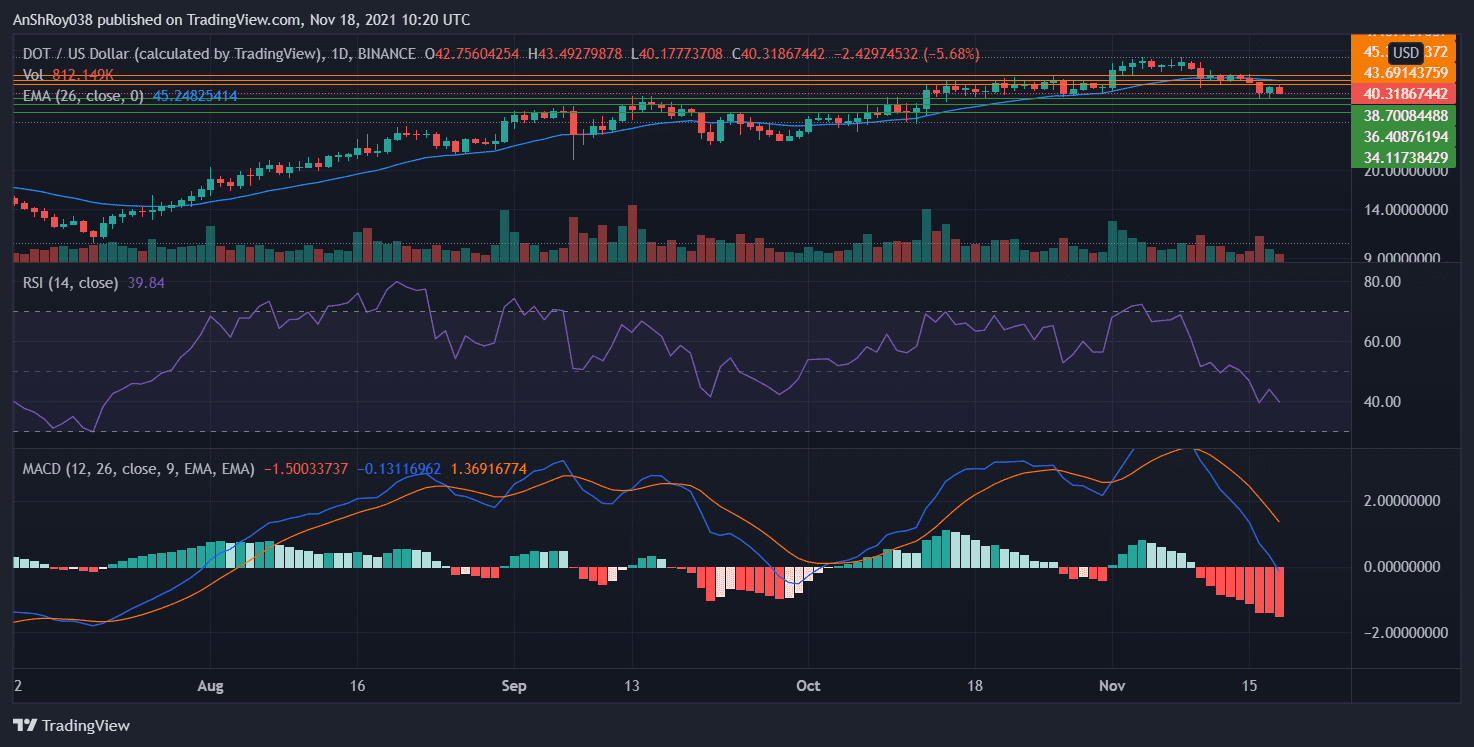
The increasingly negative histogram bars indicate that the MACD line is moving farther away from its signal line.
The relative strength index for the Polkadot crypto is neutral, with a value of 39.84. However, the RSI trendline seems to be moving south towards the undervalued regions. If the RSI goes below 30, it indicates that DOT might be ready for a trend reversal.
At the time of writing, DOT was trading at $39.36, down 7.96% on the day.

… [Trackback]
[…] Find More on that Topic: coinchapter.com/polkadot-not-bitcoin-the-most-commonly-held-crypto-across-institutional-portfolios/ […]
… [Trackback]
[…] Read More here to that Topic: coinchapter.com/polkadot-not-bitcoin-the-most-commonly-held-crypto-across-institutional-portfolios/ […]