
Key Takeaways:
- Polygon’s MATIC token has painted an inverted cup and handle pattern, which forecasts a likely 52% drop from current prices.
NEW DELHI (CoinChapter.com) — Polygon prices failed to reclaim $2 as MATIC fell 19.4% from Feb 10’s high of $2.068 to reach a low of $1.667.
Moreover, the Polygon token has painted a bearish technical pattern called the inverted cup and handle. In detail, the pattern forms when an assets price action switches from bullish to bearish over time, followed by a short-term bullish continuation.
The earlier price movement forms a crescent shape similar to an inverted cup, with the bullish rebound forming the handle.
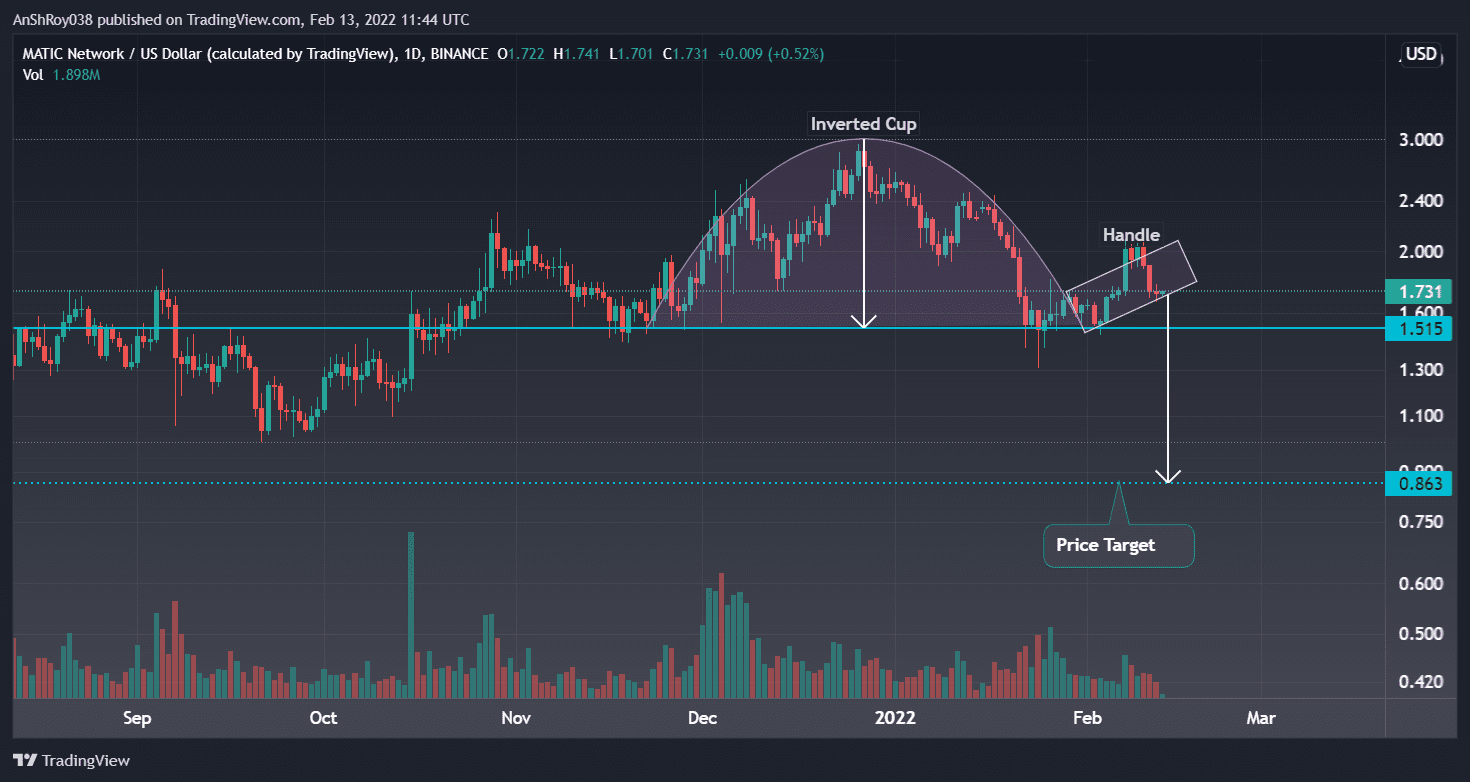
If the pattern holds, MATIC could break below the handle to begin a downtrend. The price target in an inverted cup and handle pattern equals the length of the pattern’s highest point measured from the inverted cup’s base.
Also Read: Polygon (MATIC) jumps 22% after raising $450M in Sequoia-led funding round.As such, the Polygon token’s prices could likely reach $0.863, a drop of 51.9% from current price levels.
In hindsight, Polygon prices have been trending downwards since the MATIC token entered 2022, a likely result of bears profit-booking after MATIC reached an ATH of $3.003 on Dec 27. MATIC prices are currently down by nearly 42% from their ATH.
Death Cross Likely For Polygon
Polygon might paint another bearish technical pattern soon. MATIC’s 50-day Moving Average (50-da MA, yellow wave) seems poised to move below the token’s 100-day MA (purple wave) trendline.
A death cross forms when an asset’s short-term moving average moves below its relatively long-term moving average. Traders interpret the pattern as forecasting negative sentiments and weakness in the asset’s price action.
A death-cross fuelled sell-off could see MATIC price breaking below the inverted cup and handle pattern. As such, MATIC would likely test support near its 200-day MA line (red wave) at $1.68. A combination of bearish technical patterns would likely result in a market-wide sell-off, pushing prices to $1.6.
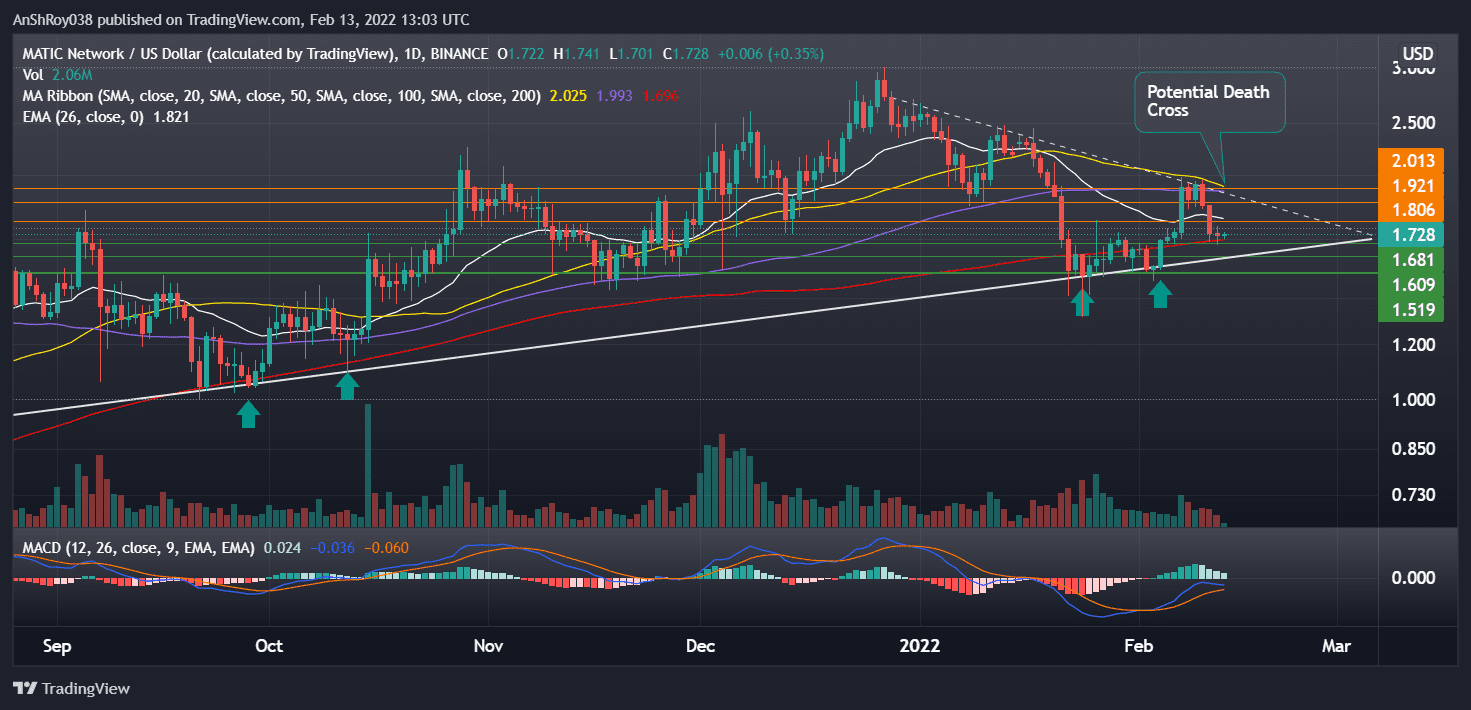
However, key support for MATIC comes from a multi-month ascending (white) trendline. Polygon prices have tested the support trendline four times in the time frame. At present, MATIC is currently moving to again test the trendline support, looking for a potential rebound.
The token would need to breach below 200-day MA before testing the trendline resistance.
Also Read: Polygon token MATIC flashed bearish technicals amid growing ecosystem.Meanwhile, bars on the MACD histogram, which plots the difference between the MACD line (difference of 12-day and 26-day EMA) and its signal line (9-day EMA of MACD), are contracting. In detail, contracting bars indicate weakening bullishness in the price momentum.
MATIC Trading Below Descending Trendline
In case MATIC rebounds from its support levels, the token has immediate resistance from its 26-day exponential MA (white wave) near $1.8. Further uptrend would take MATIC to challenge the multi-week downward sloping resistance near the $1.92 price level.
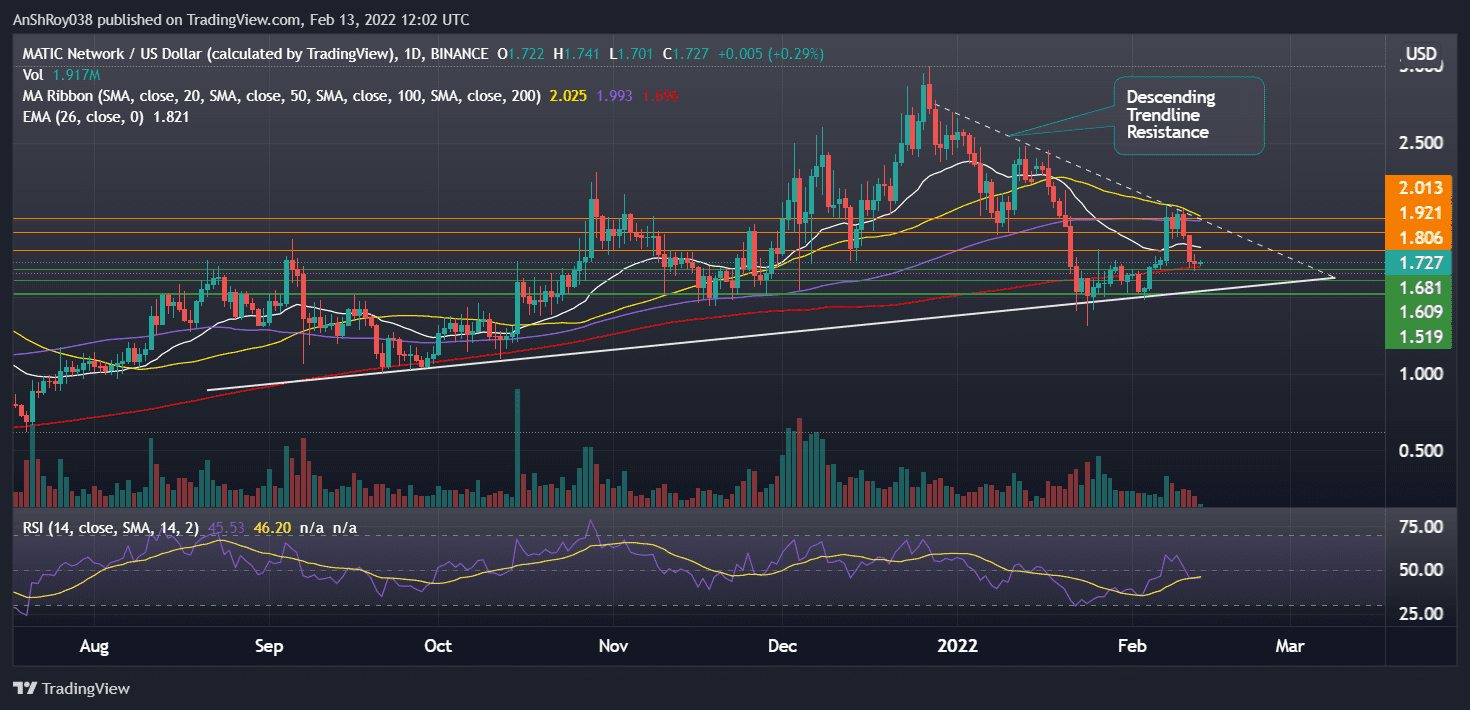
If the Polygon token breaks above the descending trendline resistance with rising trading volume, MATIC would likely try to reclaim $2 before prices pare. The relative strength index for MATIC is currently neutral, clocking 45.53 on the daily charts, with the RSI trendline moving downwards.
At the time of writing, MATIC was changing hands at $1.735, up 0.75% on the day.

… [Trackback]
[…] Info to that Topic: coinchapter.com/polygon-matic-paints-bearish-technical-pattern-risks-a-drop-of-nearly-52/ […]
… [Trackback]
[…] There you will find 48097 more Information on that Topic: coinchapter.com/polygon-matic-paints-bearish-technical-pattern-risks-a-drop-of-nearly-52/ […]
… [Trackback]
[…] Read More on that Topic: coinchapter.com/polygon-matic-paints-bearish-technical-pattern-risks-a-drop-of-nearly-52/ […]
… [Trackback]
[…] Read More Information here on that Topic: coinchapter.com/polygon-matic-paints-bearish-technical-pattern-risks-a-drop-of-nearly-52/ […]
… [Trackback]
[…] There you can find 53733 more Info to that Topic: coinchapter.com/polygon-matic-paints-bearish-technical-pattern-risks-a-drop-of-nearly-52/ […]