

YEREVAN (CoinChapter.com) – The crypto market has been through the wringer in the past month. Additionally, the global macroeconomic turmoil threatens to tank digital assets even lower. Thus, the bearish technicals on many altcoins don’t come as a surprise.
The pattern in question is dubbed the ‘descending triangle,’ and it appeared on more than one altcoin chart simultaneously.
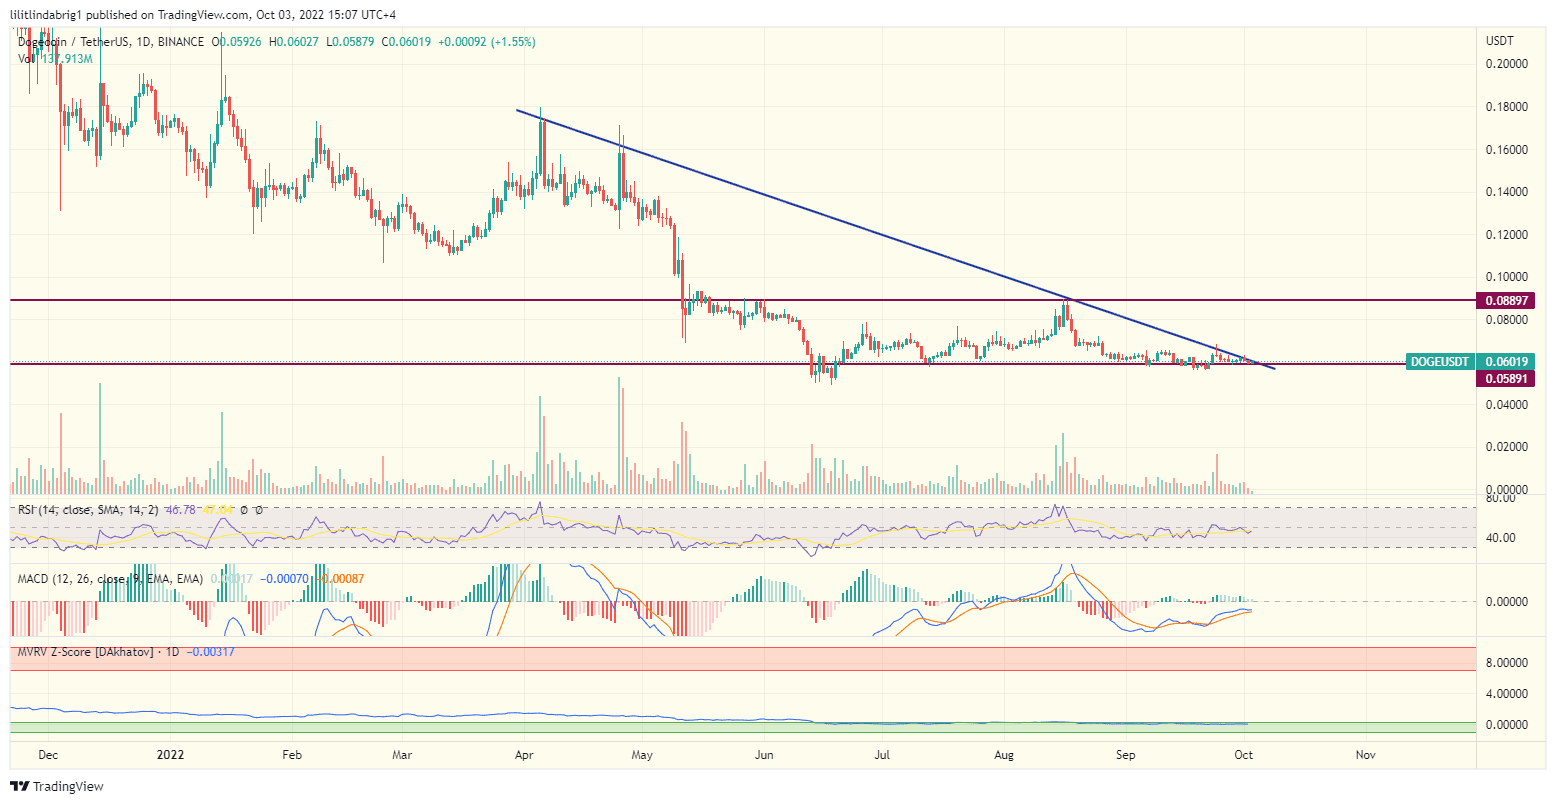
#1 Dogecoin (DOGE) Price Daily Chart
The meme coin king Dogecoin price stood at $0.06 on Oct 3, threatening to drop below $0.02 in the upcoming sessions. e descending triangle consists of a descending resistance line and flat support that prevents sharp depreciations.
However, once the price action breaks below the said support, the formation forecasts a drop equal to the maximal height between the trendlines, pinning the target below $0.02.
#2 XRP Price Daily Chart
The money transfer token also followed the descending triangle setup described above. Meanwhile, the XRP/USD price action confirmed the formation in May, falling below the support.
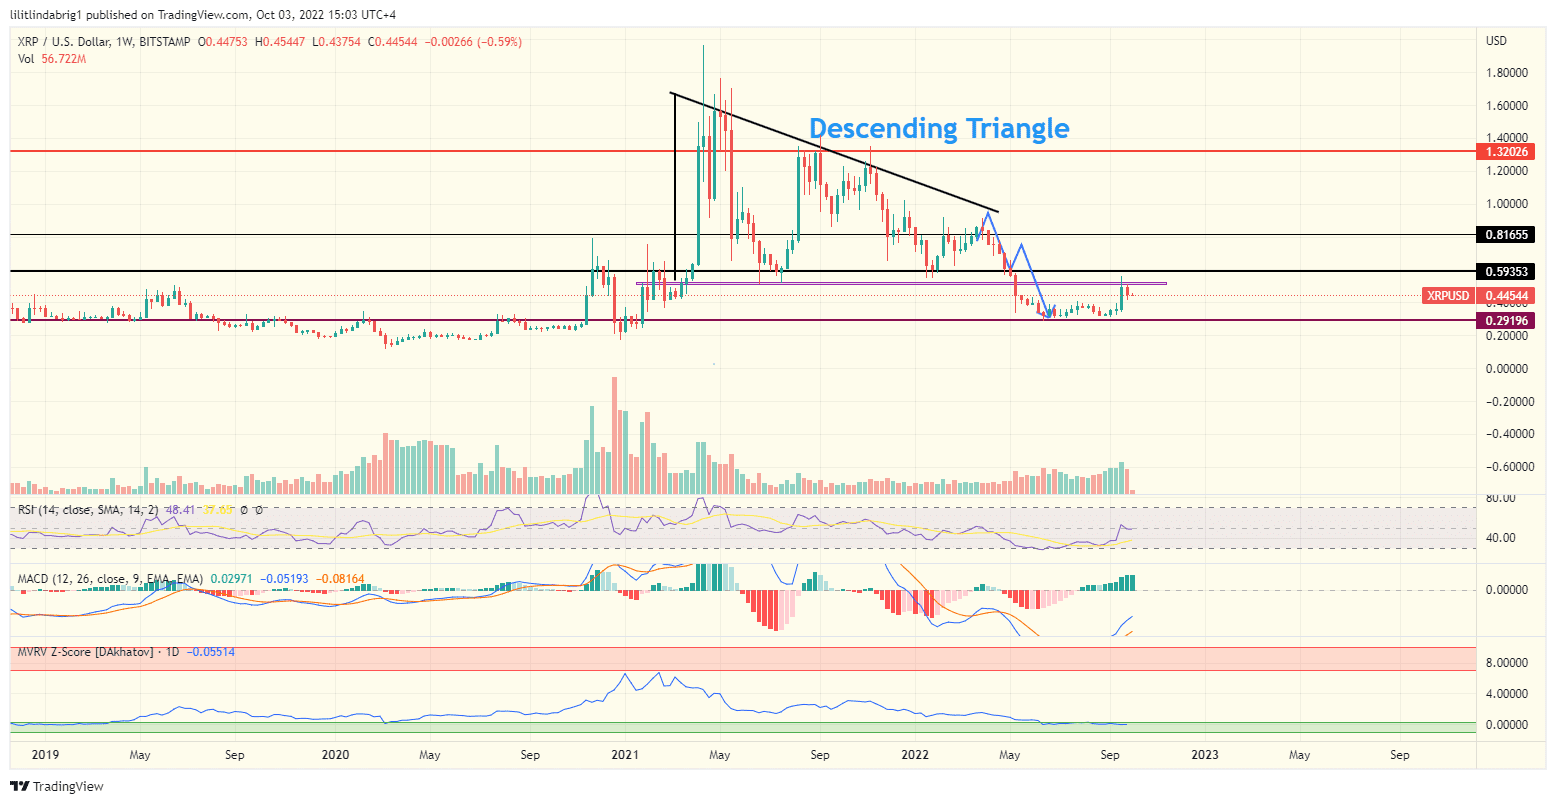
Thus, the triangle pinned the target price for XRP at approximately $0.2.However, the token’s drop didn’t quite reach the target and bottomed out at nearly $0.3, camping at the said support from June to September.
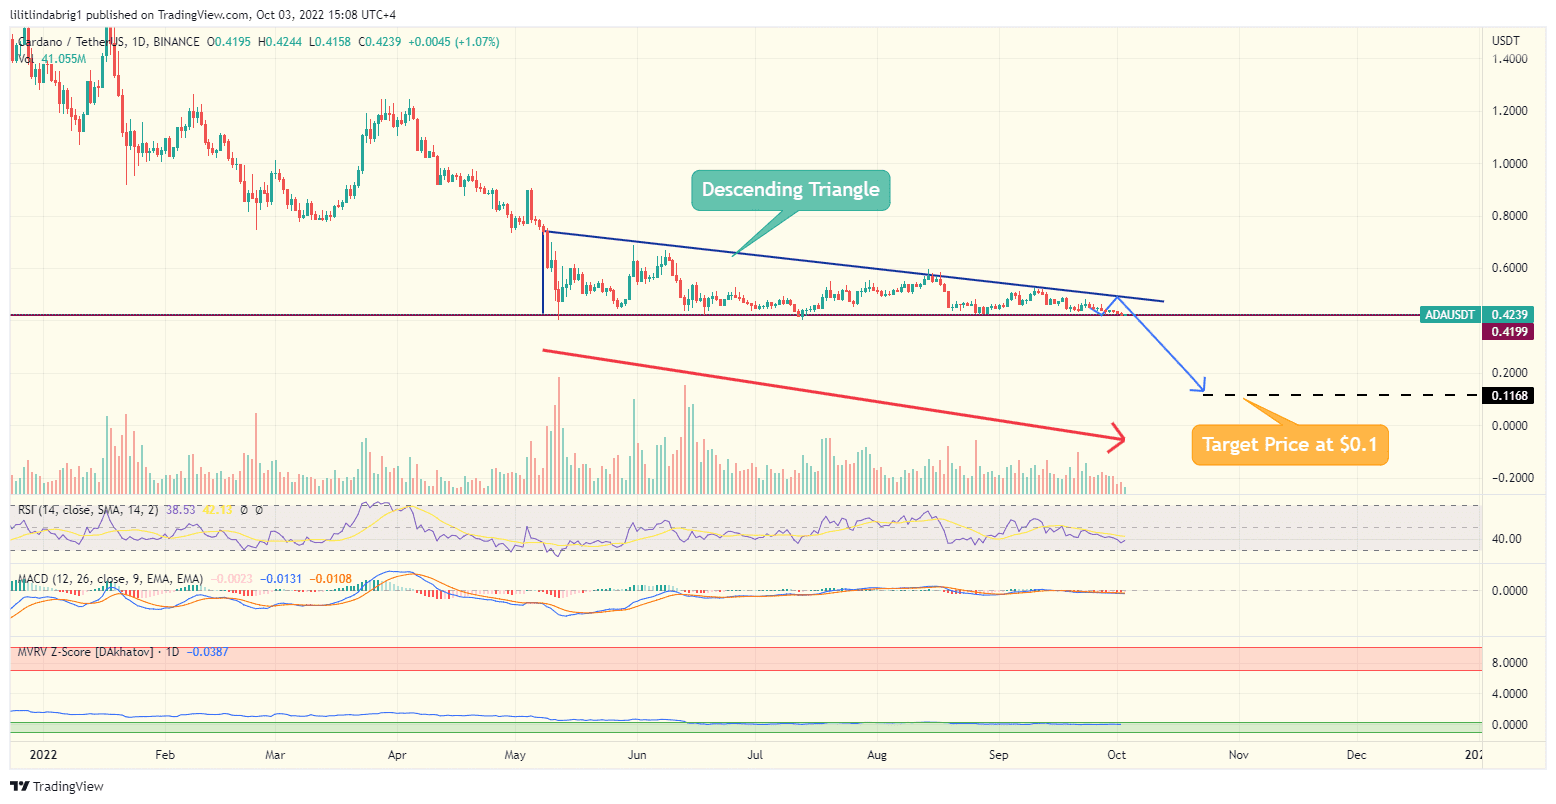
#3 Cardano (ADA) Price Chart
ADA followed the same path as the other two tokens on the list, trading at $0.42. Cardano’s in-house token could face a target price of $0.1 if the triangle is confirmed. However, it isn’t yet, as the price action stood at the support on Oct 3. The upcoming sessions will likely bring confirmation.
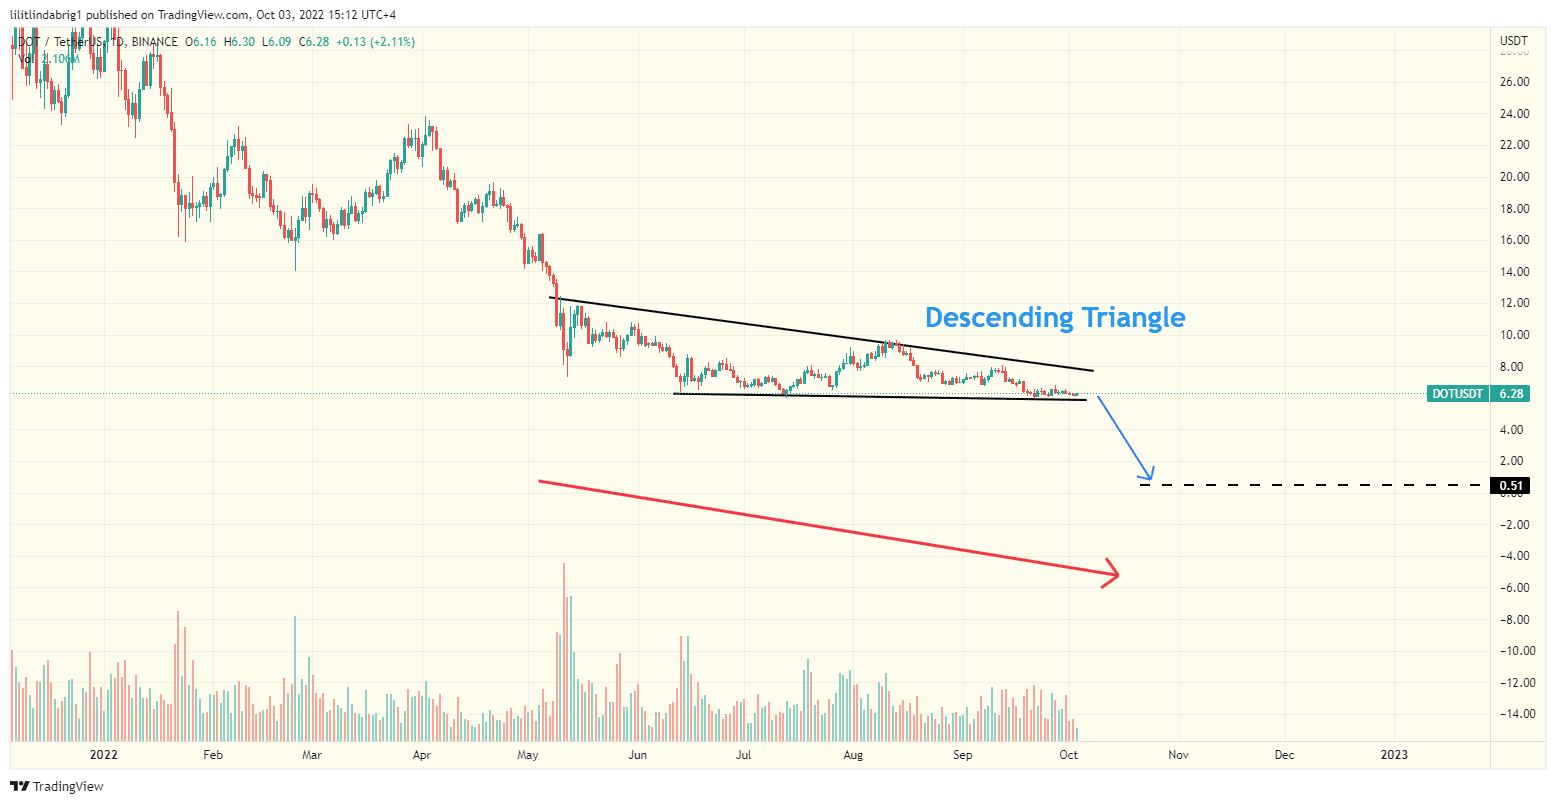
#4 Polkadot (DOT) Price Analysis Chart
DOT price action has flatlined for over a week, unable to get above $6.5 with any consistency. As a result, the digital asset price stood at $6.28 and, like ADA, was close to confirming the descending triangle.
#5 Polygon (MATIC) Price Technical Analysis
Unsurprisingly, Polygon’s MATIC token followed the route as well and confirmed the mentioned descending triangle in late April. The token reached its target price of $0.3. Since then, the digital asset advanced 148% and stood at $0.77 on Oct 3.

However, the token also flatlined for over a week, just like the other digital assets on the list, suggesting expectations of a similar pattern forward might be warranted.
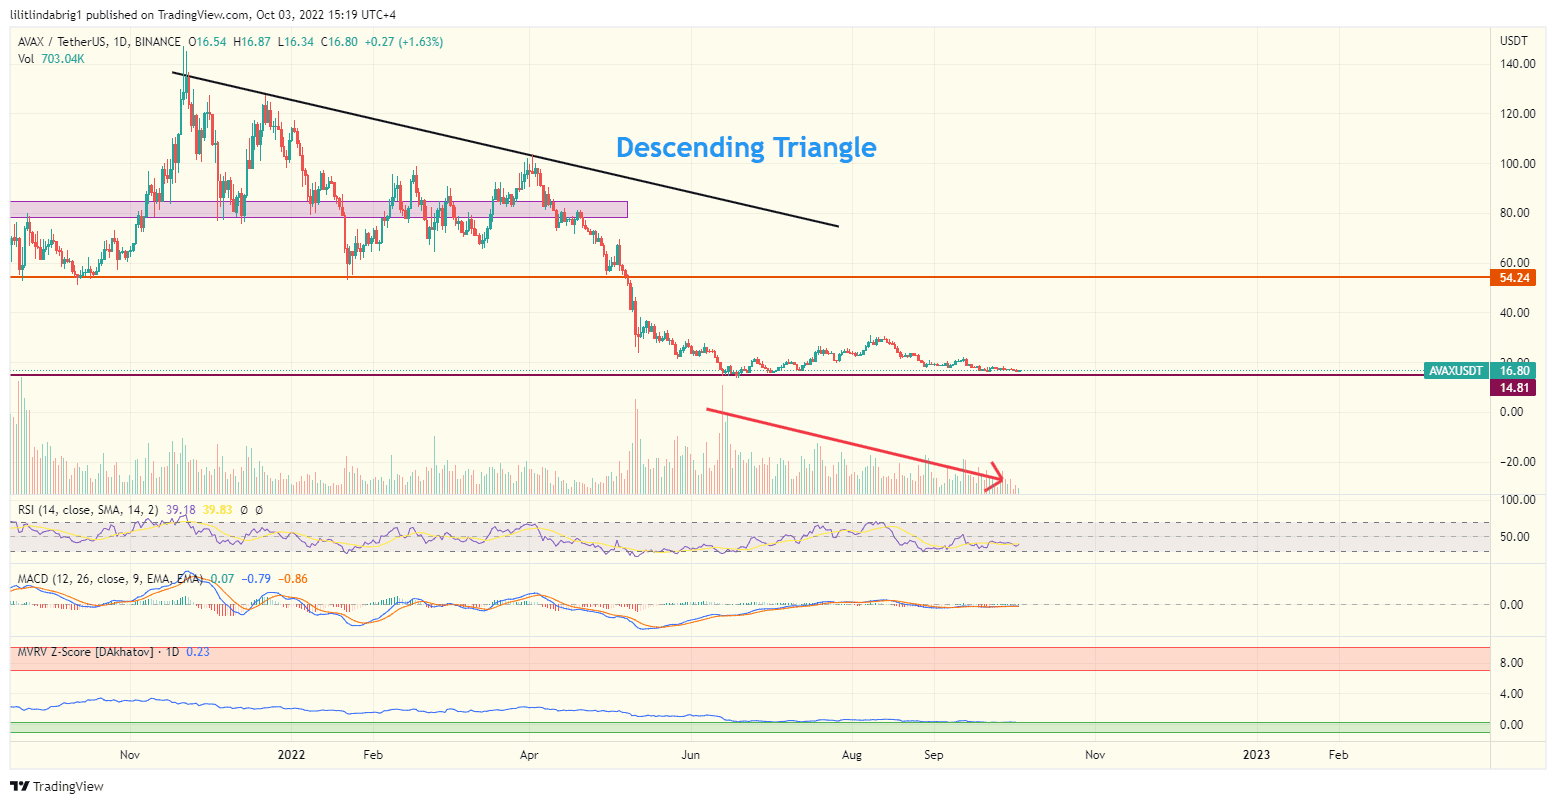
#6 Avalanche (AVAX) Price Analysis
Last but not least, Avalanche token AVAX formed and confirmed its triangle in early May as well. The price action lost nearly 70% after the drop to the target price. However, the token did not show any bullish signs.
Notably, all the charts presented above share another viable bearish bias predictor. The declining trading volumes on the charts suggest that the traders are not confident enough to put real weight behind altcoins. The crypto market as a whole could suffer more losses in the upcoming quarter if the geopolitical situation continues to escalate.

… [Trackback]
[…] Read More here on that Topic: coinchapter.com/price-dogecoin-xrp-ada-polkadot-dot-polygon-matic-avax/ […]
… [Trackback]
[…] Information on that Topic: coinchapter.com/price-dogecoin-xrp-ada-polkadot-dot-polygon-matic-avax/ […]
… [Trackback]
[…] Find More on on that Topic: coinchapter.com/price-dogecoin-xrp-ada-polkadot-dot-polygon-matic-avax/ […]
… [Trackback]
[…] Here you will find 36136 more Information to that Topic: coinchapter.com/price-dogecoin-xrp-ada-polkadot-dot-polygon-matic-avax/ […]