
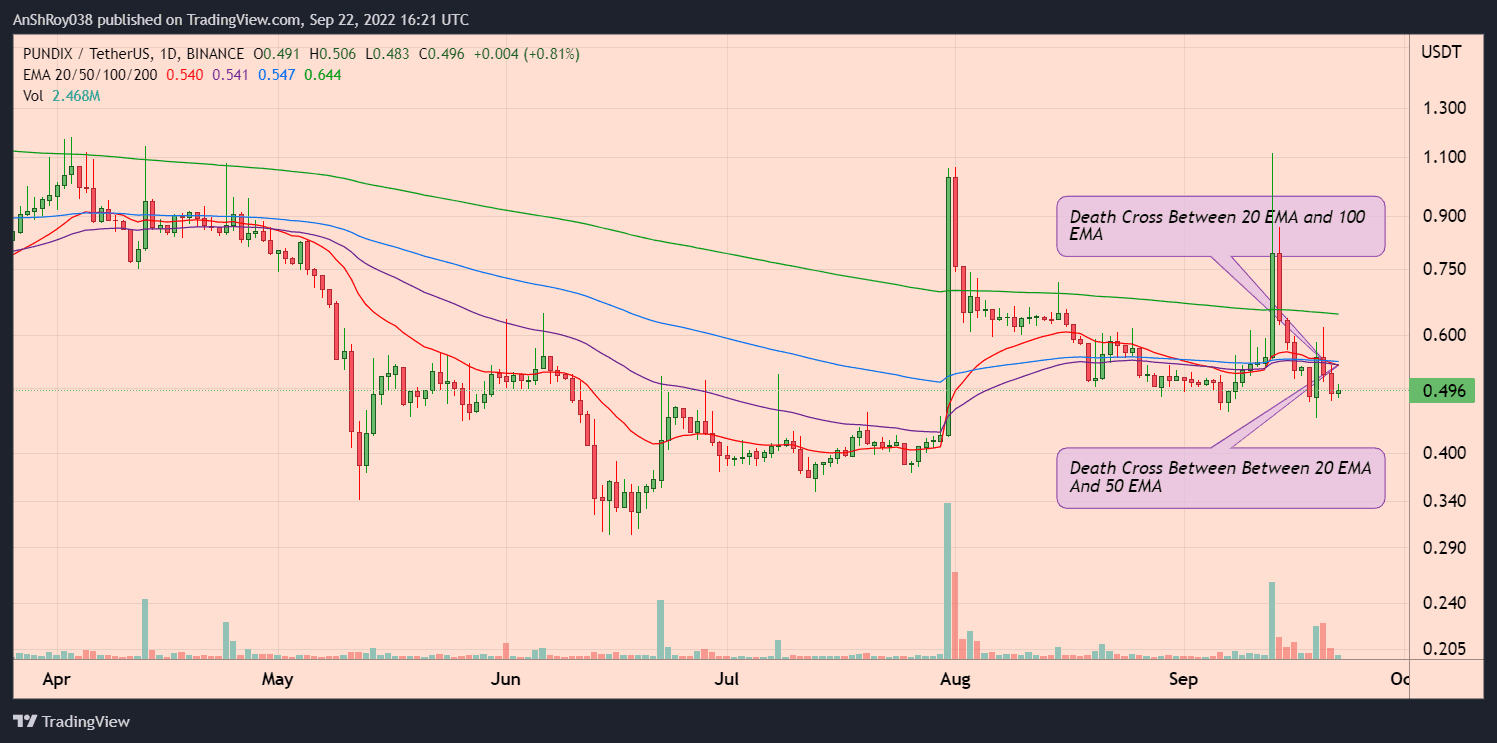
NEW DELHI (CoinChapter.com) — Retail business-focused blockchain platform Pundi X’s native token PUNDIX saw its prices tumble over the last ten days. PUNDIX prices dropped nearly 57% from Sept 13’s high of $1.12 to an intraday low of $0.48 on Sept 22.
As a result of the plunge, the exponential moving averages of the altcoin have formed two successive bearish patterns called the death cross. In detail, the pattern forms when a short-term moving average crosses below a relatively long-term moving average.
Traders consider the pattern an indicator of negative market sentiment. As a result, it might increase the selling pressure for PUNDIX tokens.
PUNDIX’s 20-day exponential moving average (20-day EMA, red wave) moved below its 100-day EMA (blue wave) and then the 50-day EMA (purple wave), forming two consecutive death crosses under two days.
The Pundi X token’s prices increased slightly on Sept 22 after falling nearly 22% between Sept 20’s high ($0.62) and Sept 21’s low ($0.48) levels. PUNDIX prices reached $0.51 on Thursday before the token pared gains.
PUNDIX MACD Suggesting Strong Bearish Momentum
Meanwhile, momentum oscillator MACD continues to trend downwards for the Pundi X token. Moreover, negative bars on the MACD histogram are expanding, indicating the MACD line (difference between 12-day and 26-day EMA) might be moving away from the MACD signal line (9-day EMA of MACD).
Also Read: Cardano Vasil hard fork countdown begins — Will ADA price undergo ETH-like drop?Expanding negative bars suggest increasing bearish momentum for PUNDIX. As such, the token might drop to test support near $0.47, which has supported PUNDIX price action since Aug 29. Moreover, a market wide sell-off might result in the token falling to $0.43, a drop of 14% from current levels.

Conversely, if PUNDIX prices continue increasing, the token will next target resistance near $0.52. A break above immediate resistance might see the token challenge a resistance confluence of 20-day EMA (red wave), 50-day EMA (purple wave), and 100-day EMA (blue wave).
A break above the resistance confluence would help propel PUNDIX prices to $0.57 before corrections pare gains. The relative strength index for Pundix remains neutral, clocking at 45.79 on the daily chart. The RSI trendline is currently moving horizontally.
At writing, PUNDIXUSDT was trading at $0.498, up 1.42% on the day.
Be wary of who to follow when seeking guidance. Turns out, Jim Kramer’s crypto predictions are as reliable as Terra’s UST-LUNA ecosystem. Here’s why

… [Trackback]
[…] Here you will find 79127 more Information to that Topic: coinchapter.com/pundi-x-pundix-sheds-57-ten-days-forms-two-successive-death-crosses/ […]
… [Trackback]
[…] Find More Information here to that Topic: coinchapter.com/pundi-x-pundix-sheds-57-ten-days-forms-two-successive-death-crosses/ […]
… [Trackback]
[…] There you can find 5395 more Info on that Topic: coinchapter.com/pundi-x-pundix-sheds-57-ten-days-forms-two-successive-death-crosses/ […]
… [Trackback]
[…] There you will find 93071 more Information on that Topic: coinchapter.com/pundi-x-pundix-sheds-57-ten-days-forms-two-successive-death-crosses/ […]