

- XRP price looks primed to print higher lows in the near term
- An upside correction to follow with XRP/USD retesting the $0.783 resistance
Jaipur (CoinChapter.com) — After bouncing 32% from the $0.5 support to near $0.74 in the last seven days, the XRP/USD pair is taking a breather. A new session of successive lower lows could follow. But the impending bearishness will be transitory, notes Twitter-based analyst, RESEARCH 24/7.
The analyst predicts a roughly 20% upside for Ripple’s cryptocurrency. But only after it has fulfilled its quota of retracement from the current local top. A classic bearish pennant formation defining last week’s price action confirms the bearish bias.
In the said scenario, the price of the 7th largest cryptocurrency could drop down to the $0.59 level. If bearish momentum continues further, even a retest of $0.58 or even $0.5 price is possible.
Also Read: Ripple starts the week lower over fears of 26mm XRP transfer
Although, RESEARCH 24/7 explains that liftoff will follow post the dip.
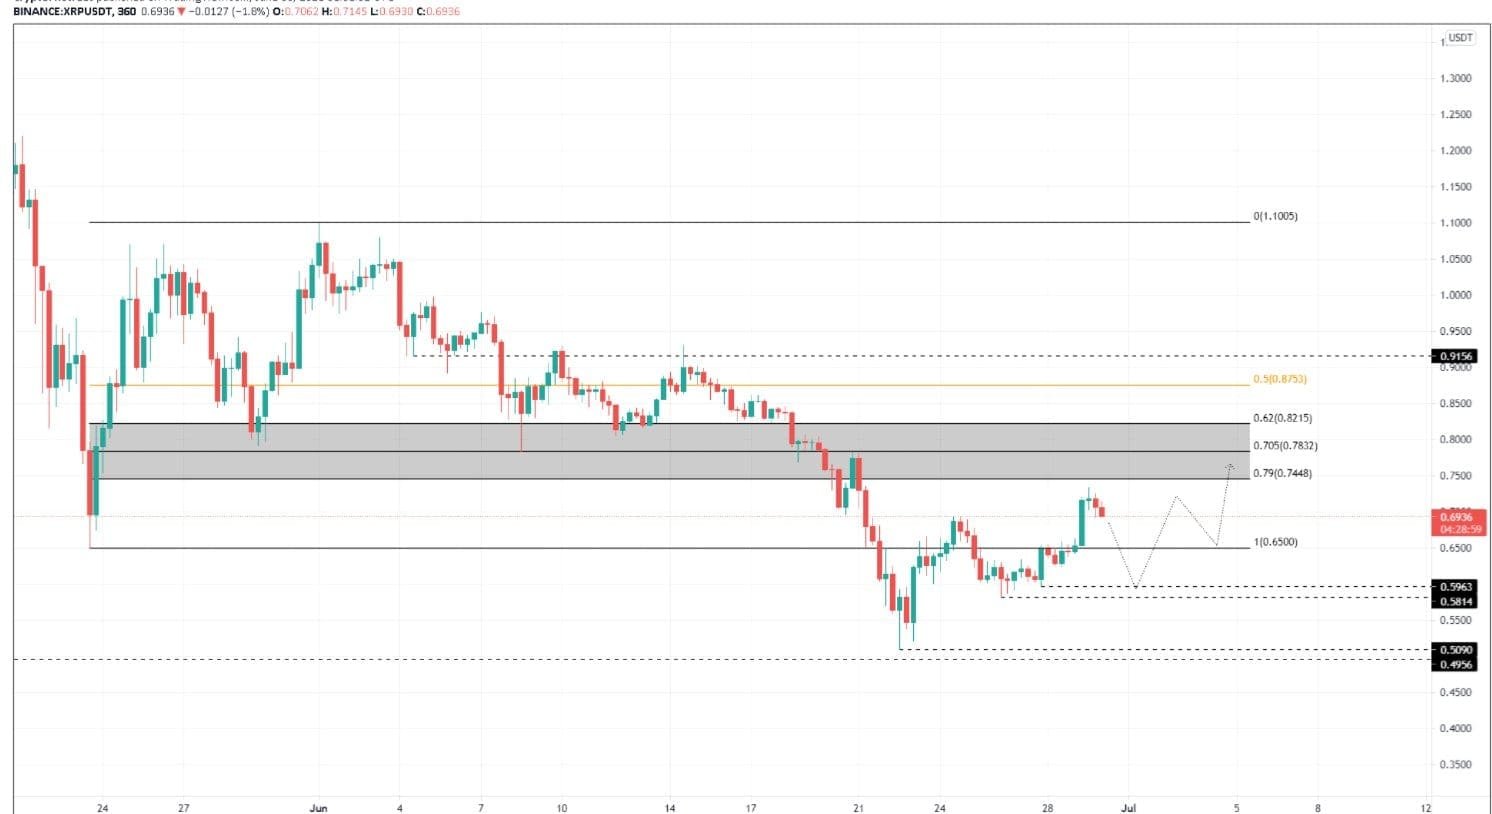
Ripple token prices could soar to spot rates near the $0.734 level. Another correction could take token prices down to $0.65 (higher low). But as XRP prints this higher low, “the resulting upswing for XRP price is expected to set up a higher high at the 70.5% Fibonacci retracement level at $0.783, coinciding with the swing high formed on June 14.” But how?
Also Read: A decent short-term bullish setup brewing in XRP markets—have a look
Fibonacci To The Rescue
RESEARCH 24/7, who goes by the handle “smallcappick,” stated that clues of XRP’s bullish upsurge are entrenched in Fibonacci retracement levels.
On May 23, the XRP/USD pair corrected 67% in the crypto market crash, from the highs at $1.9575 to find support at $0.65. But in the recovery attempts that followed, the $0.783 acted as a launchpad and then as crucial support until aggressive bearish pressure flipped it into resistance on June 19.
Therefore, flipping this support turned resistance level back to support could be a significant turning point for XRP price. Especially to turn the tide in favor of bulls. In Fibonacci retracement calculations, $0.783 coincides with the 70.5% Fibonacci retracement level. It lies equally between the 62% and 79% Fibonacci retracement levels, which coincide with $0.82 and $0.744 price points.
So, this is ideally a Fibonacci retracement range bounded by swing highs. In technical charts, swing highs are scenarios when an asset prints two consecutive highs (green candles) after a single high.
Smallcappick makes the bullish case for XRP/USD spot rates rebounding to the 70.5% Fibonacci retracement level or the $0.783 resistance level. And how is this bullish bounce supposed to work out?
Subsequent higher lows could lead to the formation of ascending triangle or symmetrical bullish triangle formations. A breakout from any of them could lead to XRP’s 20% flight to $0.783.

… [Trackback]
[…] Find More Information here to that Topic: coinchapter.com/ripple-xrp-to-rally-up-by-20-percent/ […]
… [Trackback]
[…] Find More Info here on that Topic: coinchapter.com/ripple-xrp-to-rally-up-by-20-percent/ […]
… [Trackback]
[…] There you will find 99314 additional Information on that Topic: coinchapter.com/ripple-xrp-to-rally-up-by-20-percent/ […]
… [Trackback]
[…] Find More on to that Topic: coinchapter.com/ripple-xrp-to-rally-up-by-20-percent/ […]
… [Trackback]
[…] Find More on that Topic: coinchapter.com/ripple-xrp-to-rally-up-by-20-percent/ […]
… [Trackback]
[…] Here you will find 84587 more Info to that Topic: coinchapter.com/ripple-xrp-to-rally-up-by-20-percent/ […]