Sei Network’s total value locked (TVL) has reached a record high of over $626 million, according to data from DeFiLlama. This sharp increase marks a major milestone for the layer-1 blockchain, as capital inflows and on-chain activity continue to accelerate.
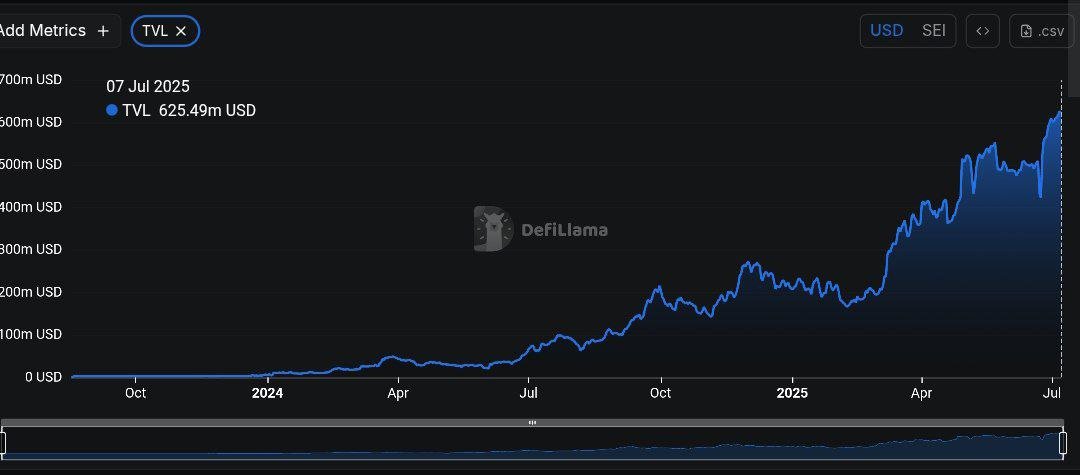
The latest figures show Sei’s TVL growing from just $60.8 million in mid-2024 to over $626 million in July 2025—an increase of more than 900% year-on-year. In comparison, most other chains recorded growth of only 10% to 50% during the same period.
Analysts Highlight Unusual Growth Rate
Crypto analyst Kyledoops posted on X that Sei’s rapid rise in TVL reflects growing market interest.
“With more capital flowing in and more on-chain activity picking up, the SEI ecosystem’s clearly pulling in fresh attention,”
he said.
Another user, Ronin, called Sei’s growth a “rare case” when comparing it with other major chains like Solana and Ethereum. The network’s ability to pull in liquidity at this pace sets it apart in the current DeFi landscape.
“I almost haven’t heard about SEI—but at the same time its TVL grew from $60.8M to $623M in a year. In comparison with other chains, their TVL grew literally by 10-50%. Rare cases where more.”
The chart shows that the majority of this growth occurred between late Q4 2024 and Q2 2025, following Sei’s regulatory approval in Japan. Daily inflows reached $379 million in the past 24 hours alone, while stablecoin market cap on Sei now stands at $283 million—an 8.4% increase over seven days.
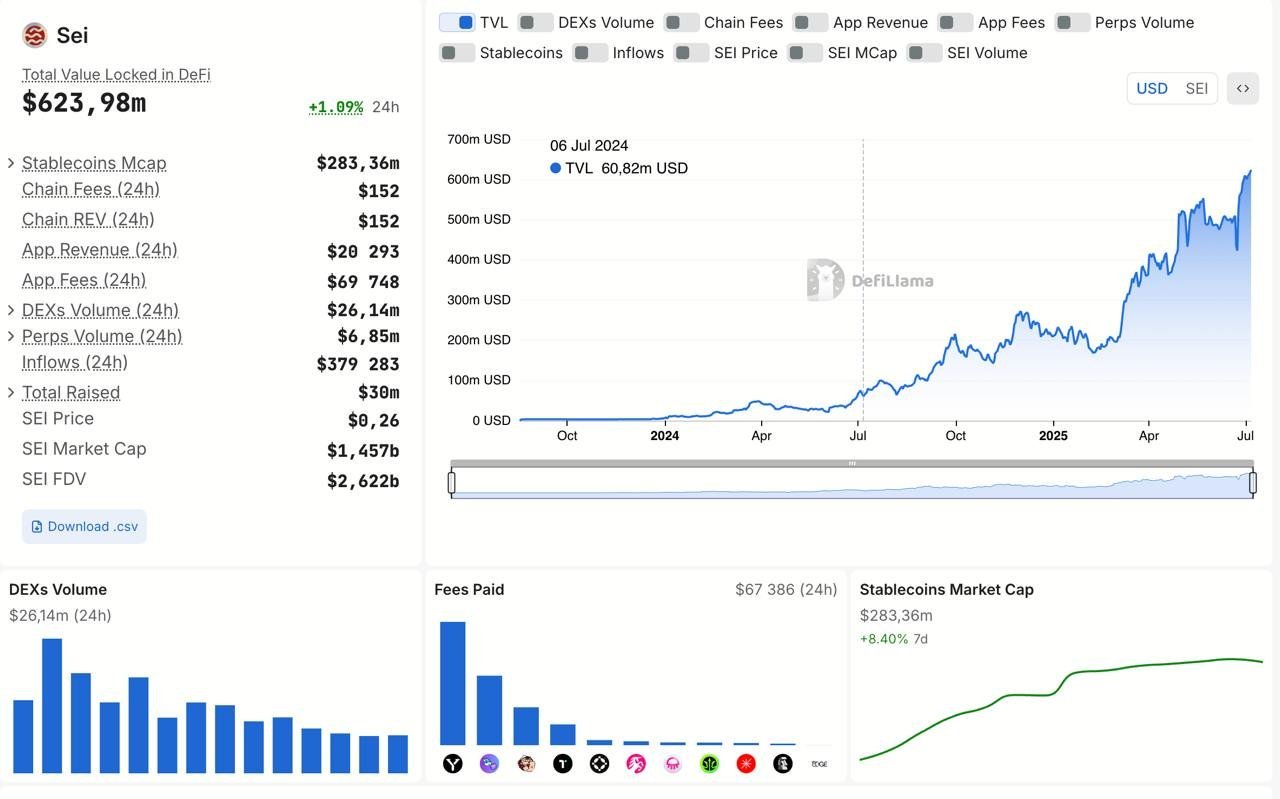
Key 24-hour metrics (July 6, 2025):
App revenue: $20.29k
Chain fees: $152
DEX volume: $26.14 million
Perps volume: $6.85 million
SEI price: $0.26
SEI market cap: $1.457 billion
The spike in TVL aligns with higher user engagement across DeFi apps on Sei. The chain collected over $67,000 in fees in the last 24 hours. At the same time, decentralized exchange (DEX) activity has held strong, as shown by consistent volume bars.
Ronin’s post questioned whether this growth merits deeper exploration of the SEI ecosystem. The underlying data appears to support that. The network now draws enough capital to compete with longer-established chains, despite operating under the radar for many users over the past year.
While Ethereum and Solana remain dominant in DeFi, their TVL growth over the past year has not matched Sei’s pace. This difference, pointed out in Ronin’s tweet, shows that Sei’s adoption curve may be entering a new phase—supported by institutional interest and expanding global access.
Regulatory Approval in Japan Boosts Adoption
A key driver behind Sei’s rising momentum is its recent approval by the Japan Financial Services Agency (JFSA). The approval allows Sei to operate in one of the most strictly regulated crypto markets globally, unlocking access to Japan’s retail and institutional user base.
Following this regulatory breakthrough, Artemis Analytics recorded a sharp increase in daily active addresses. On July 4, the count jumped to 766,000—the highest since early January. This marks a clear shift in user engagement, with activity rising consistently from mid-April and accelerating after the JFSA decision.
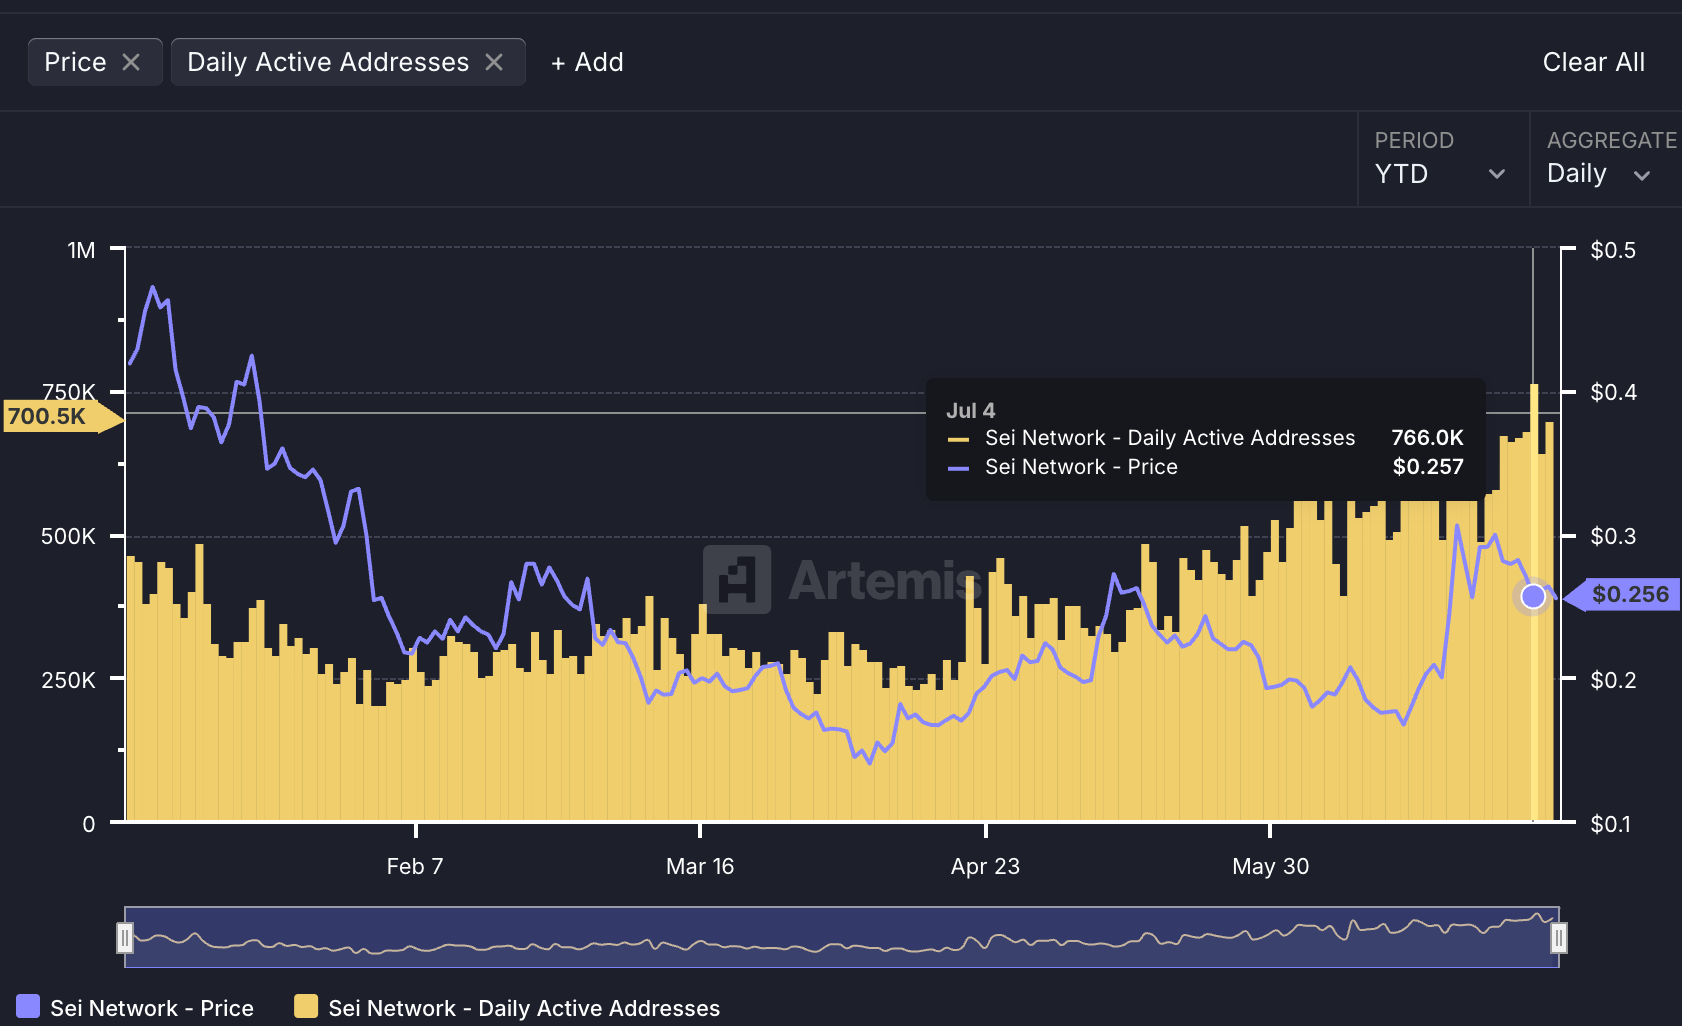
The image also shows Sei Network holding above 700,000 active addresses for multiple days, signaling sustained user participation. While the SEI price fluctuated between $0.25 and $0.30 during this surge, the rise in wallet activity points to deeper on-chain usage beyond short-term speculation.
SEI Forms Bearish Pattern but Eyes 71% Jump if Breakout Confirms
On July 8, 2025, SEI/USDT formed a descending triangle pattern on the 4-hour chart, as shown on TradingView. A descending triangle is a bearish structure where the price keeps making lower highs while testing a flat support level. However, in some cases—especially when momentum flips—this pattern may break upward, leading to a sharp price move.
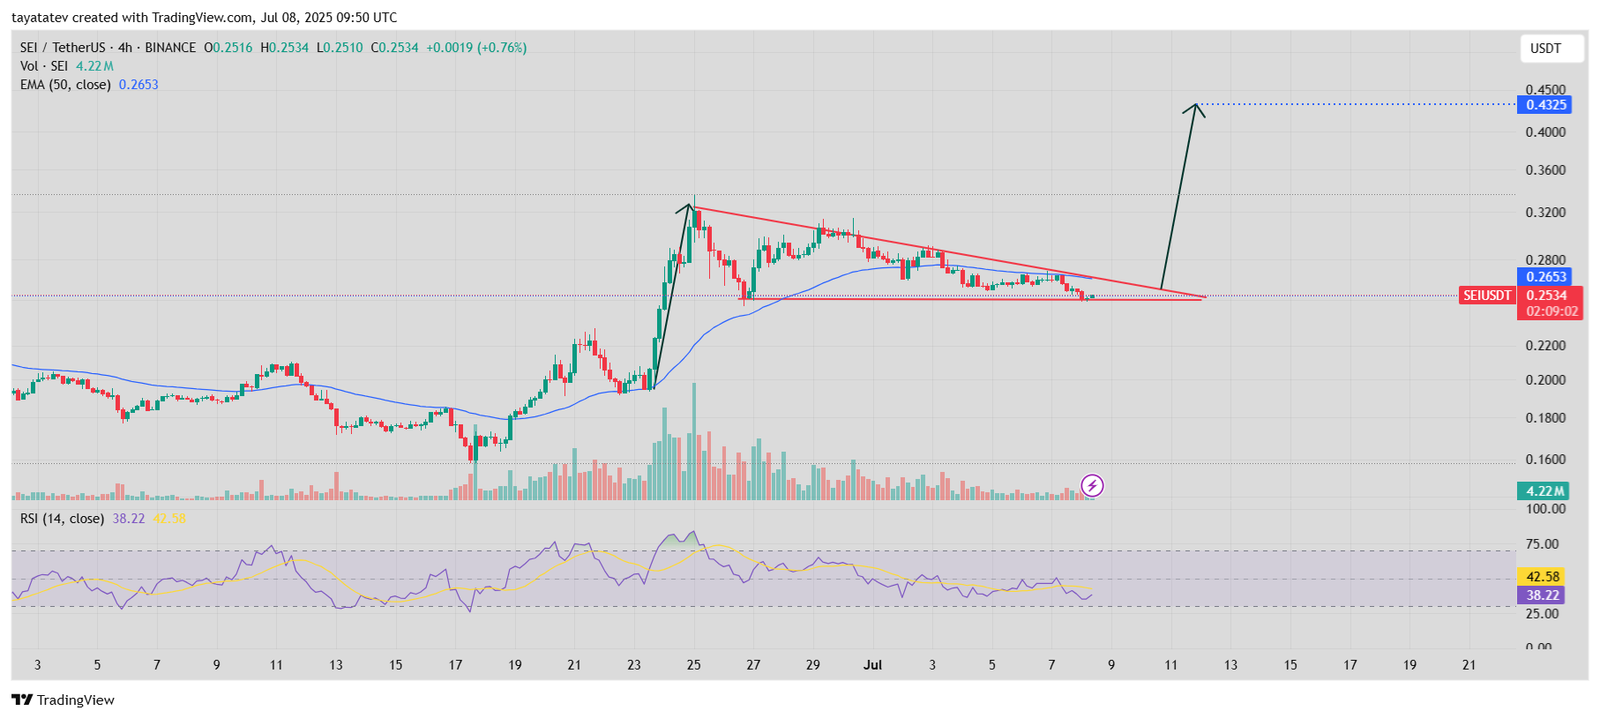
SEI currently trades at $0.2534, slightly below its 50-period exponential moving average, which sits at $0.2653. The pattern has now reached its apex, with the price hovering just above the horizontal support line. Trading volume is low, indicating that traders may be waiting for confirmation before reacting. The relative strength index, or RSI, is at 38.22, which shows weak momentum but still leaves room for upside movement.
If the breakout confirms, the projected target is $0.4325. This would mark a 71% rally from the current level. The expected surge mirrors the height of the triangle’s base—calculated from the last major high to the flat support zone—applied to the breakout point.
For now, SEI hovers near its support, testing the lower edge of the triangle. The next move will depend on whether buyers return with strong volume. If that happens, the technical setup points to a clear upside path, despite recent weakness. Until then, the market watches closely for any decisive move beyond the triangle’s boundaries.
MACD Shows Weak Momentum Ahead of Potential SEI Breakout
On July 8, 2025, the Moving Average Convergence Divergence (MACD) indicator for SEI/USDT remains below the zero line, signaling that bearish momentum still lingers. The MACD line (blue) trades slightly under the signal line (orange), with values at -0.0044 and -0.0037, respectively.
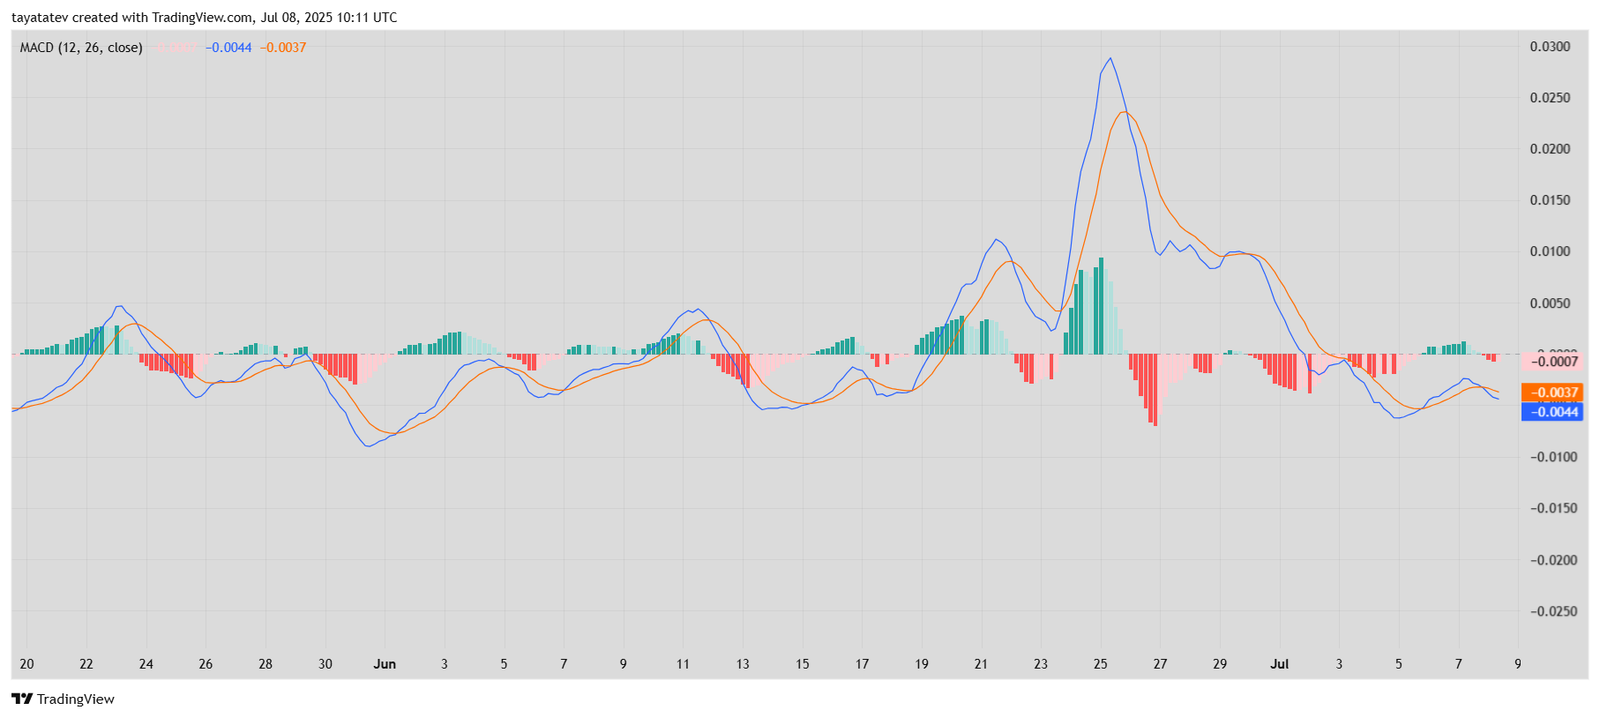
This setup suggests that the market hasn’t shifted into bullish mode yet. Momentum weakened after SEI peaked in late June, as shown by the fading green histogram bars followed by an extended red sequence. Since then, both the MACD and signal lines have flattened, staying close together with no strong divergence.
However, the gap between the two lines is narrowing, which could point to an incoming crossover. If that happens and the MACD line breaks above the signal line while crossing into positive territory, it would confirm the momentum shift needed to fuel the breakout shown in the triangle chart.
Until then, SEI remains in a neutral-to-weak zone, awaiting stronger signals. For bulls, the MACD must flip and align with the price breakout to support the move toward the projected $0.4325 target.
